A standardized shear-wave and strain elastography follow-up protocol was applied before and after thyroid nodule radiofrequency ablation to quantify stiffness changes longitudinally. Using mixed-effects modeling and multivariable regression, early post-ablation elastography changes were independently associated with 12-month volume reduction response.
A subscription to JoVE is required to view this content. Sign in or start your free trial.
Research Article
Elastography-Based Evaluation of Treatment Response Following Radiofrequency Ablation of Thyroid Nodules
In This Article
Summary
Abstract
Radiofrequency ablation (RFA) is an established minimally invasive treatment for benign thyroid nodules, yet response assessment relies largely on delayed volume reduction, limiting early post-procedural decision-making. In this retrospective cohort, participants with a single index thyroid nodule underwent standardized B-mode ultrasound and elastography at baseline, immediately post-ablation, and at 1, 3, 6, and 12 months. Shear-wave elastography (SWE) stiffness and strain ratio were acquired using prespecified regions of interest and quality-control criteria. Twelve-month response was defined by a volume reduction ratio (VRR) ≥ 50%. Longitudinal changes were evaluated using linear mixed-effects models, and immediate post-RFA elastography changes (immediate minus baseline) were related to 12-month VRR using correlation and multivariable regression adjusted for baseline nodule volume, nodule composition, delivered energy, and age. Among the 187 included participants, 146 were responders, and 41 were non-responders. SWE increased immediately after RFA in responders (31.5 ± 5.1 kPa to 41.7 ± 5.6 kPa) and non-responders (35.1 ± 5.3 kPa to 43.4 ± 5.8 kPa), followed by progressive decline with lower 12-month SWE in responders than non-responders (21.6 ± 4.7 vs 31.2 ± 5.2 kPa). VRR separated early, with 12-month VRR of 73.6 ± 6.9% in responders versus 38.5 ± 8.7% in non-responders. In mixed-effects models, the immediate SWE increase was significant (estimate +10.22 kPa, P < 0.001), and late group divergence was evident (non-responder × 12 months estimate +9.41 kPa, P < 0.001). Early elastography change correlated with 12-month VRR (Δstrain ratio: r = 0.445, P < 0.001; ΔSWE: r = 0.302, P < 0.001) and remained independently associated with VRR in adjusted models (Δstrain ratio β = 14.80% per +1.0, P < 0.001; ΔSWE β = 1.80% per +5 kPa, P = 0.011). Immediate post-RFA elastography changes capture early tissue effects and provide independent prognostic information for 12-month volumetric response.
Introduction
Thyroid nodules have become a defining “disease of detection” in modern endocrine practice, not because their biology has abruptly changed, but because imaging has made the thyroid exquisitely visible1,2,3. The measured prevalence depends strongly on how nodules are sought: classic epidemiologic syntheses estimate 2%–6% by palpation, approximately 19%–35% by ultrasound, and up to about 8%–65% in autopsy series, illustrating how method sensitivity reshapes the apparent epidemiology1. In iodine-deficient settings and with high-frequency transducers, ultrasound surveys can report even higher detection rates; for example, a population-based investigation using 13-MHz technology identified nodules in 68% of adults, emphasizing both the influence of equipment and the underlying susceptibility of the thyroid to nodular change across the lifespan2. China provides a particularly vivid view of scale because ultrasound is frequently incorporated into health examinations. In a national health examination cohort including 6,985,956 participants, the overall prevalence of thyroid nodules was 36.9%, with an age- and sex-standardized prevalence of 38.0%, and a marked female predominance3. Even when most detected lesions are clinically indolent, the aggregate consequences are substantial, including repeated imaging, procedural cascades, heightened symptom vigilance, and a persistent tension between reassurance and intervention. This tension is most acute for benign nodules that are symptomatic, cosmetically conspicuous, or demonstrably enlarging, where “benign” does not equate to “inconsequential”, and where patient-centered outcomes often hinge on whether a therapy can relieve local effects while preserving function and avoiding surgical morbidity.
Over the past decade, ultrasound-guided thermal ablation has moved from niche adoption to an increasingly established alternative to surgery for selected thyroid nodules, particularly benign solid or predominantly solid nodules and, in carefully chosen contexts, recurrent lesions4,5. Radiofrequency ablation (RFA) has become the flagship technique because it couples real-time sonographic visualization with controllable energy delivery and a complication profile that is favorable in experienced hands4,5. Beyond the obvious appeal of avoiding a cervical scar and general anesthesia in many cases, RFA aligns with an organ-sparing philosophy in which the lesion is remodeled while thyroid reserve is preserved. Contemporary outcome reporting has converged on the volume reduction ratio (VRR), commonly evaluated at 6 to 12 months, with treatment success in many series and pooled analyses defined using thresholds such as at least 50% volume reduction at 1 year6. Yet volume reduction is inherently a late surrogate. The biological effect of ablation begins immediately with protein denaturation and coagulative necrosis, then evolves through inflammation, resorption, and fibrosis over weeks to months6. As a result, the earliest clinically decisive question, namely, to provide additional information regarding early post-ablation tissue response, often cannot be answered with confidence using size alone4,6. Doppler vascularity and grayscale echotexture add useful context, but they remain indirect measures of tissue transformation, and they can be confounded in the early post-procedural window by reactive hyperemia, edema, or heterogeneous necrotic change. An early, objective signal of adequate treatment could rationalize follow-up intensity, help anticipate the likelihood of delayed volume response, and may help identify patients with less favorable longitudinal response patterns before months of watchful waiting consolidate into persistent symptoms or regrowth2,3.
Elastography is compelling in this setting because it measures a physical property that ablation is designed to change. Ultrasound elastography, encompassing strain-based and shear-wave techniques, characterizes tissue stiffness semi-quantitatively through deformation patterns or quantitatively through shear-wave velocity and derived elastic modulus7. In thyroid imaging, elastography has been extensively evaluated as an adjunct for malignancy risk stratification. However, rigorous testing has tempered early enthusiasm regarding its incremental diagnostic value over conventional ultrasound in broad clinical populations, reminding the field that elegant physics does not guarantee clinical gain in every context8. The post-ablation problem is different. Here, the target lesion is known and treated. The task is not histologic discrimination but response assessment, and the core biological transition is from viable, deformable tissue toward a less compliant necrotic and fibrotic composite. Early clinical investigations across thermal modalities support this mechanistic premise. In patients undergoing microwave ablation, elastography-based scoring demonstrated measurable structural alteration after therapy and was proposed as a feasible follow-up tool9. In RFA cohorts, elastography has been explored as a method to quantify stiffness changes in treated nodules and adjacent reference tissues, offering a potential window into ablation-induced remodeling that may precede macroscopic shrinkage10. Technical learning-curve work has also incorporated strain elastography as part of sonographic characterization around the procedure, reflecting a growing, although still inconsistent, recognition that stiffness patterns can add information beyond size11. Taken together, these studies suggest that elastography could evolve from a diagnostic adjunct into a response biomarker. However, lack of protocol standardization and variability in acquisition methods remain important barriers to broader clinical implementation10,11. Existing reports vary in elastography modality, acquisition parameters, region-of-interest strategy, reference tissue selection, and assessment timing, which makes it difficult to translate stiffness changes into clinically robust rules that can guide early decision-making across operators and platforms.
This study was designed to address that translational gap by evaluating an elastography-based approach for assessing treatment response following RFA of thyroid nodules, with explicit attention to practical implementation in routine follow-up. The central premise of the present study is that response after RFA is fundamentally a biomechanical process that begins with thermal injury and progresses through longitudinal structural and stiffness changes after ablation, and that stiffness metrics should therefore change in a directionally consistent and clinically interpretable manner. It was hypothesized that elastography-derived indices would demonstrate systematic post-ablation shifts consistent with treatment effect, track the response trajectory over follow-up, and provide complementary information to conventional endpoints such as VRR and Doppler vascularity, particularly in the early period when size-based assessment is least informative4,6,7. The novelty of the present study lies in reframing elastography from an additional feature for malignancy discrimination to an objective, quantifiable readout of post-ablation tissue transformation, and in aligning elastography measurements with the clinical questions that drive management after RFA, including longitudinal treatment response assessment and characterization of post-ablation stiffness change during follow-up. If elastography can reliably operationalize these questions, it has the potential to shorten the feedback loop between intervention and outcome, potentially enabling earlier characterization of longitudinal response patterns after RFA while preserving the minimally invasive advantages that have made thyroid RFA an increasingly important option for patients with benign but burdensome nodules4,6.
Access restricted. Please log in or start a trial to view this content.
Protocol
Ethics statement
All procedures involving human participants were conducted in accordance with the institutional guidelines of Xingtai Hospital and in compliance with the principles of the Declaration of Helsinki and its later amendments. The study was reviewed and approved by the Human Research Ethics Committee of Xingtai Hospital; because all participants provided standard written clinical informed consent for RFA and ultrasound examinations as part of routine care, the committee approved the study with a waiver of additional written research consent and permitted verbal consent for study participation where required. Participant confidentiality was protected through secure, access-restricted data management, with de-identification of all study data prior to analysis.
Study design and overall schematic
This study was designed as a retrospective, single-center clinical cohort to evaluate elastography-based assessment of treatment response following ultrasound-guided RFA of thyroid nodules. Consecutive eligible patients undergoing RFA at our institution were screened and enrolled until a predefined target of 187 participants was reached. To ensure analytic independence and to avoid within-patient clustering, only one index nodule per participant was included, defined a priori as the nodule selected for treatment at the index ablation session. Patients with diffuse thyroid diseases that could substantially affect background thyroid stiffness measurements, including diffuse Hashimoto thyroiditis with marked heterogeneous parenchymal involvement, uncontrolled Graves disease, diffuse thyroiditis, or diffuse goiter, were excluded. Isolated thyroid autoantibody positivity without diffuse structural thyroid abnormality on ultrasound was not considered an exclusion criterion.
The study followed a standardized longitudinal workflow. Baseline clinical evaluation and imaging were performed within 2 weeks before ablation and included conventional ultrasound, Doppler assessment, and elastography acquisition using a prespecified protocol. RFA was conducted under real-time ultrasound guidance according to institutional standards. Immediate post-ablation imaging was obtained within 30 min of energy delivery to document technical success and acute tissue changes. Scheduled follow-up visits were conducted at 1, 3, 6, and 12 months after ablation, with repeat ultrasound and elastography performed at each time point using identical acquisition settings and measurement strategies to minimize technical variability.
Sample size calculation and statistical assumptions
The primary endpoint for sample size estimation was the within-nodule change in quantitative elastography at 1 month after ablation compared with baseline, expressed as the difference in mean stiffness (for example, elastic modulus in kPa) measured using a standardized region of interest strategy. Because the primary analysis compares paired measurements within the same nodule, the sample size was estimated using a paired mean difference framework. Let Δ denote the expected mean change in stiffness from baseline to 1 month, and let σd denote the standard deviation of the paired differences. For a two-sided test at significance level α with power 1−β, the required sample size is:
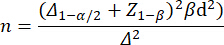
Using α = 0.05 (two-sided) and power 1−β = 0.80, Z1−α/2 = 1.96 and Z1−β = 0.84. Based on pilot measurements and published post-ablation variability in thyroid elastography, this study assumed βd = 35 kPa and a conservative clinically meaningful change Δ = 8 kPa. This yields a minimum required sample size of at least 150 participants for the primary paired analysis of elastography-derived stiffness before and after RFA.
Baseline clinical assessment prior to ablation
At enrollment, a standardized clinical history was obtained with emphasis on nodule-related symptoms and factors relevant to procedural safety. Age, sex, anthropometric measures, and pertinent comorbidities, including cardiovascular and pulmonary disease, diabetes mellitus, chronic kidney disease, and prior neck surgery or irradiation, were recorded. Current medications were documented, with particular attention to antiplatelet agents and anticoagulants, and any planned peri-procedural adjustments according to institutional policy were recorded. The indication for RFA was confirmed, specifying whether the primary driver was compressive symptoms, cosmetic concern, documented growth on serial imaging, or a combination of these factors.
Baseline symptom burden was established using a prespecified instrument. Local compressive symptoms such as dysphagia, throat pressure, foreign-body sensation, dyspnea, and voice-related complaints were assessed, and their severity was documented using a numeric rating scale or an institutionally adopted symptom score. When cosmetic impact was an indication, the cosmetic appearance was graded using a standardized cosmetic scale, and patient-reported dissatisfaction was recorded. Relevant thyroid history, including duration of nodule awareness, prior fine-needle aspiration results, prior benign cytology confirmation strategy (single versus repeated sampling as required), and any previous medical therapy for thyroid disease, was captured.
Baseline laboratory testing was obtained according to routine clinical practice, including thyroid-stimulating hormone and additional thyroid function parameters where indicated. Cytology and pathology reports confirming benign status for the index nodule, as well as any ultrasound risk stratification documentation if available, were reviewed and recorded. A baseline safety assessment, including vital signs and a focused airway evaluation when the nodule abutted the trachea or caused symptoms suggestive of airway compromise, was established. The planned follow-up schedule was documented, and standardized pre-imaging instructions, including avoidance of swallowing during elastography acquisition, were reinforced to improve measurement consistency across visits.
Conventional ultrasound acquisition and nodule volume measurement
Grayscale ultrasound was performed with the patient supine and the neck gently extended. A standardized imaging preset was used, and key settings were kept consistent across visits, including frequency range, depth, focus, gain, and dynamic range. Frame rate, elastography scale range, persistence, and smoothing settings were kept constant across baseline and follow-up examinations. Ultrasound examinations were performed using a high-frequency linear-array transducer (5–14 MHz) equipped with shear-wave and strain elastography functionality. All ultrasound and elastography examinations were performed using the same ultrasound platform and software version throughout the study period to minimize inter-system variability in stiffness measurements. Transverse and longitudinal views that clearly delineated the nodule margins and adjacent anatomic landmarks were acquired. The maximal orthogonal diameters of the index nodule—anteroposterior (A), transverse (B), and longitudinal (C)—were measured. Electronic calipers were placed at the outer edge of the nodule on frozen images, avoiding inclusion of surrounding parenchyma or perinodular halo. All measurements were recorded in millimeters and, when feasible, each dimension was repeated and the mean value was used. Nodule volume was calculated using the ellipsoid formula:
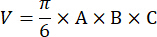
The same measurement approach was repeated at each follow-up visit. The VRR was computed as:

Elastography acquisition and quality control
Elastography was performed immediately after conventional ultrasound with the patient supine and the neck extended. The patient was asked to avoid swallowing and to briefly suspend breathing during acquisition to minimize motion artifacts. The same elastography mode and settings were used at all visits.
For shear wave elastography, the sampling box was placed to include the solid portion of the index nodule and, when feasible, adjacent normal thyroid tissue at a similar depth. Circular regions of interest were positioned preferentially within the central solid component of the nodule while avoiding cystic degeneration, macrocalcification, peripheral halo regions, and obvious post-ablation cavitary change. After region-of-interest placement, image acquisition was initiated only when the elastography color map remained visually stable for at least 3–5 s. Perinodular stiffness assessment was not systematically incorporated into the predefined acquisition protocol because the primary study objective focused on longitudinal stiffness evolution within the treated nodule itself. At least three technically adequate measurements were obtained, and the median stiffness value was recorded as the primary metric; the interquartile range was documented when available.
For strain elastography, gentle, consistent compression was applied guided by the system’s quality indicator. Compression was applied manually at a slow, rhythmic frequency while monitoring the real-time quality indicator provided by the ultrasound system. Excessive probe pressure, causing visible deformation of the thyroid capsule or unstable elastography color mapping, was avoided. A reference region of interest was defined in adjacent normal thyroid tissue at a similar depth, and the strain ratio was calculated. Each elastography acquisition sequence was maintained for approximately 5–10 s to ensure image stabilization and reproducible sampling. At least three acceptable measurements were acquired, and the median value was recorded.
Measurements were accepted only when the elastography map was stable, region-of-interest placement followed the prespecified rules, and there was no gross motion or compression artifact. Measurements with incomplete color filling, obvious signal voids within the region of interest, or marked frame-to-frame fluctuation were rejected and reacquired. Ultrasound and elastography examinations were performed in a temperature-controlled examination room to minimize environmental influences on tissue stiffness measurements. Representative elastography images with the corresponding B-mode images were stored at each time point for traceability and quality review.
RFA procedure
RFA was performed under continuous ultrasound guidance by operators who had completed institutional training in thyroid ablation techniques, had more than 5 years of experience in thyroid ultrasound-guided interventions, and had each performed more than 200 thyroid RFA procedures before study initiation. The patient was positioned supine with the neck extended. The cervical region was prepared and draped using standard sterile technique. Local anesthesia was administered according to routine practice; conscious sedation was used when clinically indicated, with continuous monitoring of vital signs.
The radiofrequency electrode was introduced into the index nodule under real-time ultrasound guidance, preferentially using a transisthmic approach to improve electrode stability and to minimize unintended displacement. When the index nodule was adjacent to the trachea, carotid sheath, esophagus, or recurrent laryngeal nerve region, hydrodissection was performed by slow injection of sterile fluid under ultrasound guidance to maintain a visible separation between the ablation zone and adjacent critical structures throughout energy delivery.
Radiofrequency energy was delivered using a moving-shot technique, beginning in the deepest portion of the nodule and progressing systematically toward the superficial regions to achieve overlapping ablation zones. Each ablation unit was treated until transient hyperechoic change occupied the targeted area before the electrode tip was repositioned to the adjacent untreated portion. Power output was adjusted in response to real-time echogenic changes and patient tolerance, and ablation was continued until the targeted nodule demonstrated the expected transient hyperechoic change and intranodular vascularity was markedly reduced on Doppler assessment. Adequate ablation was additionally supported by visualization of a continuous hyperechoic zone covering the targeted treatment unit without obvious residual intranodular vascular signals.
Key procedural parameters, including ablation time, power range, estimated delivered energy, use of hydrodissection, and any intraprocedural events, were recorded. After completion of ablation, the patient was observed according to institutional protocol, and standardized post-procedural instructions were provided. Ablation was temporarily interrupted or terminated when patients developed significant pain, voice change, uncontrolled coughing, progressive swelling, or other findings raising concern for thermal injury or procedural complications.
Immediate post-ablation imaging and documentation
Within 30 min after completion of RFA, an immediate post-procedural ultrasound examination was performed using the same imaging presets as baseline. Grayscale images were acquired to document the extent of the treated area and to identify typical post-ablation features, including transient hyperechogenicity and changes in internal architecture. Intranodular and perinodular vascularity were assessed using color or power Doppler to confirm reduction or absence of blood flow within the ablated zone.
Elastography acquisition was repeated after transient procedure-related motion had resolved and the patient was able to maintain stable breath suspension, following the identical acquisition protocol used at baseline. Stiffness values were recorded, and representative elastography maps together with corresponding B-mode images were stored. Any technical limitations encountered during acquisition, such as patient discomfort or motion artifacts, were documented. These immediate post-ablation images served as a procedural reference and were not used as the primary endpoint but provided context for subsequent longitudinal changes.
Follow-up schedule and standardized endpoints
Follow-up visits were scheduled at 1 month, 3 months, 6 months, and 12 months after ablation. At each visit, a standardized evaluation was performed, including symptom assessment, cosmetic grading when applicable, conventional ultrasound, and elastography using the same acquisition parameters and measurement strategy as at baseline. The primary elastography endpoint was the change in stiffness of the index nodule relative to baseline at predefined follow-up time points, with particular emphasis on early change at 1 month. The primary conventional imaging endpoint was the VRR at 12 months. Secondary endpoints included VRR at earlier follow-up visits, longitudinal stiffness trajectories, and the presence of residual or recurrent vascularized tissue within the treated area. Adverse events and any additional interventions during follow-up were recorded systematically.
Data management and blinding
Each participant was assigned a unique study identifier to ensure anonymization. Clinical data and imaging files were stored in a secure institutional database with access restricted to authorized study personnel. Elastography and volumetric measurements are performed by trained readers who are blinded to clinical symptom scores and prior elastography results when feasible. To ensure consistency, maintain a written measurement manual specifying region-of-interest placement rules, image quality criteria, and calculation procedures. In cases of substantial inter-reader discrepancy exceeding a prespecified threshold, measurements are reviewed jointly and resolved by consensus. All changes to the dataset are logged to preserve an audit trail. All ultrasound and elastography acquisitions were performed by operators with prior experience in thyroid ultrasound and RFA imaging assessment who underwent protocol-specific training before study initiation. Stored images were reviewed offline using the same predefined region-of-interest placement rules and quality-control criteria applied during acquisition.
Statistical analysis
Continuous variables were assessed for distributional characteristics using visual inspection of histograms and the Shapiro–Wilk test. Normally distributed variables are presented as mean ± standard deviation, whereas non-normally distributed variables are summarized as median with interquartile range. Categorical variables are reported as counts and percentages. The primary analytical objective was to evaluate within-nodule changes in elastography-derived stiffness following RFA. For the primary paired comparison between baseline and post-ablation time points, differences in stiffness values were analyzed using paired t tests when the distribution of paired differences approximated normality; otherwise, the Wilcoxon signed-rank test was applied. Effect sizes are reported as mean or median changes with corresponding 95% confidence intervals where appropriate. To characterize longitudinal changes in elastography measurements across all follow-up visits (baseline, immediate post-ablation, 1 month, 3 months, 6 months, and 12 months), linear mixed-effects models were constructed with random intercepts at the participant level to account for within-subject correlation. Time was modeled as a categorical fixed effect rather than as a continuous variable because post-ablation biomechanical changes were not expected to follow a linear trajectory across follow-up visits. In particular, the study design anticipated an acute immediate post-ablation stiffness increase followed by progressive remodeling and late decline, making categorical modeling more appropriate for capturing potentially non-linear temporal response patterns without imposing linearity assumptions. Model assumptions were evaluated by inspection of residual plots. When appropriate, stiffness values were log-transformed to improve model fit. Associations between elastography-derived stiffness changes and conventional treatment response metrics were explored in secondary analyses. Correlation between early stiffness change and VRR at subsequent follow-up was assessed using Pearson or Spearman correlation coefficients, depending on data distribution. Multivariable regression models were used to examine whether early elastography changes independently predicted later volumetric response after adjustment for baseline nodule volume, nodule composition (solid versus predominantly solid), delivered energy, and age. Interaction terms between subgroup variables and time were tested within the mixed-effects modeling framework. For longitudinal analyses, mixed-effects models inherently accommodate missing observations under the assumption of missing at random. All statistical tests were two-sided, and a P value < 0.05 was considered to indicate statistical significance.
Access restricted. Please log in or start a trial to view this content.
Results
Study design and overall schematic
The excluded participants did not meet predefined eligibility criteria, had incomplete baseline imaging data, or lacked standardized longitudinal follow-up. Among the 187 included participants, complete 12-month outcome classification was available for all cases included in the primary analysis, although isolated intermittent missing observations at individual follow-up visits were accommodated within the mixed-effects modeling framework (Figure...
Access restricted. Please log in or start a trial to view this content.
Discussion
This study evaluated an elastography-based approach for assessing treatment response after RFA of thyroid nodules by using elastography as a quantitative imaging biomarker associated with post-ablation stiffness change. The central proposal is that stiffness, measured by SWE and strain elastography, can serve as an early indicator of ablation effect and a longitudinal marker of post-ablation remodeling, complementing conventional volume-based endpoints. The findings support this concept at two levels. First, both SWE sti...
Access restricted. Please log in or start a trial to view this content.
Disclosures
The authors declare no competing interests.
Acknowledgements
The authors are grateful to the Department of Endocrinology for assistance with clinical evaluation, follow-up coordination, and thyroid function assessment. Appreciation is also extended to the Interventional Radiology team for procedural support and peri-procedural patient care, and to the Department of Pathology for cytology review and diagnostic guidance when applicable. The contributions of the nursing staff, outpatient clinic coordinators, and study participants are sincerely acknowledged.
Access restricted. Please log in or start a trial to view this content.
Materials
| Name | Company | Catalog Number | Comments |
|---|---|---|---|
| 3M Tegaderm Film Dressing | Tegaderm | https://www.3m.com/3M/en_US/p/c/medical/bandages-dressings/film/i/health-care/medical/ | Adhesive dressing; Post-procedure site coverage. |
| Disposable syringe | Becton Dickinson | BD 309628 | Hydrodissection and local anesthetic administration |
| Grounding pads for RFA | 3M Healthcare | Model 9547 | Single-use return electrodes compatible with RF. |
| High-frequency linear-array transducer (5–14 MHz) | SuperSonic Imagine | SL15-4 linear probe | Thyroid ultrasound and elastography acquisition |
| High-frequency linear-array ultrasound transducer (7–15 MHz) | Mindray | L11-3U | Linear probe optimized for thyroid imaging and elastography. |
| IntelliVue | Philips Healthcare | MX450 | Patient monitoring system; ECG, SpO2, noninvasive BP monitor during RFA. |
| IntelliVue | Philips Healthcare | MP50 | Vital signs monitor; Continuous peri-procedural monitoring |
| Lidocaine hydrochloride injection | Hospira Inc. | NDC 0409-4276-17 | Local anesthesia before ablation |
| lme4 package | CRAN | RRID:SCR_015654 | Linear mixed-effects modeling in R. |
| lmerTest package | CRAN | RRID:SCR_015656 | Mixed model testing and p-values in R. |
| Microflex Powder-Free Gloves | Ansell Healthcare | Aseptic barrier for procedural team. | |
| Non-sterile ultrasound gel | EcoGel | Coupling medium for baseline and follow-up imaging. | |
| Picture Archiving and Communication System (PACS) | GE Healthcare | Centricity PACS | Enterprise-grade image storage and retrieval system. |
| Povidone-Iodine 10% | Betadine | Pre-procedural antiseptic. | |
| Precision Workstation | Dell | T5820 | For image review and data analysis. |
| PrecisionGlide 22G–27G | BD (Becton Dickinson) | https://www.bd.com/en-us/products-and-solutions/products | Needle set for local anesthesia/hydrodissection. |
| Premixed Saline Bag 500 mL (0.9% NaCl) | Baxter Healthcare | Fluid for hydrodissection and flushing. | |
| R statistical computing software | R Foundation | RRID:SCR_001905 | Statistical analysis environment. |
| RFA percutaneous cooled electrode | STARmed Co., Ltd. | Star RF Electrode 18-10s10F | Active RFA electrode for thyroid ablation (TaeWoong Medical USA) |
| RStudio integrated development environment | Posit (formerly RStudio) | RRID:SCR_000432 | IDE for R statistical analyses. |
| Shear-wave elastography software module | Mindray | SWE Module (RESONA Series) | Quantitative stiffness mapping in kPa within the US system. |
| Sterile drape kit | Medline Industries | DYNJP2500 | Sterile preparation for thyroid RFA procedure |
| Sterile gauze and swabs | Covidien | Sterile Sponge Kit | Used for skin prep and hemostasis. |
| Sterile normal saline | Baxter Healthcare | 2B1324X | Hydrodissection during thyroid RFA |
| Sterile procedure drapes (Blue Drape Pack) | Medline Industries | Standard drape for sterile percutaneous RFA setup. | |
| Sterile ultrasound gel | Aquasonic 100 | Conductive Gel 100 mL | Sterile coupling medium for US guidance. |
| Sterile ultrasound probe cover | Parker Laboratories | Model 1001 | Sterile cover for intra-procedural imaging. |
| Strain elastography software module | Mindray | SE Module (RESONA Series) | Strain ratio calculation with integrated quality indicator. |
| Syringes (5/10/20 mL) | BD (Becton Dickinson) | Monoject Syringes | For anesthetic and hydrodissection delivery. |
| Three-way stopcock | BD (Becton Dickinson) | Model 305129 | Stopcock and tubing for controlled fluid management. |
| Thyroid RF Electrode | STARmed Co., Ltd. | https://en.starmed4u.com/ | Internally cooled RF electrode; Radiofrequency ablation of thyroid nodules |
| Ultrasound coupling gel | Parker Laboratories | Aquasonic 100 | Ultrasound and elastography acquisition |
| Ultrasound imaging system with elastography capability | SuperSonic Imagine | Aixplorer | Used for B-mode ultrasound, Doppler imaging, SWE, and strain elastography |
| VIVA Combo RF Generator | STARmed Co., Ltd. | RF generator for percutaneous thyroid ablation (TaeWoong Medical USA) | |
| VIVA RF Generator | STARmed Co., Ltd. | Ultrasound-guided thyroid radiofrequency ablation | |
| Xylocaine 1% 10 mL | AstraZeneca | Local anesthetic (lidocaine) for procedural analgesia. |