A series of triazole- and oxadiazole-based acetamide derivatives were synthesized and evaluated as urease and α-glucosidase inhibitors. Compound 8c showed the strongest urease inhibition, while 9e outperformed acarbose against α-glucosidase. BSA binding and in silico studies supported their drug-like properties, identifying both compounds as promising lead candidates.
A subscription to JoVE is required to view this content. Sign in or start your free trial.
Research Article
Synthesis, Biological Evaluation, and in Silico Studies of Novel Triazole- and Oxadiazole-Based Acetamides as Urease and α-Glucosidase Inhibitors
In This Article
Summary
Abstract
This study investigated the therapeutic potential of novel 1,2,4-triazole- and 1,3,4-oxadiazole-based acetamide derivatives as dual-target inhibitors of urease and α-glucosidase, two enzymes implicated in gastrointestinal disorders and type 2 diabetes, respectively. An integrated approach combining multistep organic synthesis, in vitro biological evaluation, molecular docking, in silico ADME prediction, and density functional theory (DFT) analysis was employed to identify potent lead compounds with favorable pharmacokinetic properties. Starting from benzoic acid, a series of 1,2,4-triazole derivatives (8a–c) and 1,3,4-oxadiazole derivatives (9d–f) bearing substituted acetamide moieties were successfully synthesized. All compounds exhibited inhibitory activity against both target enzymes. Compound 8c was the most potent urease inhibitor (IC₅₀ = 6.14 ± 1.06 µM), while compound 9e showed the strongest α-glucosidase inhibition (IC₅₀ = 27.29 ± 0.41 µM), surpassing the reference inhibitor acarbose (IC₅₀ = 38.25 ± 0.12 µM). Computational analyses supported the experimental findings: ADME predictions indicated favorable drug-like properties, and molecular docking demonstrated strong binding interactions, with compound 8a exhibiting the highest affinity for α-glucosidase (−7.165 kcal/mol) and compound 9e showing the strongest binding to urease (−7.30 kcal/mol). DFT calculations further correlated biological activity with electronic properties, revealing relatively small HOMO–LUMO energy gaps for the most active compounds, 8c (0.14831 a.u.) and 9e (0.14302 a.u.). Collectively, these findings identify compounds 8c and 9e as promising lead scaffolds for the development of next-generation inhibitors of urease and α-glucosidase.
Introduction
Heterocyclic moieties have been previously reported in many existing drugs, and heterocycles represent an important class of enzyme inhibitors used in the treatment of metabolic and infectious diseases1․ Among heterocycles‚ 1‚3‚4-oxadiazoles are one of the most studied scaffolds in drug discovery and have been reported as antiviral‚ antibacterial‚ anticancer‚ hypotensive‚ neuroprotectant‚ anticonvulsant and antitubercular agents2,3,4,5․ Similarly‚ 1‚2‚4-triazole derivatives have also shown anticonvulsant‚ antibacterial‚ antiviral‚ antitubercular‚ antidiabetic‚ anti-inflammatory‚ antiproliferative‚ antioxidant‚ antimalarial‚ and urease inhibitory activities6,7․ Acetamide-containing compounds possess a strong pharmacological profile and have been used as synthetic intermediates in heterocyclic chemistry as well as antidiabetic, anticoagulant, and chemosensitizing agents, making them attractive lead structures for drug discovery8,9․
Significant efforts have been directed toward the development of multitarget inhibitors of α-glucosidase and urease. α-Glucosidase inhibition delays carbohydrate digestion and glucose absorption, thereby lowering postprandial blood glucose levels in patients with type 2 diabetes mellitus. Current inhibitors such as acarbose are effective but are associated with gastrointestinal side effects‚ which creates a need for structurally diverse inhibitors10,11․ Urease breaks down urea into ammonia and carbon dioxide․ The reaction enables the bacterium Helicobacter pylori‚ which causes ulcers and makes the host more susceptible to gastric cancer‚ to survive in the stomach and therefore urease is an important target in anti-ulcer drug development․ A therapeutic goal is the development of new inhibitors for both enzymes9,12․
However‚ despite the available research studies on 1‚2‚4-triazole and 1‚3‚4-oxadiazole scaffolds‚ very few studies have been reported related to the acetamide derivatives of 1‚2‚4-triazole and 1‚3‚4-oxadiazole containing a thioether moiety as dual α-glucosidase and urease inhibitors13․ Their protein-binding behavior and computational characterization have also received limited attention in this context․ Herein, we proposed that merging the triazole or oxadiazole and substituted acetamide fragments into the same molecular framework would yield a satisfactory enzyme inhibitory profile with acceptable physicochemical properties․
To test this hypothesis, a series of 1,2,4-triazole-based acetamide derivatives (8a–c) and 1,3,4-oxadiazole-based acetamide derivatives (9d–f) were synthesized and evaluated for their inhibitory activity against α-glucosidase and urease. The binding interactions of the most active compounds (8a, 8c, and 9e) with bovine serum albumin (BSA) were investigated using fluorescence spectroscopy, binding constant determination, and thermodynamic analysis. In addition, molecular docking, ADME prediction, and density functional theory (DFT) calculations were performed to investigate their binding modes, pharmacokinetic properties, and electronic characteristics.
Access restricted. Please log in or start a trial to view this content.
Protocol
All reagents were of analytical grade and used without further purification. Reaction progress was monitored by thin-layer chromatography (TLC) on silica gel using n-hexane/ethyl acetate (7:3–6:4, v/v), with spots visualized under ultraviolet light. Unless otherwise stated, all reactions were performed under ambient atmosphere. The synthesized compounds were characterized by Fourier transform infrared (FTIR), 1H NMR, and 13C NMR spectroscopy. The 1H and 13C NMR spectra were recorded in CDCl₃ at 600 MHz and 150 MHz, respectively, and chemical shifts were reported in ppm relative to the residual solvent signal. The synthetic pathway is depicted in Figure 1. The complete physicochemical characterization data for all synthesized compounds are provided in Supplementary File 1.
Synthesis of ethyl benzoate (1)
Benzoic acid (50 g, 0.41 mol) was placed in a 500 mL round-bottom flask, and absolute ethanol (150 mL) was added. Concentrated sulfuric acid (6 mL) was added dropwise as a catalyst under continuous magnetic stirring. The reaction mixture was heated under reflux at 78 °C for 4–6 h using a water-cooled condenser. Reaction progress was monitored by TLC. Upon completion, the mixture was cooled to room temperature and neutralized with saturated aqueous sodium carbonate until the pH reached 7–8. The reaction mixture was transferred to a separatory funnel, and the organic layer was collected, washed with distilled water, and dried over anhydrous sodium sulfate. After filtration, ethyl benzoate (1) was used directly in the subsequent step without further purification (Figure 1).
Synthesis of benzohydrazide (2)
Ethyl benzoate (1; 0.41 mol) was dissolved in absolute ethanol (100 mL), and hydrazine hydrate (80%, 25 mL, excess) was added under continuous stirring. The reaction mixture was heated under reflux at 78 °C for 4–5 h under air using a water-cooled condenser. Reaction progress was monitored by TLC. Upon completion, the white crystalline precipitate of benzohydrazide (2) was collected by filtration, washed with cold ethanol, dried to constant weight at room temperature, and used in subsequent synthetic steps (Figure 1).
Synthesis of 5-phenyl-1,3,4-oxadiazole-2-thiol (3)
Benzohydrazide (2; 10 g, 0.073 mol) and potassium hydroxide (4.12 g, 0.073 mol) were placed in a 250 mL round-bottom flask containing ethanol (30 mL). The mixture was heated under reflux at 78 °C for 10 min using a water-cooled condenser. Carbon disulfide (CS₂; 5 mL, 0.083 mol) was then added, and reflux was continued for an additional 3–4 h. Reaction progress was monitored by TLC. Upon completion, the reaction mixture was transferred to distilled water and heated with continuous stirring. Dilute hydrochloric acid was added dropwise until the pH reached 5, resulting in precipitation of compound (3) (Figure 1). The precipitate was collected by filtration, washed thoroughly with cold distilled water, dried to constant weight, and weighed to determine the yield. The compound was characterized by FTIR, 1H NMR, and 13C NMR spectroscopy.
Synthesis of 4,5-diphenyl-4H-1,2,4-triazole-3-thiol (4)
Benzohydrazide (2; 5 g, 0.037 mol) and phenylisothiocyanate (4 mL, 0.037 mol) were placed in a 100 mL round-bottom flask fitted with a water-cooled condenser. The reaction mixture was heated under reflux at 78 °C until formation of the thiosemicarbazide intermediate was complete, as confirmed by TLC using n-hexane/ethyl acetate (7:3, v/v). Potassium hydroxide (2 g, 0.036 mol), dissolved in ethanol (20 mL), was then added, and reflux was continued until formation of compound (4), as confirmed by TLC. The reaction mixture was transferred to distilled water, heated with continuous stirring, and acidified with dilute hydrochloric acid to pH 5 to precipitate compound (4) (Figure 1). The precipitate was collected by filtration, washed thoroughly with cold distilled water, dried to constant weight, and characterized by FTIR, 1H NMR, and 13C NMR spectroscopy.
Synthesis of bromoacetamide intermediates 7(a–f)
Each substituted aniline derivative 5(a–f) (1 equiv.) was dissolved in chloroform and cooled in an ice bath to maintain the reaction temperature at 0–5 °C. Bromoacetyl bromide (6, ≥98%, 1 equiv.) was added dropwise with continuous stirring. During the reaction, 18% aqueous sodium carbonate solution was added as needed to maintain the reaction pH between 9 and 10 by neutralizing the hydrobromic acid generated. After the addition of bromoacetyl bromide was complete, the reaction mixture was allowed to warm to room temperature and stirred until TLC confirmed complete consumption of the starting material. The resulting bromoacetamide intermediates 7(a–f) were collected by filtration, washed with cold distilled water, dried to constant weight, and used directly in the subsequent synthetic step without further purification (Figure 1).
Synthesis of triazole-based acetamide derivatives 8(a–c)
Triazole derivative (4; 0.5 g, 0.002 mol) was dissolved in N, N-dimethylformamide (10 mL) in a 50 mL round-bottom flask. The appropriate bromoacetamide intermediate (7a, 7b, or 7c; 0.002 mol, 1 equiv.) was added with continuous stirring, followed by sodium hydride (0.05 g, 0.002 mol) to promote S-alkylation. The reaction mixture was stirred at room temperature for 24–48 h, with reaction progress monitored by TLC. Upon completion, the reaction mixture was poured into ice-cold water to induce precipitation. The precipitate was collected by filtration, washed thoroughly with cold water, dried, and characterized by FTIR, 1H NMR, and 13C NMR spectroscopy (Figure 1).
Synthesis of oxadiazole-based acetamide derivatives 9(d–f)
Oxadiazole derivative (3; 0.5 g, 0.002 mol) was dissolved in N, N-dimethylformamide (10 mL) in a 50 mL round-bottom flask. The corresponding bromoacetamide intermediate, 7d, 7e, or 7f (0.002 mol, 1 equiv.), was added, followed by sodium hydride (0.05 g, 0.002 mol) to facilitate S-alkylation. The reaction mixture was stirred at room temperature for 24–48 h, with progress monitored by TLC. Upon completion, the mixture was poured into ice-cold water to precipitate the product. The precipitate was collected by filtration, washed thoroughly with cold water, dried, and characterized by FTIR, 1H NMR, and 13C NMR spectroscopy (Figure 1).
α-Glucosidase inhibition assay
The α-glucosidase inhibitory activity was evaluated by mixing 50 µL of the test sample solution with 100 µL of α-glucosidase solution (0.35 U/mL) prepared in phosphate buffer (pH 6.8). The reaction mixture was incubated at 37 °C for 10 min, then 100 µL of 1.5 mM p-nitrophenyl-α-D-glucopyranoside was added as the substrate. After further incubation at 37 °C for 20 min, the reaction was terminated by adding 1 mL of 1 M sodium carbonate (Na₂CO₃). The absorbance was measured at 400 nm14. Acarbose was used as the positive control. The reaction mixture without the test compound served as the negative control, whereas the reaction mixture without the enzyme was used as the blank.
All experiments were performed in triplicate, and the results are expressed as the mean ± standard deviation (SD). The percentage inhibition of α-glucosidase activity was calculated using the following equation(1)14:
 (1)
(1)
where As represents the absorbance of the test sample solution, Ab is the absorbance of the reagent blank (without α-glucosidase), and A0 is the absorbance of the negative control (without the sample). The IC50 values were determined by testing compound concentrations ranging from 3.125 to 100 µM. Nonlinear regression analysis was performed using standard graphing software.
Urease inhibition assay
Urease inhibitory activity was determined using a modified Berthelot method. The reaction mixture consisted of 300 µL of the test sample solution, 200 µL of jack bean urease solution, and 200 µL of 25 mM urea. The mixture was incubated in a water bath at 37 °C for 30 min. After incubation, 500 µL of a color-developing solution containing 10 g/L phenol and 50 g/L sodium nitroprusside, followed by 500 µL of a second solution containing 5% (v/v) sodium hypochlorite and 5 g/L sodium hydroxide, was added. The reaction mixture was then incubated for an additional 15–30 min to allow color development.
The absorbance of the solution was measured at 625 nm against a reagent blank15. Thiourea was used as the positive control, the reaction mixture without the test compound as the negative control, and the mixture without the urease enzyme as the blank. All experiments were performed in triplicate (n = 3), and results are expressed as mean values ± standard deviation (S.D.). The percentage of inhibition was calculated using the following mathematical formula (2)15:
 (2)
(2)
where A0 is the absorbance of the control (without inhibitor) and As is the absorbance of the test sample (with inhibitor). Graphing and non-linear regression analysis to determine IC50 values were performed using standard data plotting software.
BSA binding assay
Binding interactions between bovine serum albumin (BSA) and the synthesized compounds were investigated using fluorescence quenching spectroscopy. A 10 µM BSA stock solution was prepared in 20 mM phosphate buffer (pH 7.4). For each titration experiment, 1.0 mL of the BSA solution was mixed with 2.0 mL of phosphate buffer in a quartz cuvette. The solution was titrated by successive additions of 5 µL aliquots of the test compound (1.5 mM in methanol). Fluorescence emission spectra were recorded over the wavelength range of 300–400 nm following excitation at 295 nm, with the maximum emission observed at approximately 336 nm. Fluorescence measurements were performed using a fluorescence spectrophotometer equipped with standard fluorescence acquisition software, with excitation and emission slit widths set to 10 nm and 2.5 nm, respectively. To determine the thermodynamic parameters of binding, including the Gibbs free energy (ΔG), enthalpy (ΔH), and entropy (ΔS), the titration experiments were repeated at 298, 308, and 313 K.
To investigate the fluorescence quenching mechanism, the experimental data were analyzed using the Stern–Volmer equation (Equation 3)16:
![Fluorescence quenching equation, Fo/F = 1 + Kqτ0[Q], KSV[Q], formula used in spectroscopy studies.](/files/ftp_upload/71216/71216eq3.jpg "figure-protocol-3") (3)
(3)
where F0 and F represent the fluorescence intensities of BSA in the absence and presence of the quencher, respectively; Kq is the bimolecular quenching rate constant; τ0 is the average lifetime of BSA in the absence of a quencher; KSV is the Stern-Volmer quenching constant; and [Q] is the concentration of the quencher. The binding constant (Kb) and the number of binding sites (n) were subsequently determined by plotting the double logarithm according to Equation (4)16:
![Equation for ligand binding analysis, featuring log(F₀-F/F) = log Kᵦ + n log[Q].](/files/ftp_upload/71216/71216eq4.jpg "figure-protocol-4") (4)
(4)
Furthermore, the standard Gibbs free energy change (ΔG°), standard enthalpy change (ΔH°), and standard entropy change (ΔS°) governing the binding interaction were calculated using the Van't Hoff and Gibbs-Helmholtz relationships expressed in Equations (5) and (6)17:
ΔG∘ = -RT ln Kb (5)
 (6)
(6)
where R is the universal gas constant and T is the absolute temperature in Kelvin.
Molecular docking
All molecular modeling and docking simulations were performed using the Schrödinger Suite (Maestro interface), with docking performed using the Glide module. The crystal structures of α-glucosidase (PDB ID: 5NN8) and urease (PDB ID: 4H9M) were retrieved from the RCSB Protein Data Bank. Protein structures were prepared using the Protein Preparation Wizard by removing co-crystallized ligands, water molecules, and nonessential heteroatoms, adding missing residues and loops, assigning correct bond orders, and adding polar hydrogen atoms. Protonation and tautomeric states were assigned at physiological pH (7.0 ± 2.0) using the Epik module. The prepared protein structures were subsequently subjected to restrained energy minimization with the OPLS force field to relieve steric clashes.
The two-dimensional structures of compounds 3, 4, 8(a–c), and 9(d–f), together with the reference inhibitors acarbose and thiourea, were prepared using the LigPrep module. Bond orders, stereochemistry, and ionization states at physiological pH were optimized, and the resulting three-dimensional ligand conformations were energy-minimized using the OPLS force field.
Receptor grids were generated using the Receptor Grid Generation tool, with the grid boxes centered on the cocrystallized native ligands to define the active sites. Grid box dimensions were set to 25 × 25 × 25 Å for both proteins. The urease grid was centered at x = −38.76, y = −44.14, and z = 66.88, whereas the α-glucosidase grid was centered at x = 21.14, y = −7.56, and z = 24.37.
Docking calculations were performed using the extra-precision (XP) mode of Glide with flexible ligand sampling. Multiple binding poses were generated for each ligand, and the pose with the lowest Glide docking score was selected for further analysis. The docking protocol was validated by redocking the cocrystallized ligands into their respective receptor grids. Root-mean-square deviation (RMSD) values of ≤2.0 Å confirmed the reliability and reproducibility of the docking protocol.
The binding conformations of the docked complexes were visualized using PyMOL (version 3.1)18. Protein–ligand interactions, including hydrogen bonds, hydrophobic contacts, and electrostatic interactions, were analyzed using Discovery Studio Visualizer19.
Density functional theory (DFT) analysis
All density functional theory (DFT) calculations were performed using Gaussian 09, and the optimized molecular geometries and frontier molecular orbitals were visualized using GaussView 5. The synthesized triazole- and oxadiazole-based acetamide derivatives, 8(a–c) and 9(d–f), were subjected to geometry optimization in the aqueous phase using the Becke three-parameter Lee–Yang–Parr (B3LYP) hybrid functional in conjunction with the 6-311+G(d,p) basis set20. Solvent effects were incorporated using the Conductor-like Polarizable Continuum Model (CPCM)21. Vibrational frequency calculations were subsequently performed at the same level of theory to confirm that all optimized structures corresponded to true local minima on the potential energy surface, as indicated by the absence of imaginary frequencies.
To understand the electronic transitions and kinetic stability of the synthesized compounds, the energies of the highest occupied molecular orbital (EHOMO) and the lowest unoccupied molecular orbital (ELUMO) were calculated. The frontier molecular orbital energy gap (ΔE = ELUMO - EHOMO) was determined for each derivative to assess its chemical reactivity and kinetic stability, with a smaller energy gap indicating higher reactivity.
Furthermore, global chemical reactivity descriptors—including chemical hardness (η), softness (S), chemical potential (μ), electronegativity (X), and the electrophilicity index (w)—were computed from the frontier orbital energies using the following standard operational equations22:
 (7)
(7)
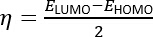 (8)
(8)
 (9)
(9)
 (10)
(10)
The computed electronic properties and global descriptors were systematically compared across the series to establish structure-activity relationships (SARs) that reflect their observed α-glucosidase and urease inhibitory profiles.
Additionally, molecular electrostatic potential (MESP) maps were generated and visualized using VESTA to map the charge distribution across the optimized molecular frameworks. The MESP surfaces allowed for the identification of electrophilic (electron-deficient, nucleophilic attack favored) and nucleophilic (electron-rich, electrophilic attack favored) regions. This electrostatic potential distribution was ultimately correlated with the specific non-covalent binding interactions, such as hydrogen bonding and electrostatic contacts, observed in the molecular docking simulations.
ADME analysis
To evaluate the drug-likeness and biopharmaceutical properties of the synthesized triazole- and oxadiazole-based acetamide derivatives 8(a–c) and 9(d–f), an in silico absorption, distribution, metabolism, and excretion (ADME) analysis was performed. The simplified molecular-input line-entry system (SMILES) representations of all synthesized compounds, together with the reference inhibitors acarbose and thiourea, were generated using a molecular modeling software package and submitted to the SwissADME web server23.
The calculated physicochemical parameters included molecular weight (MW), lipophilicity (logP), topological polar surface area (TPSA), the number of hydrogen bond donors (HBD), the number of hydrogen bond acceptors (HBA), and the number of rotatable bonds (RB).
Pharmacokinetic properties were evaluated by predicting gastrointestinal (GI) absorption and blood–brain barrier (BBB) permeability. In addition, the compounds were assessed for compliance with Lipinski's rule of five and other established drug-likeness criteria to estimate their oral bioavailability. Finally, the synthetic accessibility (SA) score was calculated for each compound on a scale ranging from 1 (easy to synthesize) to 10 (very difficult to synthesize). The predicted ADME and drug-likeness profiles of the synthesized compounds were compared with those of the reference inhibitors to evaluate their potential as lead candidates for drug development.
Access restricted. Please log in or start a trial to view this content.
Results
Chemistry and characterization of synthesized compounds
The target triazole- and oxadiazole-based acetamide derivatives were synthesized according to the synthetic pathway shown in Figure 1. The desired compounds were obtained in good to excellent yields (69%–87%) as white to yellow crystalline solids. Their purity was confirmed by TLC, melting point determination, and spectroscopic analyses. Representative NMR spectra confirming the characteristi...
Access restricted. Please log in or start a trial to view this content.
Discussion
This study synthesized a series of triazole- and oxadiazole-based acetamide derivatives and evaluated their structural, biological, computational, and pharmacokinetic properties. Spectroscopic characterization by HRMS, elemental analysis, 1H NMR, and 13C NMR confirmed the successful synthesis of the target molecules. The observed chemical shifts, coupling patterns, and carbon resonances were consistent with the proposed structures. Characteristic amide NH signals, methylene...
Access restricted. Please log in or start a trial to view this content.
Disclosures
The author declares there is no conflict of interest
Acknowledgements
The author extends his appreciation to the Faculty of Clinical Pharmacy, Al Baha University, Saudi Arabia.
Access restricted. Please log in or start a trial to view this content.
Materials
| Name | Company | Catalog Number | Comments |
|---|---|---|---|
| 1-Naphthylamine | Merck | 106148 | Aromatic amine used for preparation of substituted analogs |
| 2,5-Dimethylaniline | Sigma-Aldrich | D146706 | Aromatic amine used for synthesis of substituted derivatives |
| 3,4-Dimethylaniline | Alfa Aesar | A15416 | Aromatic amine used for preparation of structural analogs |
| Benzoic Acid | Sigma-Aldrich | 242381 | Starting material for synthesis of benzohydrazide intermediate |
| Bromoacetyl Bromide | Sigma-Aldrich | B17601 | Electrophilic reagent used in synthesis of bromoacetamide intermediates |
| Carbon Disulfide | Sigma-Aldrich | 289116 | Key reagent for cyclization to oxadiazole ring system |
| Chloroform | Sigma-Aldrich | C2432 | Solvent used in extraction and purification processes |
| Dimethylformamide (DMF) | Sigma-Aldrich | 227056 | Polar aprotic solvent used in derivatization and substitution reactions |
| Diphenylamine | Sigma-Aldrich | D23802 | Aromatic amine used in synthesis of derivative compounds |
| Epik (2022-1) | Schrödinger, LLC | N/A (software) | Used to generate ligand ionization states at pH 7.0; RRID: N/A |
| Ethanol | Sigma-Aldrich | E7023 | Reaction solvent for esterification and hydrazide formation |
| Ethyl Acetate | Sigma-Aldrich | 270989 | Polar mobile phase component in TLC analysis and extraction |
| Gaussian 09, Revision D.01 (Gaussian 09W) | Gaussian, Inc. | N/A (software) | Software used for DFT calculations (HOMO-LUMO, MESP, global reactivity descriptors); RRID:SCR_014897 |
| GaussView 5 | Gaussian, Inc., Wallingford, CT, USA | N/A (software) | Used for visualization of optimized structures and orbital energies; RRID: N/A |
| Glide (2022-1) | Schrödinger, LLC | N/A (software) | Docking software used for receptor grid generation and extra-precision (XP) molecular docking; RRID:SCR_000187 |
| GraphPad Prism, version 9 | GraphPad Software, Boston, MA, USA | N/A (software) | Used for IC50 regression analysis and statistical evaluation of enzyme inhibition data; RRID:SCR_002798 |
| Hydrazine | Sigma-Aldrich | 225819 | Reagent used for conversion of ester to benzohydrazide |
| L(+)-Glutamine | Sigma-Aldrich | G3126 | Reagent used in biological evaluation studies |
| LigPrep (2022-1) | Schrödinger, LLC | N/A (software) | Used for ligand structure optimization and 3D conformer generation; RRID:SCR_016746 |
| Lithium Hydride | Sigma-Aldrich | 201049 | Catalyst used for activation of thiol group in substitution reactions |
| Maestro (v13.2, Schrödinger Release 2022-1) | Schrödinger, LLC | N/A (software) | Molecular modeling suite used for protein/ligand structure preparation and visualization; RRID:SCR_016748 |
| Methanol | Sigma-Aldrich | 34860 | Solvent used in purification and biological assay preparations |
| n-Hexane | Merck | 104391 | Non-polar mobile phase component in TLC analysis |
| OPLS-2005 / OPLS-AA | Schrödinger, LLC | N/A (force field) | Force field used for energy minimization of protein and ligand structures; RRID: N/A |
| Phenyl Isothiocyanate | Merck | 807028 | Reagent used in synthesis of triazole derivatives |
| Protein Preparation Wizard (2022-1) | Schrödinger, LLC | N/A (software) | Used for receptor structure refinement prior to docking; RRID:SCR_016749 |
| Sodium Hydroxide | Sigma-Aldrich | 221465 | Base used for pH adjustment and reaction neutralization |
| Sulfuric Acid | BDH | 10276 | Acid catalyst used in esterification step under reflux conditions |
| Trimethylamine | Riedel-de Haen | 22129 | Organic base used during synthesis of substituted derivatives |
| VESTA, version 3.5.8 | Momma & Izumi (developers); freely distributed | N/A (software) | Used for visualization of molecular electrostatic potential (MESP) and HOMO-LUMO surface maps; RRID: N/A |
References
- Siddiqui SZ, et al. BSA binding, molecular docking, and in vitro biological screening of new 1,2,4-triazole heterocycles bearing an azinane nucleus. Pak J Pharm Sci. 2020;33(1):149-160.
- Khalilullah H, Ahsan MJ, Hedaitullah M, Khan S, et al. 1,3,4-Oxadiazole: A biologically active scaffold. Mini Rev Med Chem. 2012;12(8):789-801.
- Wang JJ, Sun W, Jia WD, Bian M, et al. Research progress on the synthesis and pharmacology of 1,3,4-oxadiazole and 1,2,4-oxadiazole derivatives: A mini review. J Enzyme Inhib Med Chem. 2022;37(1):2304-2319.
- Glomb T, Świątek P. Antimicrobial activity of 1,3,4-oxadiazole derivatives. Int J Mol Sci. 2021;22(13):6979.
- Glomb T, Szymankiewicz K, Świątek P. Anti-cancer activity of derivatives of 1,3,4-oxadiazole. Molecules. 2018;23(12):3361.
- Aggarwal R, Sumran G. An insight into the medicinal attributes of 1,2,4-triazoles. Eur J Med Chem. 2020;205:112652.
- Strzelecka M, Świątek P. 1,2,4-Triazoles as important antibacterial agents. Pharmaceuticals (Basel). 2021;14(3):224.
- Kumar S, Khokra SL, Yadav A. Triazole analogues as potential pharmacological agents: A brief review. Future J Pharm Sci. 2021;7(1):106.
- Raza A, et al. Deep learning in drug discovery: A futuristic modality to materialize large datasets for cheminformatics. J Biomol Struct Dyn. 2023;41(18):9177-9192.
- Liu SK, et al. Discovery of new α-glucosidase inhibitors: Structure-based virtual screening and biological evaluation. Front Chem. 2021;9:639279.
- Lebovitz HE. Alpha-glucosidase inhibitors. Endocrinol Metab Clin North Am. 1997;26(3):539-551.
- Rego YF, et al. A review on the development of urease inhibitors as antimicrobial agents against pathogenic bacteria. J Adv Res. 2018;13:69-100.
- Daud S, et al. Design, synthesis, in vitro evaluation, and docking studies of ibuprofen-derived 1,3,4-oxadiazole derivatives as dual α-glucosidase and urease inhibitors. Med Chem Res. 2022;31(2):316-336.
- Chapdelaine P, Tremblay RR, Dubé JY. p-Nitrophenyl-α-D-glucopyranoside as a substrate for measurement of maltase activity in human semen. Clin Chem. 1978;24(2):208-211.
- Manoharan A, et al. N-Acetylcysteine prevents catheter occlusion and inflammation in catheter-associated urinary tract infections by suppressing urease activity. Front Cell Infect Microbiol. 2023;13:1216798.
- Lakowicz JR. Principles of Fluorescence Spectroscopy. 3rd ed. Springer; New York, NY; 2006.
- Atkins P, de Paula J, Keeler J. Atkins' Physical Chemistry. 11th ed. Oxford University Press; Oxford, UK; 2018.
- DeLano WL. PyMOL: An open-source molecular graphics tool. CCP4 Newsl Protein Crystallogr. 2002;40:82-92.
- Discovery Studio Visualizer, Version 2.0. Accelrys Software Inc.; San Diego, CA; 2005.
- Tirado-Rives J, Jorgensen WL. Performance of B3LYP density functional methods for a large set of organic molecules. J Chem Theory Comput. 2008;4(2):297-306.
- Takano Y, Houk KN. Benchmarking the conductor-like polarizable continuum model (CPCM) for aqueous solvation free energies of neutral and ionic organic molecules. J Chem Theory Comput. 2005;1(1):70-77.
- Parr RG, Szentpály LV, Liu S. Electrophilicity index. J Am Chem Soc. 1999;121(9):1922-1924.
- Daina A, Michielin O, Zoete V. SwissADME: A free web tool to evaluate pharmacokinetics, drug-likeness, and medicinal chemistry friendliness of small molecules. Sci Rep. 2017;7(1):42717.
- Wang YN, et al. Synthesis and biological evaluation of triazolones/oxadiazolones as novel urease inhibitors. Bioorg Med Chem. 2024;102:117656.
- Mehdi K, et al. Molecular docking and in vitro studies of synthesized oxadiazole derivatives as urease inhibitors. J Math Fundam Sci. 2025;57(1):1-23.
- Aziz M, et al. Phytochemical, pharmacological, and in silico molecular docking studies of Strobilanthes glutinosus Nees: An unexplored source of bioactive compounds. S Afr J Bot. 2022;147:618-627.
- Khan KM, et al. Biochemical, toxicological, and in silico aspects of Trillium govanianum Wall. ex D. Don (Trilliaceae): A rich source of natural bioactive compounds. Chem Biodivers. 2024;21(1):e202301375.
- Bibi H, et al. Isolation and characterization of bioactive constituents from Withania coagulans Dunal with antioxidant and multifunctional enzyme inhibition potential, supported by docking, molecular dynamics, and DFT studies. RSC Adv. 2025;15(56):48566-48584.
- Khurm M, Guo Y, Wu Q, Zhang X, et al. Conocarpus lancifolius (Combretaceae): Pharmacological effects, LC-ESI-MS/MS profiling and in silico. attributes. Metabolites. 2023;13(7):794.
- Abdo MA, Badawy SA, Fadda AA, Elmorsy MR. Design, synthesis, structural characterization, and antioxidant potential of novel triazole- and oxadiazole-based hydrazide-hydrazone derivatives: spectroscopic, DFT, and molecular docking studies. BMC Chem. 2025;19:192.
Access restricted. Please log in or start a trial to view this content.