This protocol describes a multicenter flow cytometry workflow for acute myeloid leukemia measurable residual disease quantification using leukemia-associated immunophenotype/different-from-normal (LAIP/DfN) analysis and phenotypically defined CD34+CD38− leukemic stem cell-enriched populations.
Method Article
Multicenter Flow Cytometry For Acute Myeloid Leukemia Measurable Residual Disease With LAIP/DfN And CD34+CD38- Leukemic Stem Cell-Enriched Populations
* These authors contributed equally
In This Article
Summary
Abstract
Measurable residual disease (MRD) follow-up is recommended for treatment response evaluation in acute myeloid leukemia (AML) clinical trials according to ELN 2025 guidelines. The aim of this study was to implement a standardized follow-up of patients using a harmonized MRD flow approach across 30 French hematology laboratories participating in AML clinical trials. To obtain comparable results, the network established recommendations from wet-lab procedures to clinical reports. We designed a 3-tube panel with mandatory 8-color common markers per tube, according to ELN recommendations, to identify leukemia-associated immunophenotype/different-from-normal (LAIP/DfN) patterns in bulk cells and leukemic stem cell (LSC)-enriched populations in the CD34+CD38− fraction. A backbone of CD34/CD38/CD45/CD117 was used, completed by lineage markers for the first tube, LSC-associated markers for the second tube, and monocytic and differentiation markers for the third tube. This panel can be used in 8-, 10-, and 12-color formats and implemented on multiple conventional flow cytometer platforms. We propose flow cytometer settings adapted to each platform.
Harmonization of sensitivity between the four platforms was performed using 8-peak rainbow beads. Immunostaining was performed after bulk lysis. To detect bias between platforms, the staining index was tested using fresh healthy bone marrow samples in parallel on the four platforms. Regular bone marrow quality-control samples were shared among laboratories for wet external quality assessment (EQA) to verify all steps of the protocol. Finally, standardization of the data analysis strategy obtained in the centers was evaluated using dry EQA by sharing MRD FCS data files. The feasibility of this multicenter approach requires harmonization of instrument sensitivity and sample preparation, as well as training and systematic education of analytical operators.
Introduction
Measurable residual disease (MRD) refers to the small number of leukemic cells that persist during or after treatment and are undetectable by morphology, particularly in cases of complete remission with less than 5% blasts in the bone marrow. MRD monitoring is recommended for treatment response evaluation in clinical acute myeloid leukemia (AML) trials according to ELN 2025 guidelines1. Besides molecular biology methods, including reverse transcriptase PCR (RT-qPCR) and next-generation sequencing (NGS), multiparametric flow cytometry (MFC) is a commonly used approach2.
To obtain consistent MRD results, particularly in clinical trials, two strategies are possible: centralizing MRD measurement in a single laboratory or implementing a protocol that ensures reproducibility between the different laboratories involved in MRD determination. The number of samples, the size of the trial, and the capacity of laboratories to process larger or smaller sample volumes can determine the choice between these strategies. If a multicenter strategy is chosen, differences between cytometer platforms and the need for comparable analysis across sites must be addressed.
For this purpose, we describe a standardized multicenter and multiplatform MRD flow approach combining leukemia-associated immunophenotype/different-from-normal (LAIP/DfN) analysis and phenotypically defined CD34+CD38− leukemic stem cell (LSC)-enriched detection, implemented across 30 French hematology laboratories based on ELN recommendations and previous reports3,4.
Flow cytometry allows the definition, at diagnosis, of the leukemia “signature” that incorporates the specific expression of markers on the patient's blasts: LAIP. After treatment, MRD flow allows monitoring of the LAIPs identified at diagnosis. Since leukemic blasts can evolve and modify their immunophenotype under therapeutic pressure, a second strategy must be systematically implemented: the DfN approach, which relies on identifying cells with characteristics that differentiate them from normal hematopoiesis. This technique can also detect the appearance of new markers on blasts during the course of the disease and its treatment.
In the French AML flow group, the panel design was based on the previously published HOVON study of leukemic-cell pattern definition. There is no universal LSC or LAIP marker, so we designed a 3-tube panel allowing simultaneous identification of LAIP, DfN, and CD34+CD38− LSC-enriched populations. A backbone based on CD34/CD38/CD45/CD117 was used in all tubes, completed by lineage markers in the first tube, LSC-associated markers in the second tube, and monocytic lineage or differentiation markers in the third tube to complete LAIP definition in AML with monocytic blasts. All three tubes are acquired at diagnosis and in follow-up samples.
Given the pathophysiology of leukemogenesis, attention has shifted from studying the blast bulk to identifying the most immature fraction as leukemic stem cell-enriched populations. Dick and colleagues demonstrated the heterogeneity of leukemia by describing CD34+CD38− LSCs with the potential to generate leukemia in immunodeficient mice5,6. In LSC quantification at diagnosis and follow-up, efforts are being made to standardize antibody panels and analysis strategies within the ELN DAVID working group1,7. Currently, two panels, HOVON and ALFA, use dichotomic LSC markers to distinguish LSC-enriched populations from normal hematopoietic stem cells in the CD34+CD38− space8,9.
The method described here combines standardized sample preparation, common antibody-panel design, platform-adapted sensitivity settings, LAIP/DfN and CD34+CD38− LSC-enriched analysis, external quality assessment, and harmonized clinical reporting for multicenter AML MRD flow monitoring.
Protocol
The protocol follows the recommendations and guidelines of the ethics committees of the French University Hospital Centers. All patients signed informed consent according to French legislation. The study protocol was approved by the Human Ethics Committee of CHU Lyon and the Ethics Committee of the Institutional Review Board of Lille CHU in accordance with the Declaration of Helsinki (HDF-AML observatory, CNIL 2214454v0). For allograft, donors were included in the European internet-based ProMISE database and provided informed consent for collection of their personal data. Extraction and analysis of data were performed in accordance with the local Ethics Committee (CNIL2093819). All FCS flow files used for network review were fully anonymized using a Python script.
1. Cytometer setting
- Determine target values adapted to each cytometer using 8-peak rainbow beads.
- Set each machine according to the target values shown in Table 1. Ensure that each channel reaches the target value ± 5%. Verify this setting systematically to maintain the longitudinal sensitivity of each platform.
- Establish the compensation matrix using single-stained tubes for each antibody, using compensation beads and/or cells according to each platform.
- Save the setting and compensation matrix as an assay or protocol identified as MRD LAIP/DfN, LSC, and MonoGran (T1, T2, T3). Use this assay or protocol for acquisition for AML MRD flow quantification.
2. Wet-lab procedure
- Bone marrow aspirate
- Collect 1-2 mL of EDTA bone marrow at diagnosis and at the monitoring time points, including MRD1, MRD2, MRD3, MRD4, and relapse.
- Send the tubes to the reference flow laboratory within 24-48 h.
- Bone marrow smear preparation for morphologic examination
- Place a drop of bone marrow aspirate onto a glass slide. Gently spread the sample using a coverslip or another slide.
- After 30 min of drying, stain the smear with May-Grünwald-Giemsa (Supplemental File 1).
- Bulk lysis
- Add 15 mL of NH4Cl lysing solution to 1-2 mL of bone marrow sample. Mix gently and incubate for 10 min at room temperature.
- Centrifuge at 450 × g at room temperature for 5 min and discard the supernatant.
- Resuspend the cell pellet in 10 mL of PBS/0.1% BSA. Centrifuge at 450 × g at room temperature for 5 min and discard the supernatant.
- Resuspend the cell pellet at a concentration of 30 × 106 WBC/mL in PBS.
- Immunostaining of the cell suspension
- Distribute the monoclonal antibodies in tubes T1, T2, and T3 according to the platform (Table 2). Provide the clone, volume, catalog reference, and supplier for each antibody in an antibody table.
NOTE: For each tube using brilliant violet dyes, use brilliant stain buffer before adding the antibodies. - Add 2-3 ×10⁶ lysed cells per tube in 100 µL of cell suspension. Incubate the cells with antibodies for 15 min in the dark at room temperature.
- Wash the cells with 3 mL of PBS. Centrifuge for 5 min at 450 × g and discard the supernatant.
- Resuspend the stained cells in 300 µL of PBS.
NOTE: Premixed antibody cocktails or validated dry antibody tubes may be used.
- Distribute the monoclonal antibodies in tubes T1, T2, and T3 according to the platform (Table 2). Provide the clone, volume, catalog reference, and supplier for each antibody in an antibody table.
3. Flow cytometer acquisition
- Open the MRD assay or acquisition protocol with the adapted setting and compensation matrix for MRD LAIP/DfN and LSC measurement.
- Acquire a minimum of 500,000 to 1,000,000 WBC in each tube at diagnosis and in MRD follow-up samples to improve clustering of MRD cells and confidence in low-level MRD.
NOTE: For LSC measurement, acquire a minimum of 1,000,000 WBC in Tube 2 to obtain adequate sensitivity for LSC quantification (LOQ 0.002% and LOD 0.001%)10,11. - Save the FCS data files from diagnosis and MRD samples. Record the acquisition date and patient identification to facilitate follow-up MRD and LSC analysis.
4. Strategy of analysis
- Use a common template and a common dot-plot sequence incorporating a predefined harmonized gating strategy adapted to the analysis software used at each center.
- Apply the gating strategy to identify leukemic cells using three approaches: LAIP, DfN, and LSC analysis in the CD34+CD38- fraction.
- Identify and exclude potential nonspecific events and normal physiological populations, including basophils, plasmacytoid dendritic cells, hematogones, plasma cells, erythroblasts, platelet clumps, debris, and unlysed erythrocytes.
5. Definition of LAIP/DfN and physiological populations
- To capture LAIP in bulk blasts, draw a single-cell gate based on FSC-W versus FSC-H.
- Draw a live-cell gate based on FSC versus SSC.
- Draw a blast gate on CD45dim/SSC.
- Draw the primitive marker gate using CD34/CD117.
- Use fixed biparametric dot plots to draw the relevant LAIP gates, including LAIP1, LAIP2, LAIP3, LAIP4, LAIP5, LAIP6, LAIP7, and LAIP8.
- Physiological populations
- Gate hematogones using the following sequence: live cells, MNC on the FSC/SSC dot plot, CD19/SSC dot plot, and CD34/CD38 dot plot. Back-gate using CD45/SSC.
- Gate basophils using the following sequence: live cells, MNC on the FSC/SSC dot plot, CD123/CD45RA (CD123++CD45RA-), excluding CD19+ hematogones. Back-gate using CD45/SSC.
- Gate plasmacytoid dendritic cells using the following sequence: live cells, MNC on the FSC/SSC dot plot, CD123/CD45RA (CD123++CD45RA+), excluding CD19+ hematogones. Back-gate using CD45/SSC.
- Identify erythroblasts, platelet clumps, debris, and unlysed erythrocytes using the CD36/CD45 dot plot. Back-gate using CD45/SSC and FSC/SSC.
- LAIP approach
- Define MRD in CD34+ OR CD117+ primitive AML using Boolean operators as follows: LAIP1 AND LAIP2 AND LAIP3 AND LAIP4 AND LAIP5 AND LAIP6 AND LAIP7 AND LAIP8 AND NOT clean CD36bright+/CD45 AND single cells AND live cells AND CD34+/CD117+/ primitive markers AND (CD45/SSC blast gate OR MNC CD34+) (Figure 1).
- Define MRD in CD34-CD117- AML using Boolean operators as follows: LAIP1 AND LAIP2 AND LAIP3 AND LAIP4 AND LAIP5 AND LAIP6 AND LAIP7 AND LAIP8 AND NOT clean CD36bright+/CD45 AND single cells AND live cells AND CD34CD117 AND CD45/SSC blast gate (Figure 2).
- DfN approach
- Use the same template as the LAIP approach and apply the empty space defined on reference bone marrow samples (Table 3).
- Define abnormal populations when the cluster of abnormal cells is separated from normal cells by 0.5 decade on the log scale12.
- To capture DfN in bulk blasts, draw live cells using FSC/SSC.
- Draw single cells by removing doublets based on FSC peak/SSC area.
- Draw the MNC gate using FSC/SSC.
- Apply a cleanup gate to remove lymphocytes using CD45/CD36/SSC.
- Apply a cleanup gate to remove erythroblasts and debris using CD45/CD36.
- Use two input gates, CD34+/CD45/SSC and CD117+/CD45/SSC, to define the empty boxes according to previous publications12,13.
- Draw each DfN empty box based on internal control populations, including lymphocytes for cross-lineage markers and normal myeloid precursors for loss, decrease, or overexpression markers.
- Compare the empty boxes with reference bone marrow samples, including regenerating, inflammatory, and healthy donor bone marrow.
6. Definition of the LSC CD34+CD38- population
- Identify LSC-enriched cells at diagnosis in the CD34+CD38- space based on LSC markers with dichotomic expression and absence of expression in normal hematopoietic stem cells from healthy bone marrow.
- Define the LSC input gate as MNC34+ using the following gating sequence: live cells, single cells, MNC, and CD34+ in the CD45/CD34 dot plot.
- Define the CD34+CD38- fraction (P6) using a rigorous threshold based on the CD38 fluorescence-minus-one (FMO) level.
- Define LSC-enriched cells in Tube 1 in the P6 fraction using Boolean operators as follows: P6CD7+ OR P6CD33+ OR P6CD19+ OR P6CD56+ AND NOT clean CD36bright+ AND single cells AND live cells AND MNC AND MNC CD34+.
- Define LSC-enriched cells in Tube 2 in the P6 fraction using Boolean operators as follows: P6CD45RA+ OR P6MIX+ OR P6CD123+ AND NOT clean CD36bright+ AND single cells AND live cells AND MNC AND MNC CD34+.
- Use CD36 to clean up nonspecific events in the final MRD LSC gate (Figure 3).
7. Definition of the CD38- threshold in the CD34+ population
- Set the CD38 channel high enough to distinguish CD38- populations from CD38+/ populations with good resolution.
- Define P6 as CD34+CD38-, P7 as CD34+CD38low, and P8 as CD34+CD38high.
- Base the CD38 channel setting on CD38-bright populations, identifying plasma cells as the brightest population and hematogones according to the measurement range of each platform.
- Define the CD34+CD38- population (P6) using the CD38 FMO approach validated by an isoclonic CD38 control.
- Define the CD34+CD38low population (P7) using the hematogone negative level.
- Define the CD34+CD38high population (P8) using the hematogone positivity level and plasma-cell negative level (Figure 4).
- Use the same CD38- threshold level across the harmonized group using robust methods such as CD38- FMO or isoclonic CD38 control.
- Use at least one aberrant immunophenotype in the CD34+CD38- fraction to define LSC-enriched cells. Include LSC markers such as CLL1/TIM3/CD97/CD45RA/CD123 or lineage markers such as CD7/CD19/CD56/CD33.
- Apply the following thresholds: assay sensitivity LOQ 10-4 and LOD 10-5; LSC positivity at diagnosis ≥ 1% of CD45/SSC blasts; and LSC positivity in MRD follow-up ≥ 0.01% of WBC.
8. Harmonized clinical flow report
- Provide the following information with each result: bone marrow quality, strategy used for MRD identification, LAIP description, LOD and LOQ, thresholds, and interpretation of results.
- Hemodilution and bone marrow representativeness
- Assess hemodilution for each MRD flow clinical report to evaluate the robustness of the result.
- Use one of the previously described hemodilution methods when applicable (Table 4)7,14,15,16,17,18,19,20,21.
- As a complementary approach, calculate bone marrow representativeness using the observed CD34/WBC45 ratio compared with the expected ratio observed in reference bone marrow samples (Figure 5).
- Use the following formula:
P: purity % = 100 × (n/L - s) / (m - s)
s: proportion of MNC CD34+ cells in normal peripheral blood: 0.0005
m: proportion of MNC CD34+ cells in normal bone marrow: 0.035
L: number of WBC45+ leukocytes in the MRD patient sample
n: number of MNC CD34+ cells in the MRD patient sample - Report bone marrow representativeness as a quality evaluation of the sample. Do not use this value to normalize MRD results.
- Interpret bone marrow representativeness as follows: 100% to 10%, low influence on the proportion of CD34+ cells from bone marrow; 10% to 1%, warning for interpretation of MRD results; and < 1%, non-interpretable result.
- LSC quantification at diagnosis
- Report the profile used to identify LSC-enriched cells, for example, CD34+CD38-CD90-CD45RA+MIX+(CLL1/TIM3/CD97)CD7+CD56+.
- Report LSC results at diagnosis as the observed percentage from CD45/SSC blasts.
- Use LSC ≥ 1% of total blasts as the threshold for poor prognosis.
- Follow-up MRD by LAIP/DfN
- Report the LAIP profile used to identify MRD, for example, CD34+CD38dim+CD13+/-CD33++CD117+CD7+.
- Report the sensitivity of the analysis as the least sensitive value between the technical threshold and the robustness value observed for the LAIP profile compared with reference bone marrow samples.
- Use a minimum cluster of 50 cells among acquired WBC events as the limit of quantification. For example, with 500,000 WBC cells, LOQ is 0.01% (1 × 10⁻⁴).
- Report LAIP/DfN results as positive, negative, detectable but under the clinical threshold, or not detectable.
- Report LAIP/DfN positivity as ≥ 0.1%, expressed as the percentage of total CD45+ leukocytes.
- Report LAIP/DfN negativity as < 0.1%.
- For detectable but under-threshold results, report the representative value and sensitivity threshold.
- For non-detectable results, report that the result is inferior to the analysis sensitivity threshold and add a comment if needed, such as hemodilution, low LAIP specificity, or insufficient technical threshold.
- Follow-up MRD by LSC
- Report the profile used to identify LSC-enriched cells, for example, CD34+CD38-CD90-CD45RA+MIX+(CLL1/TIM3/CD97)CD7+CD56+.
- Use a minimum cluster of 20 cells among acquired WBC events as the limit of quantification. For example, with 1,000,000 WBC cells, LOQ is 0.002% (2 × 10⁻⁵).
- Report LSC results as positive, negative, detectable but under the clinical threshold, or not detectable.
- Report LSC positivity as ≥ 0.01%, expressed as the percentage of total CD45+ leukocytes.
- Report LSC negativity as < 0.01%.
- For detectable but under-threshold results, report the representative value and sensitivity threshold.
- For non-detectable results, report that the result is inferior to the analysis sensitivity threshold and add a comment if needed, such as hemodilution, low LSC specificity, or insufficient technical threshold.
- Integrate the MRD flow interpretation with previous monitoring time points. Indicate modulation of the phenotypic profile during treatment and the dynamics of MRD flow, including re-positivity, increase, stability, or decrease.
- Forward the results to the requesting clinician and investigator using the clinical flow report according to the timeframe of the reference flow laboratory.
- Summarize the harmonized clinical flow report using the following items: bone marrow quality, MRD identification strategy, LAIP description, LOD and LOQ, thresholds, and interpretation as MRD positive, MRD negative with LOD value, or MRD detectable but non-quantifiable.
Results
Platform mirroring
For the initial two-platform comparison between CANTO and NAVIOS, voltage settings were adjusted by acquiring uncompensated 8-peak rainbow beads to reach predefined target MFI values. Target values from the reference CANTO platform were transposed to the second NAVIOS platform using the following conversion: new MFI target = reference MFI target/25622. To detect bias between platforms, 10 fresh EDTA regenerative bone marrow samples were tested in parallel. The staining index between positive and negative populations was compared between samples and platforms and showed comparable separation (Supplemental File-Figure S3).
During the study, the platforms were progressively upgraded from 8- and 10-color configurations to LYRIC and DxFLEX 12- and 13-color configurations (Supplemental File 1). Mirroring was extended across four platforms using 8-peak rainbow beads and stained healthy bone marrow acquired with the same panel. Peak overlap was checked by adjusting only the logarithmic scales of representation. After applying the defined settings, the cell staining patterns overlapped, with the main difference being translation of the cell clouds along the logarithmic scales (Figure 6 and Supplemental File-Figure S4 and Figure S5).
Quality assessment and reproducibility across flow laboratories
After implementation of the initial standard operating procedure and its updates during platform upgrades, wet external quality assessment (EQA) was performed regularly using fresh reference bone marrow samples shared among participating centers. Wet EQA was used to verify the wet-lab procedure, platform settings, and common gating analysis strategy. The reported populations included MNC CD34+ cells in the WBC CD45+ denominator and P6 CD34+CD38− cells in the WBC CD45+ denominator. Results were analyzed by z-score and/or graphical representation (Figure 7).
Five wet EQA rounds were performed since 2017, with 22, 15, 17, 26, and 25 participating laboratories, respectively. For %CD34+CD38− cells in WBC CD45+ and %MNC CD34+ cells in WBC CD45+, the results were as follows: EQA1, mean values 0.015% and 1.01% (SD 0.09% and 0.24%); EQA2, 0.09% and 1.02% (SD 0.046% and 0.36%); EQA3, 0.097% and 1.46% (SD 0.024% and 0.32%); EQA4, 0.024% and 2.16% (SD 0.015% and 0.59%); and EQA5, 0.027% and 1.9% (SD 0.008% and 0.45%).
To address standardization of the MRD analysis strategy across centers, wet EQA was complemented by dry EQA using shared FCS files for diagnosis, MRD follow-up, and reference bone marrow. More than 90% of locally analyzed data were included within the centralized interval based on the series mean ± 2 SD: 95.6% and 91.3% for DryEQA2017, with 22 of 23 participating laboratories, and 100% for DryEQA2024, with 24 of 25 participating laboratories (Figure 8). Two rounds of dry EQA were performed for %MRD LAIP in WBC CD45+ and %MRD LSC CD34+CD38− in WBC CD45+. DryEQA2017 showed a mean LAIP value of 11.9% (SD 1.35%) and a mean LSC value of 0.16% (SD 0.05%). DryEQA2024 showed a mean MRD LAIP value of 0.35% (SD 0.26%) and a mean MRD LSC CD34+CD38− value of 0.18% (SD 0.06%).
Example of multimodal AML MRD flow measurement using LAIP/DfN and LSC strategies
To quantify MRD, three approaches were systematically used. The first approach established the LAIP cartography of leukemic blasts at diagnosis using Boolean gating, and this cartography was applied to follow-up bone marrow samples (Figure 9A). The second approach used DfN analysis to identify abnormal cells with atypical expression patterns not observed in “empty box” areas defined from normal myeloid differentiation (Figure 9B). The third approach quantified LSC-enriched cells in the CD34+CD38− fraction using dichotomic LSC markers and Boolean gating (Figure 10).
Reference bone marrow samples
A total of 135 reference bone marrow samples was studied, including 25 healthy donor bone marrow samples, 34 inflammatory bone marrow samples, and 76 regenerating bone marrow samples. Healthy donor bone marrow was obtained from healthy donors, with a median age of 31 years and a range of 21–49 years. Inflammatory bone marrow was obtained from patients referred for cytopenia, including anemia, neutropenia, or thrombopenia, with bone marrow aspirates showing no hematological malignancy; the median age was 52 years, with a range of 25–82 years. Regenerating bone marrow was obtained during AML follow-up at different chemotherapy time points, including after induction or consolidation, with negativity of molecular MRD assessment for NPM1 or CBF transcripts; the median age was 54 years, with a range of 18–65 years.
The quality of these samples was validated by microscopic examination. The expected theoretical percentage of CD34+ cells in undiluted bone marrow samples was also calculated using the Brooimans formula, with results >90% for all samples. These samples were used to establish thresholds for LAIP/DfN and LSC analysis and to calculate the hemodilution and purity formula. Marker-expression MFI variation according to bone marrow status was studied for healthy donor, inflammatory, and regenerating bone marrow samples (Supplemental File-Figure S6). Reference values were determined for the most relevant parameters, including %MNC CD34+ from WBC, %P6 CD34+CD38− in MNC CD34+, %P7 CD34+CD38dim in MNC CD34+, and %P8 CD34+CD38high in MNC CD34+ (Supplemental File-Figure S6).
Assessment of sensitivity and linearity
Sensitivity was assessed for LAIP/DfN and LSC-specific gates by measuring the number of abnormal events in a set of reference bone marrow samples, including regenerating, inflammatory, and healthy donor bone marrow. Serial dilution of a known number of blasts in healthy bone marrow was used to verify the limit of quantification and linearity of MRD measurement (Figure 11 and Figure 12).
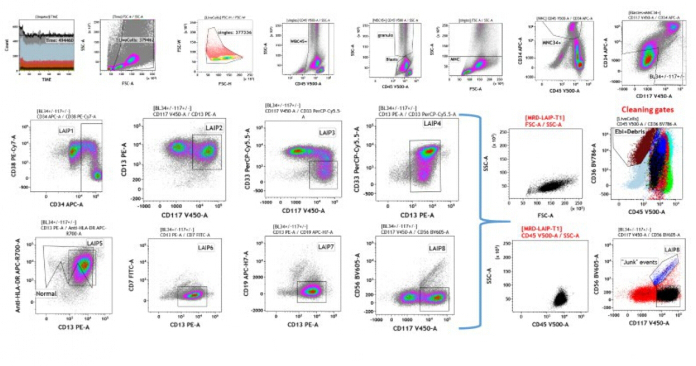
Figure 1: Gating strategy for MRD LAIP analysis in AML using primitive markers (CD34+/CD117+) in Tube 1. First row: sequential gating of time, live cells based on FSC versus SSC, single cells based on FSC-W versus FSC-H, WBC CD45+ cells on CD45 versus SSC, blasts on CD45dim/SSC, mononuclear cells (MNC) on FSC-A/SSC-A, MNC CD34+ cells on the CD45 versus CD34 plot, and the primitive marker gate on the CD34 versus CD117 plot. Second and third rows: fixed biparametric dot plots used to define the most relevant LAIP gates (LAIP1–LAIP8). MRD LAIP was defined using the following Boolean strategy: time AND live cells AND single cells AND (blasts OR MNC CD34+) AND primitive markers (CD34+/−CD117+/−) AND LAIP1 AND LAIP2 AND LAIP3 AND LAIP4 AND LAIP5 AND LAIP6 AND LAIP7 AND LAIP8. In the illustrated case, MRD was 6.8% of WBC CD45+, compared with 0.04% ± 0.03 in healthy bone marrow. Right: back-gating of the final MRD gate used for quantification, allowing cleanup of nonspecific events, erythroblasts, and debris. Abbreviations: AML = acute myeloid leukemia; MRD = measurable residual disease; LAIP = leukemia-associated immunophenotype; FSC = forward scatter; SSC = side scatter; WBC = white blood cells; MNC = mononuclear cells; hBM = healthy bone marrow. Please click here to view a larger version of this figure.
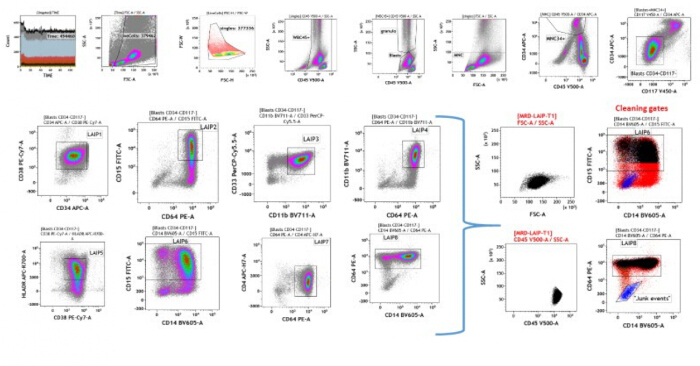
Figure 2: Gating strategy for MRD LAIP analysis in AML using mature blasts (CD34−CD117−) in Tube 3. First row: sequential gating of time, live cells based on FSC versus SSC, single cells based on FSC-W versus FSC-H, WBC CD45+ cells on CD45 versus SSC, blasts on CD45dim/SSC, mononuclear cells (MNC) on FSC-A/SSC-A, MNC CD34+ cells on the CD45 versus CD34 plot, and the mature blast gate on the CD34 versus CD117 plot.
Second and third rows: fixed biparametric dot plots used to define the most relevant LAIP gates (LAIP1–LAIP8). MRD LAIP was defined using the following Boolean strategy: time AND live cells AND single cells AND blasts AND CD34−CD117− blasts AND LAIP1 AND LAIP2 AND LAIP3 AND LAIP4 AND LAIP5 AND LAIP6 AND LAIP7 AND LAIP8. In the illustrated case, MRD was 15% of WBC CD45+, compared with 0.09% ± 0.02 in healthy bone marrow.
Right: back-gating of the final MRD gate used for quantification, allowing cleanup of nonspecific events. Abbreviations: AML = acute myeloid leukemia; MRD = measurable residual disease; LAIP = leukemia-associated immunophenotype; FSC = forward scatter; SSC = side scatter; WBC = white blood cells; MNC = mononuclear cells; hBM = healthy bone marrow. Please click here to view a larger version of this figure.
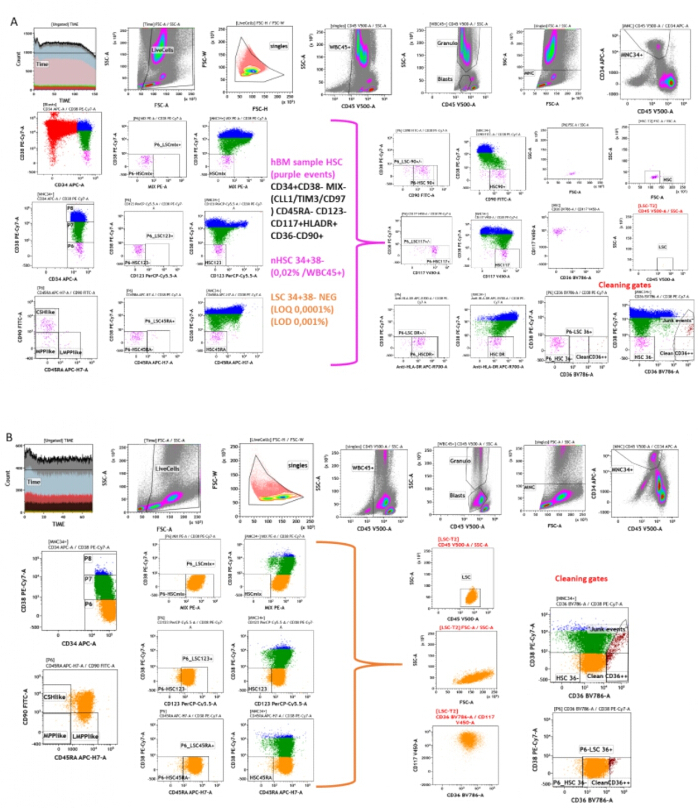
Figure 3: Gating strategy for normal hematopoietic stem cells (nHSCs) and leukemic stem cell (LSC)-enriched cells in the CD34+CD38− fraction (Tube 2). (A) Normal hematopoietic stem cells (nHSCs) and (B) leukemic stem cell (LSC)-enriched cells in the CD34+CD38− fraction (Tube 2). First row: sequential gating of time, live cells based on FSC versus SSC, single cells based on FSC-W versus FSC-H, WBC CD45+ cells on CD45 versus SSC, blasts on CD45dim/SSC, mononuclear cells (MNC) on FSC-A/SSC-A, and MNC CD34+ cells on the CD45 versus CD34 plot.
Second to fourth rows: fixed biparametric dot plots used to define P6 (CD34+CD38−), P7 (CD34+CD38low), and P8 (CD34+CD38high), together with the most relevant dichotomic LSC markers, including MIX (CLL1/TIM3/CD97), CD123, and CD45RA. MRD LSC was defined using the following Boolean strategy: time AND live cells AND single cells AND blasts AND MNC AND MNC CD34+ AND P6 AND (P6 LSC MIX+ OR P6 LSC CD123+ OR P6 LSC CD45RA+).
Right: back-gating of the final MRD LSC gate used for quantification, allowing cleanup of nonspecific events.
(A) nHSCs in a healthy bone marrow sample: nHSCs (purple events) were CD34+CD38−, MIX− (CLL1/TIM3/CD97), CD45RA−, CD123−, CD117+, HLA-DR+, CD36−, and CD90+. The nHSC CD34+CD38− fraction represented 0.02% of WBC CD45+, and LSC CD34+CD38− cells were negative. Reported assay thresholds were LOQ 0.0001% and LOD 0.001%.
(B) LSC-enriched cells in an AML sample: LSC-enriched cells (orange events) were CD34+CD38−, MIX+ (CLL1/TIM3/CD97), CD45RA+, CD123+, CD117+, HLA-DR+, CD36−, and CD90+. The LSC CD34+CD38− fraction represented 3.7% of WBC CD45+. Abbreviations: nHSCs = normal hematopoietic stem cells; LSC = leukemic stem cell; MNC = mononuclear cells; WBC = white blood cells; SSC = side scatter; MIX = CLL1/TIM3/CD97; HLA-DR = human leukocyte antigen-DR; LOQ = limit of quantification; LOD = limit of detection. Please click here to view a larger version of this figure.
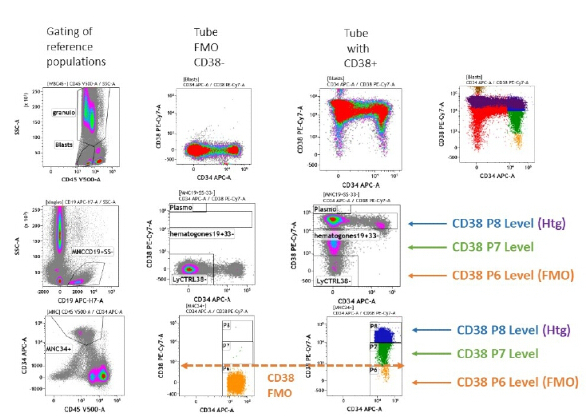
Figure 4: Definition of the CD38− threshold in the CD34+ population using the CD38 fluorescence-minus-one (FMO) channel. First row: gating of reference populations, including blasts on CD45/SSC, MNC CD19+ cells, and MNC CD34+ cells.
Second row: signal level in the CD38 FMO channel. The first line shows blast cells, the second line shows MNC CD19+ cells, and the third line shows MNC CD34+ cells. The orange line indicates the threshold defining the P6 CD34+CD38− gate.
Third row: CD38 PE-Cy7 signal level. The first line shows blast cells, the second line shows MNC CD19+ cells with the CD38 hematogone level used to define P8 CD34+CD38high, and the third line shows MNC CD34+ cells, with P6 CD34+CD38− cells in orange, P7 CD34+CD38low cells in green, and P8 CD34+CD38high cells in blue. Abbreviations: FMO = fluorescence minus one; MNC = mononuclear cells; SSC = side scatter; PE-Cy7 = phycoerythrin-cyanine 7; P6 = CD34+CD38− fraction; P7 = CD34+CD38low fraction; P8 = CD34+CD38high fraction. Please click here to view a larger version of this figure.
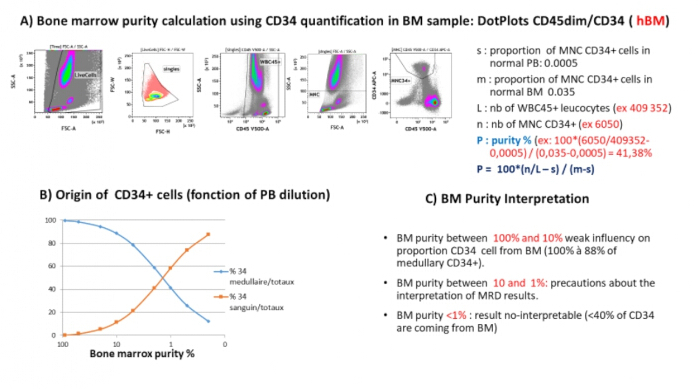
Figure 5: Evaluation of bone marrow sample representativeness based on MNC CD34+ cells. (A) Gating strategy for MNC CD34+ cells and parameters used for formula calculation: n, number of MNC CD34+ cells; L, number of WBC CD45+ cells; s, proportion of MNC CD34+ cells in normal peripheral blood; and m., proportion of MNC CD34+ cells observed in reference normal bone marrow. (B) Schematic representation of the impact of bone marrow (BM) dilution by peripheral blood (PB) on the origin of CD34+ cells in BM samples. (C) Criteria used to interpret BM purity. Abbreviations: BM = bone marrow; PB = peripheral blood; MNC = mononuclear cells; WBC = white blood cells. Please click here to view a larger version of this figure.
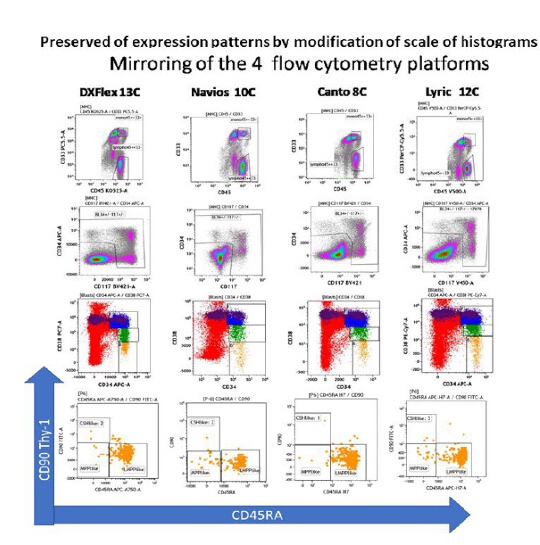
Figure 6: Comparison of expression patterns across four flow cytometer platforms.
A normal bone marrow (BM) sample was tested simultaneously on four cytometer platforms using the defined settings for each platform and scale adjustment. The first row shows MNC cells on the CD45/CD33 dot plot; the second row shows MNC cells on the primitive marker CD34/CD117 dot plot; the third row shows blast cells on the CD34/CD38 dot plot; and the fourth row shows P6 CD34+CD38− cells on the CD45RA/CD90 dot plot. Abbreviations: BM = bone marrow; MNC = mononuclear cells; P6 = CD34+CD38− fraction. Please click here to view a larger version of this figure.
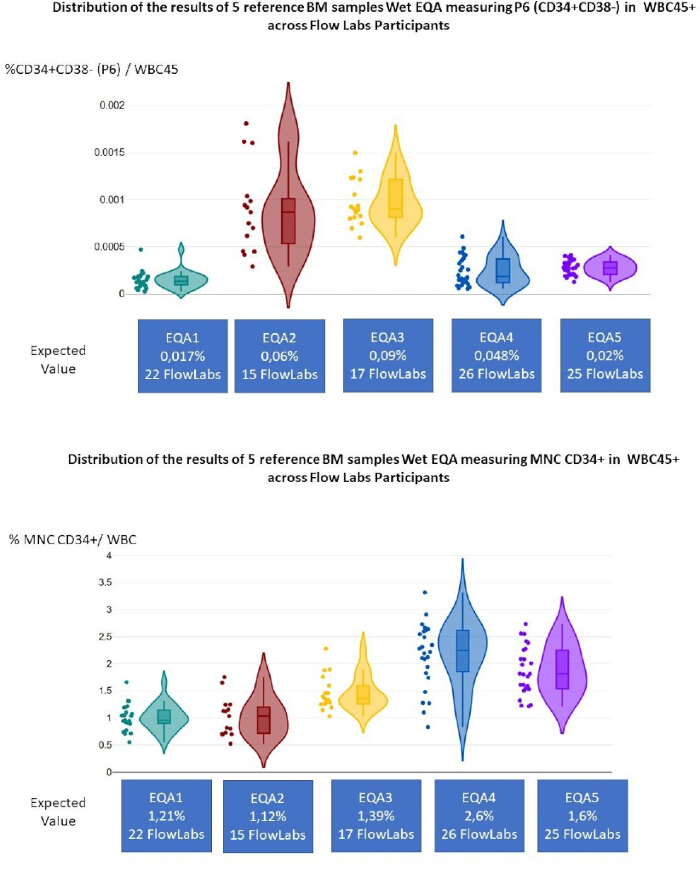
Figure 7: Wet-lab EQA reproducibility across participating flow laboratories. (A) Violin plot showing the distribution of %P6 CD34+CD38− cells in WBC CD45+ cells across the five wet-lab EQA rounds and participating flow laboratories. (B) Violin plot showing the distribution of %MNC CD34+ cells in WBC CD45+ cells across the five wet-lab EQA rounds and participating flow laboratories. Abbreviations: EQA = external quality assessment; P6 = CD34+CD38− fraction; WBC = white blood cells; MNC = mononuclear cells. Please click here to view a larger version of this figure.
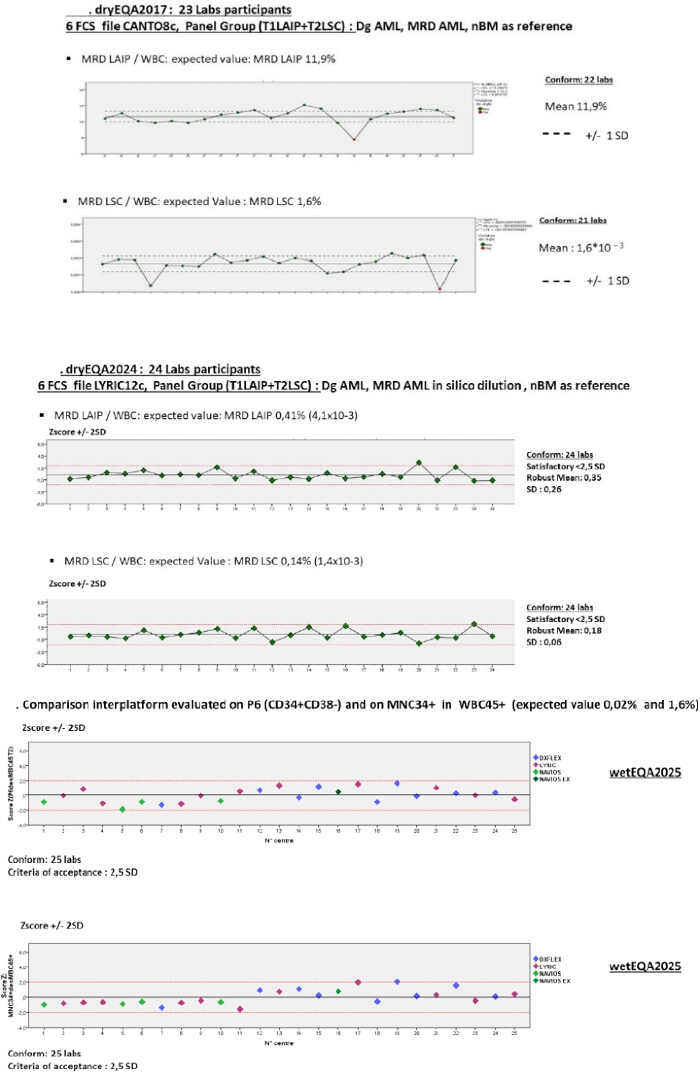
Figure 8: Dry EQA assessment of LAIP/DfN and LSC MRD measurement. (A) Dry EQA2017 exercise for LAIP/DfN and LSC MRD measurement using six shared FCS files from an 8-color panel group, including AML diagnosis, AML MRD, and normal bone marrow reference files for Tube 1 LAIP and Tube 2 LSC analysis. The exercise was shared with 23 participating laboratories. (B) Dry EQA2024 exercise for LAIP/DfN and LSC MRD measurement using six shared FCS files from a 12-color panel group, including AML diagnosis, AML MRD, and normal bone marrow reference files for Tube 1 LAIP and Tube 2 LSC analysis. The exercise was shared with 24 participating laboratories. (C) Interplatform comparison of %MNC CD34+ cells and %nHSC P6 CD34+CD38− cells in WBC CD45+ cells measured during Wet EQA2025, shared with 25 participating laboratories. Expected values were 1.6% for MNC CD34+ cells and 0.02% for nHSC P6 CD34+CD38− cells. Abbreviations: EQA = external quality assessment; LAIP = leukemia-associated immunophenotype; DfN = different-from-normal; LSC = leukemic stem cell; MRD = measurable residual disease; FCS = flow cytometry standard; AML = acute myeloid leukemia; MNC = mononuclear cells; nHSC = normal hematopoietic stem cell; WBC = white blood cells. Please click here to view a larger version of this figure.
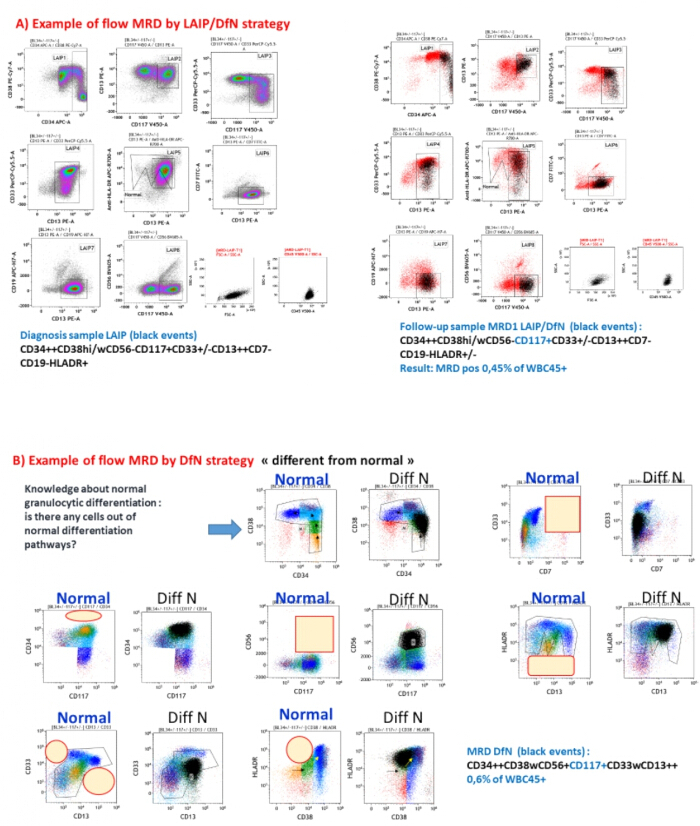
Figure 9: Representative MRD measurement using LAIP/DfN approaches. (A) Example of MRD measurement using the LAIP/DfN method. The left side shows LAIP cartography of leukemic cells in the diagnosis sample, and the right side shows application of the same LAIP cartography to the follow-up sample, with the MRD population shown in black. (B) Example of MRD measurement using the DfN method. Each pair of dot plots compares healthy bone marrow (hBM; normal, left plot) with an MRD follow-up bone marrow sample (DfN, right plot). The “empty box” area is defined on normal bone marrow, and the presence of leukemic cells in this empty box is assessed in the follow-up sample, with the abnormal population shown in black. Abbreviations: MRD = measurable residual disease; LAIP = leukemia-associated immunophenotype; DfN = different-from-normal; hBM = healthy bone marrow. Please click here to view a larger version of this figure.
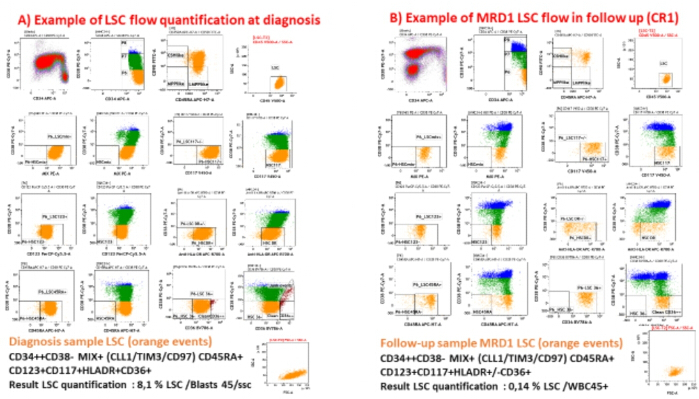
Figure 10: Representative measurement of CD34+CD38− LSC-enriched cells at diagnosis and follow-up. (A) Example of LSC-enriched cell measurement in an AML diagnosis sample. The left side shows the LSC-enriched profile, with the orange population expressing MIX (CLL1/TIM3/CD97), CD123, CD45RA, CD117, HLA-DR, and CD36 within the CD34+CD38− fraction.
(B) Follow-up sample from the same patient showing persistence of MRD LSC-enriched cells with the same immunophenotypic profile (orange population). Abbreviations: LSC = leukemic stem cell; AML = acute myeloid leukemia; MRD = measurable residual disease; MIX = CLL1/TIM3/CD97; HLA-DR = human leukocyte antigen-DR. Please click here to view a larger version of this figure.
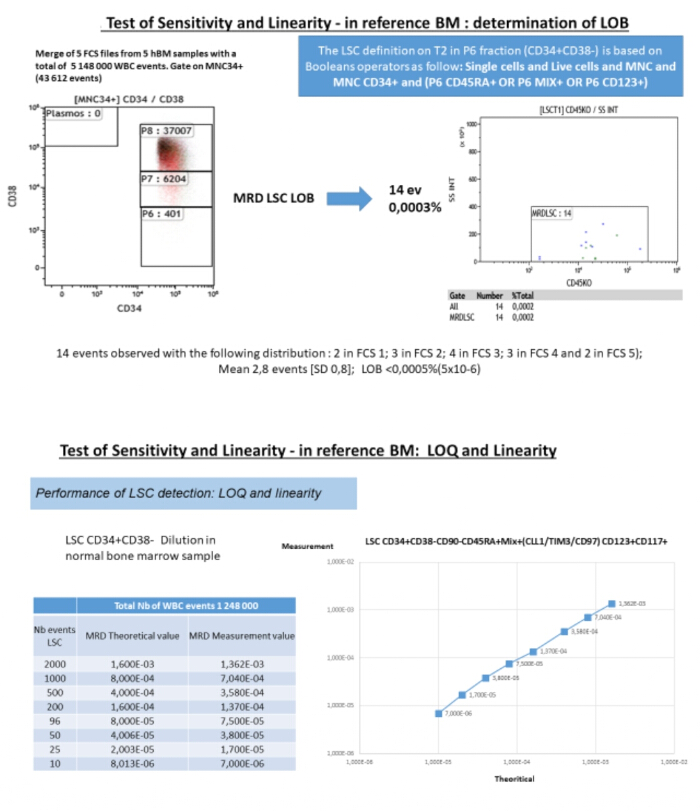
Figure 11: Analytical sensitivity of LSC detection. (A) Evaluation of the limit of blank (LOB) for LSC detection. The left side shows quantification of CD34+CD38− events in a merge of five FCS files from five healthy bone marrow samples (5,148,000 WBC events acquired). The right side shows the number of events belonging to the LSC Boolean gate back-gated on the CD45/SSC dot plot (14 events), corresponding to an LOB of <0.0005% (5 × 10⁻⁶). (B) Evaluation of linearity for LSC quantification. The left side shows serial dilution by spike-in of LSC-enriched cells in a healthy bone marrow sample. The right side shows the correlation between measured MRD values and theoretical values, corresponding to a limit of quantification (LOQ) of 2 × 10⁻⁵ (0.002%). Abbreviations: LSC = leukemic stem cell; LOB = limit of blank; FCS = flow cytometry standard; WBC = white blood cells; MRD = measurable residual disease; LOQ = limit of quantification. Please click here to view a larger version of this figure.
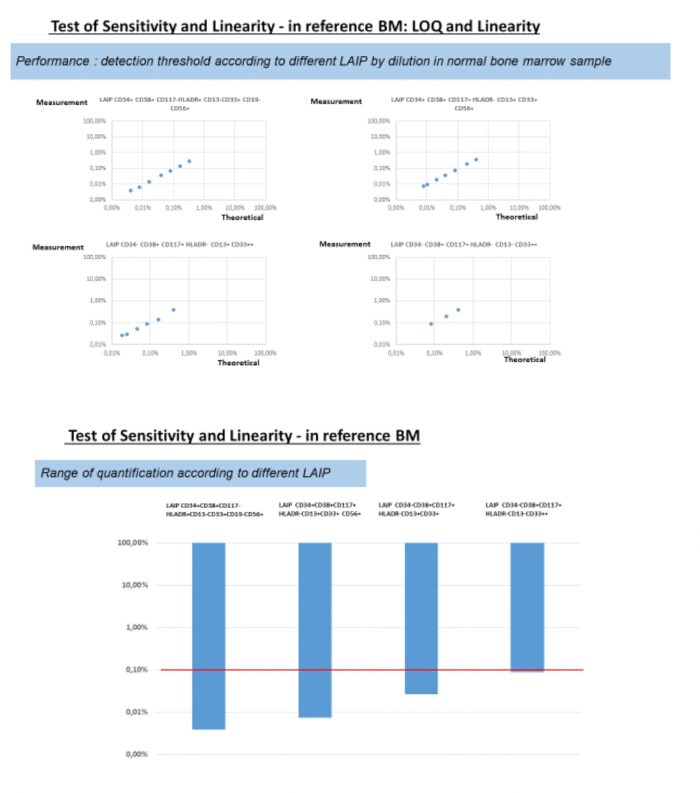
Figure 12: Linearity and quantification range of MRD LAIP measurement. (A) Evaluation of linearity for MRD LAIP quantification by serial dilution of blasts with different LAIPs in healthy bone marrow, showing the correlation between measured MRD values and theoretical values, with variable LOQ according to the different LAIPs and LOQ <0.1%. (B) Range of quantification according to different LAIPs. The red line indicates the 0.1% clinical threshold. The LOQ reached the clinical threshold for all tested LAIPs. Abbreviations: MRD = measurable residual disease; LAIP = leukemia-associated immunophenotype; LOQ = limit of quantification. Please click here to view a larger version of this figure.
| Fluoro chrome | Peak | LYRIC12c | Peak | DxFlex13c | Peak | NAVIOS10c | Peak | CANTO8c |
| FITC | P8 | 44618 | P6 | 89916 | P7 | 104 | P8 | 56316 |
| PE | P8 | 84008 | P6 | 110652 | P7 | 136 | P8 | 88803 |
| ECD | x | x | P6 | 153011 | P7 | 150 | x | x |
| PerCPcy5,5 /PEcy5,5 | P7 | 63610 | P6 | 101791 | P7 | 85 | P7 | 75717 |
| PC7/PEcy7 | P8 | 32412 | P6 | 21381 | P8 | 88 | P8 | 32003 |
| APC | P7 | 111628 | P6 | 192708 | P6 | 181 | P7 | 143946 |
| AA700/AP CR700 | P7 | 25958 | P6 | 237374 | P7 | 182 | x | x |
| A7A750/ APCH7 | P8 | 77444 | P6 | 158729 | P7 | 150 | P8 | 98311 |
| BV421 | P6 | 62031 | P6 | 239208 | P6 | 268 | P6 | 68315 |
| KO/V500 | P7 | 159941 | P6 | 293917 | P6 | 179 | P7 | 124919 |
| BV605 | P7 | 31688 | P6 | 65337 | x | x | x | x |
| BV711/ V660 | P8 | 21816 | P6 | 12107 | x | x | x | x |
| BV786 | P8 | 17560 | P6 | 3795 | x | x | x | x |
Table 1: Target values for each platform using 8-peak rainbow beads. Specific target values are shown for each cytometer platform (Canto, Lyric, Navios, DxFlex). The retained peaks were chosen to be close to the MFI observed for blast cells. This is particularly important for PMT-based cytometers, where signal intensity does not increase linearly with increasing PMT voltage. In contrast, on APD-based cytometers, signal intensity increases linearly with gain, allowing the same peak to be used for all detectors, whereas different peaks are required for each channel on PMT-based cytometers. Abbreviations: MFI = median fluorescence intensity; PMT = photomultiplier tube; APD = avalanche photodiode. Please click here to download this Table.
| CANTO 8C /NAVIOS 8c | FITC | PE | ECD | PerCPC y5,5 | PECy7 | APC | APC-R700 /AA700 | APCH7 | BV421 | V500 | BV605 | BV711 | BV786 |
| Tube 1 LAIP 8c | CD7 5µL /CD56 5µL | CD13 5µL | CD33 10µL | CD38 5µL | CD34 5µL | CD19 5µL | CD117 5µL | CD45 5µL | |||||
| Tube 2 LSC 8c | CD90 5µL | MIX3(2 .5µL/Ac) | CD123 5µL | CD38 5µL | CD34 5µL | CD45RA 5µL | CD117 5µL | CD45 5µL | |||||
| T3 Supple mentaire Gran 8c | CD15 5µL | CD56 5µL | HLADR 10µL | CD38 5µL | CD34 5µL | CD11b 5µL | CD117 5µL | CD45 5µL | |||||
| T3 Supplem entaire - Monos 8c | CD36 5µL | CD64 5µL | CD14 10µL | HLADR 5µL | CD34 5µL | CD4 5µL | CD117 5µL | CD45 5µL | |||||
| MIX3Ac =97 +TIM3+ CLL1 | |||||||||||||
| LYRIC 10-12c | FITC | PE | ECD | PerCPCy5,5 | PECy7 | APC | APC-R700 | APCH7 | BV421 | V500 | BV605 | BV711 | BV786 |
| Tube 1LAIP 12c | CD7 5µL | CD13 5µL | CD33 10µL | CD38 5µL | CD34 5µL | HLADR (5µL) | CD19 5µL | CD117 5µL | CD45 5µL | CD56 5µL | CD10 2µL | CD36 2µL | |
| Tube 2 LSC 12c | CD90 5µL | MIX3(2. 5µL/Ac) | CD123 5µL | CD38 5µL | CD34 5µL | HLADR (5µL) | CD45RA 5µL | CD117 5µL | CD45 5µL | CD200 5µL | CD19 5µL | CD36 2µL | |
| T3 Supple mentaire 12c-Monos | CD15 5µL | CD64 5µL | CD33 10µL | CD38 5µL | CD34 5µL | HLADR (5µL) | CD4 5µL | CD117 5µL | CD45 5µL | CD14 5µL | CD11b 5µL | CD36 2µL | |
| MIX3Ac =97+ TIM3+ CLL1 | |||||||||||||
| NAVIOS 10c | FITC | PE | ECD | PEcy5,5 | PECy7 | APC | AA700 | AA750 | BV421/PB | V500/KO | BV605 | BV711 | BV786 |
| T1 Navios 10c | CD7 10µL | CD13 10µL | HLADR 5µL | CD33 5µL | CD38 5µL | CD34 5µL | CD56 10µL | CD19 5µL | CD117 5µL | CD45 5µL | |||
| T2 Navios 10c | CD90 5µL | MIX3(2.5 µL/Ac) | CD19 5µL | CD123 5µL | CD38 5µL | CD34 5µL | CD36 5µL | CD45RA 5µL | CD117 5µL | CD45 5µL | |||
| T3 Supple mentaire 10c Monos | CD15 5µL | CD4 5µL | HLADR 5µL | CD33 5µL | CD11b 5µL | CD34 5µL | CD36 5µL | CD14 5µL | CD117 5µL | CD45 5µL | |||
| MIX3Ac =97+ TIM3+ CLL1 | |||||||||||||
| DxFLEX 10 -12/13c | FITC | PE | ECD | PEcy5,5 | PECy7 | APC | AA700 | AA750 | BV421/PB | V500/KO | BV605 | BV650 | BV786 |
| T1 DxFLEX 12-13c | CD7 10µL | CD13 10µL | HLADR 5µL | CD33 5µL | CD38 5µL | CD34 5µL | CD56 10µL | CD19 5µL | CD117 5µL | CD45 5µL | CD36 5µL | CD10 2µL | / |
| T2 DxFLEX 12-13c | CD90 5µL | MIX3(2.5 µL/Ac) | CD19 5µL | CD123 5µL | CD38 5µL | CD34 5µL | CD36 5µL | CD45RA 5µL | CD117 5µL | CD45 5µL | / | CD200 5µL | HLADR snv786 (3µL) |
| T3 Supple mentaire 12c Monos | CD15 5µL | CD4 5µL | HLADR 5µL | CD33 5µL | CD38 5µL | CD34 5µL | CD36 5µL | CD14 5µL | CD117 5µL | CD45 5µL | CD64 5µL | CD11b 5µL | / |
Table 2: Antibody panel configurations for AML MRD LAIP/DfN and LSC analysis. The table summarizes 8-, 10-, 12-, and 13-color panel configurations according to cytometer platform. Tube 1 is used for LAIP/DfN analysis, Tube 2 for CD34+CD38− LSC-enriched cell analysis, and Tube 3 for monocytic/granulocytic differentiation markers. Antibody volumes and fluorochrome assignments are shown for each platform. MIX3 corresponds to CD97, TIM3, and CLL1. Abbreviations: AML = acute myeloid leukemia; MRD = measurable residual disease; LAIP = leukemia-associated immunophenotype; DfN = different-from-normal; LSC = leukemic stem cell; MIX3 = CD97/TIM3/CLL1. Please click here to download this Table.
| Complete loss of normally expressed markers on myeloid precursors |
| CD13++CD33-/CD34+ or CD117+ |
| CD13-CD33++/CD34+ or CD117+ |
| CD13+HLADR-/CD34+ |
| CD13+CD117+CD34- |
| Cross lineage lymphoid marker expression on myeloid precursors |
| CD7+CD13+/CD34+ or CD117+ |
| CD7+CD33+/ CD34+ or CD117+ |
| CD56+CD13+/ CD34+ or CD117+ |
| CD56+CD33+/ CD34+ or CD117+ |
| CD19+CD117+/ or CD13+ or CD33+ |
| Overexpression on myeloid precursors |
| CD34++/CD117+ |
| CD117++/CD13+CD33+ |
| Decreased expression on myeloid precursors |
| CD38loCD34+CD33+CD117+ |
Table 3: LAIP-based DfN “empty box” definitions. The table lists predefined different-from-normal (DfN) “empty box” patterns used to identify abnormal myeloid precursor populations. Categories include complete loss of normally expressed markers, cross-lineage lymphoid marker expression, marker overexpression, and decreased marker expression on myeloid precursors. Abbreviations: LAIP = leukemia-associated immunophenotype; DfN = different-from-normal. Please click here to download this Table.
| Holdrinet et al.17 | |
| Broolmans et al.15 | |
| Bone marrow purity = (1 − (GRMO/GRSG) x (GBSG/GBMO)) x 100 | >80% |
| Björlund et al.19 | GPA > 15% |
| CD3 < 20% | |
| Loken et al.18 | CD16high < 30% |
| Theunissen et al.20; Dworzak et al.21 | |
| Flow or Ctr DIL cytologic: PNN < 40%, Ebl > 5%, Ly < 20% | CD16++ CD11b++ < 40% |
| GPA > 5% | |
| CD3 < 20% | |
| BM purity %: MNC 34+/WBC45+ | BM purity 100-10% |
Table 4: Bone marrow dilution control methods for AML MRD flow reporting. The table summarizes published bone marrow dilution and representativeness control methods that may be used for AML MRD flow clinical reports. At least one dilution-control method should be applied to support interpretation of MRD results. The CD34/WBC45+ bone marrow purity approach is included as a complementary quality assessment. Abbreviations: AML = acute myeloid leukemia; MRD = measurable residual disease; BM = bone marrow; WBC = white blood cells; CD34/WBC45+ = CD34+ cells among CD45+ white blood cells. Please click here to download this Table.
Supplemental File 1: Additional background, platform harmonization, reference bone marrow, and prognostic-support materials. This supplemental file contains supporting figures and tables related to LSC identification, AML phenotypic heterogeneity, interplatform mirroring, platform-specific optimization, reference bone marrow marker-expression profiles, longitudinal panel evolution, and the prognostic threshold used for LSC quantification at diagnosis. These materials provide additional context for the multicenter MRD flow cytometry workflow, including the rationale for CD34+CD38− LSC-enriched cell assessment, the technical basis for platform harmonization, and supporting data used to interpret reference marrow background, panel migration, and clinical threshold selection.Please click here to download this file.
Discussion
Critical steps in the protocol
Sample quality is crucial for accurate MRD and LSC quantification. Fresh bone marrow samples should be transported at room temperature and processed ideally within 24–48 h, and, if necessary, within 72 h after collection23. Hemodilution should be evaluated at each time point and included in the clinical flow report. The clinician should specify the treatment time point, for example, after induction, consolidation, targeted immunotherapy, less intensive treatment such as azacitidine/venetoclax, or allograft. The landscape of differentiation is closely related to treatment and time point and is important to integrate into MRD interpretation. During longitudinal follow-up, the same instrument sensitivity and analysis reliability should be maintained by regular checks of target values with rainbow control beads, regular EQA, and collegial review of FCS files throughout the study.
A high level of standardization and intercenter reliability of MRD flow quantification is maintained through regular web-based educational training in the flow group. At least one web training session per month was performed, and more than 100 cases of MRD LAIP/DfN, MRD LSC, or diagnostic LSC quantification were discussed and reviewed during these years. This continuing education is important because interpreting flow data requires a highly qualified biologist, particularly for low-level MRD, physiological background populations, regenerating marrow, and phenotypic switches under treatment.
Quantification of CD34+CD38− LSC-enriched populations is another critical step. There is no universal marker to capture normal hematopoietic stem cells or LSCs. The HOVON group introduced LSC monitoring in AML diagnosis and follow-up using an 8-color panel including a set of relevant “dichotomic” LSC markers3. Dichotomic markers are defined as showing no expression in normal hematopoietic stem cells but positive expression in LSC-enriched populations, with dim, intermediate, high, heterogeneous, or bimodal patterns. There is interest in including a mix of specific dichotomic LSC markers, such as CLL1, TIM3, and CD97, in a single channel, because if only one is positive, LSC-enriched cells can still be detected. Other markers should be used separately in specific channels because their expression can overlap with that of normal hematopoietic stem cells, depending on the state of the bone marrow, including regenerating or stressed marrow24. The complete definition of LSC-enriched cells is based on Boolean operators, including aberrant expression of markers in the CD34+CD38− fraction. Because this remains a phenotypic definition, the population should be interpreted as CD34+CD38− LSC-enriched cells rather than as functionally proven LSCs in every sample. This LSC panel is also applicable in patients with MDS with excess blasts and AML MRC using the same protocol.
Modifications and troubleshooting of the method
During platform and panel evolution, the standardization/harmonization approach must be maintained within the laboratory network, particularly when moving from 8- to 10-color panels to 12- to 13-color panels. With the evolution of machines, there is a need to keep a common backbone of antibodies and the same sensitivity in the detection of phenotypic anomalies throughout clinical study. During platform evolution, the fluorochromes of antibodies in the backbone remain stable and common across all machines (CD34/CD38/CD45/CD117). However, for some channels, a change of fluorochromes is necessary due to the machine-specific optical bank, which requires a harmonization approach. When switching from a PMT detector cytometer to an APD detector cytometer, the high sensitivity of APD detectors at high wavelengths must be considered. Therefore, in some cases, the choice of fluorochromes for certain antibodies must be adjusted to maintain the same staining index and avoid excessive spread between channels, thereby adopting an optimization approach. Current clinical cytometers support 12- to 13-color panels, increasing specificity in the detection of LAIP and improving interpretation through the addition of markers that eliminate contaminating cells in the MRD gate. However, this also increases the complexity of analysis23.
The upgrade from 8-color to 12-color panels improved the sensitivity and specificity of MRD assessment in some cases (Supplemental File 1). In Tube 1, HLA-DR, CD36, CD10, and CD56 were added, separated from CD7. In Tube 2, HLA-DR, CD36, CD200, and CD19 were added. In Tube 3, CD4, CD64, CD38, CD36, and CD14 were added. HLA-DR, now systematically combined with CD38 in each tube, provides a clearer definition of LAIP and altered differentiation patterns. CD36, now systematically included in each tube, is a key marker for identifying erythroblasts, red cells, platelets, and debris, and for refining the final MRD gate. CD19 in the LSC tube also helps to identify hematogones. Combining monocyte and granulocyte differentiation markers in one tube allows better delineation of monocytic and granulocytic differentiation patterns and helps distinguish aberrancies to identify LAIP. When moving from 8-color to 10-color panels, the main improvement came from LAIP detection, especially with the addition of HLA-DR and CD56 separated from CD7 in Tube 1 and HLA-DR and CD19 in Tube 2. When moving from 10-color to 12-color panels, the improvement came from better cleaning of the blast and LSC gates with the addition of CD36 in each tube, completed by CD10 in Tube 1 and CD200 in Tube 2. This was particularly useful for patients with low-level MRD above the limit of detection but under the limit of quantification. Taken together, most patients with MRD positivity at the clinical threshold ≥ 0.1% were already identified with the 8-color panel; however, using more markers in the tubes improved specificity and interpretation of MRD assessment, especially for low-level MRD as mentioned in ELN 2025 guidelines.
Limitations of the method
Choosing a multicenter approach can be challenging. The feasibility of this concept requires mandatory steps before implementing MRD flow in AML clinical trials: harmonization of instrument sensitivity and sample preparation, and training and systematic education for analytical operators25. As platforms evolve, the multicenter, multiplatform strategy must be adapted to maintain the robustness and reproducibility of the results. This includes standardization, using the same panel and settings for the same platform type; harmonization, using the same panel across multiple platforms with harmonized settings; and optimization, using a panel and specific settings adapted to each platform.
Hemodilution is one of the most challenging and critical points for MRD flow quantification. The CD34/WBC representativeness formula described in this protocol should be used as a complementary quality-control measure for the bone marrow sample and should not be used to normalize MRD results. Its interpretation may be affected by marrow regeneration, treatment effects, residual disease, and less intensive regimens. Similarly, markers such as CD56, CD123, and CD45RA should not be interpreted as standalone DfN or LSC markers. They should be interpreted within the complete gating strategy, cleanup gates, reference bone marrow background, and clinical context.
Significance of the method with respect to existing or alternative methods
According to the ELN 2025 guidelines, MRD is a major prognostic marker in patients with AML, regardless of the technique or timing of assessment. The use of different MRD flow techniques and markers is highly complementary. Multimodal MRD, including LAIP/DfN and LSC analysis, is useful provided that the analysis is performed within a standardized network with harmonized reporting of results. MRD assessment allows a better definition of therapeutic response and relapse. Multicenter and multimodal MRD flow, together with molecular MRD, will play a strategic role in future clinical trials within an increasingly complex therapeutic landscape that includes new targeted therapies, first- and second-line treatments, allogeneic transplantation, and low-intensity therapies.
Importance and potential applications of the method in specific research areas
The HOVON and ALFA groups reported that quantification of CD34+CD38− LSC-enriched populations at AML diagnosis has clinical impact (Supplemental File 1). It seems crucial to define clinically significant thresholds for LSC based on the method of quantification. As previously reported using the method described here, an LSC threshold ≥1% was associated with an unfavorable outcome (Supplemental File 1)26. In AML management, differential integration of MRD, LSC monitoring, and clonal hematopoiesis may help refine therapeutic interpretation. The main challenge lies in distinguishing MRD, which may require additional treatment, from stable pre-leukemic clones, which may not27. An integrated reporting system for calculating the percentage of blasts was recently recommended for AML follow-up in the 2025 EHA/ELN guidelines28. It integrates MRD results with morphological comparison for a harmonized assessment of blasts and should facilitate consistent reporting in clinical trials to define response categories in AML patients.
Both the HOVON study and the ALFA/FILO BIG1 study show that a score combining LAIP/DfN and LSC approaches allowed patients to be classified into four groups: LAIP−/LSC−, LAIP+/LSC−, LAIP−/LSC+, and LAIP+/LSC+, with different 3-year overall survival rates3,26,29. Overall, these results illustrate the prognostic clinical impact of combined MRD LAIP/DfN and LSC status. In the context of allogeneic hematopoietic stem cell transplantation, the presence of CD34+CD38− LSC-enriched cells has also been reported as a predictor of post-transplant failure, even when the total number of blasts is less than 5%30. These clinical data support the relevance of combined MRD flow strategies, but the current protocol focuses on standardizing the technical workflow and reporting across centers.
As perspectives, spectral flow technology may expand the panel of markers tested simultaneously in a multidimensional flow cytometry approach, thereby increasing the specificity of monitored LAIPs and reducing biological background noise from hematopoietic regeneration. Evaluation of spectral flow reproducibility across platforms, panels, and centers, as proposed here, will be challenging for clinical implementation. New unsupervised analysis algorithms, including FlowSOM, t-SNE, and UMAP, may facilitate discrimination between normal hematopoiesis and the leukemic compartment, from the CD34+CD38− LSC-enriched fraction to the blast bulk. Capturing LSC fractions more deeply could help improve monitoring of engraftment in patient-derived xenograft models31,32. ELN working groups have been established to validate and harmonize these new approaches33,34.
Disclosures
The authors have no conflicts of interest to declare.
Acknowledgements
We are grateful to the ALFA/FILO French AML clinical coordinators, Hervé Dombret and Christian Recher; the biological coordinator, Claude Preudhomme; and the clinical investigators from all centers. Special thanks are addressed to ALFA trial coordinator Karine Celli-Lebras for her help with logistics for the flow meetings. We thank Hélène Labussière-Wallet and Celine Berthon from the Clinical Hematology departments of CHU Lyon and CHU Lille. We thank all French Flow AML MRD LSC working group participants and technicians from all flow laboratories for their continued efforts to improve the standardization of flow cytometry AML MRD LSC analysis. We thank research technicians Morgane Denis and Joris Gutrin from the Lyon flow laboratory. We thank Florent Navarro from Becton Dickinson and Antoine Pacheco from Beckman Coulter for technical support.
Materials
| Name | Company | Catalog Number | Comments |
|---|---|---|---|
| Antibodies (CANTO 8C-LYRIC12C) | Fluorochrome | Company | Catalog Number |
| CD90 | FITC | BD Pharmingen | 555595 |
| CD7 | FITC | BD Bioscience | 332773 |
| CD13 | PE | BD Bioscience | 347406 |
| CD33 | PerCPCy5,5 | BD Bioscience | 333146 |
| CD117 | BV421 | BD Bioscience | 563856 |
| CD38 | PeCy7 | BD Bioscience | 335825 |
| CD34 | APC | BD Bioscience | 345804 |
| CD45RA | APCH7 | BD Pharmingen | 560674 |
| CD19 | APCH7 | BD Bioscience | 641395 |
| CD45 | V500 | BD Bioscience | 560777 |
| CD97 | PE | BD Pharmingen | 555774 |
| TIM3(CD366) | PE | BD Pharmingen | 563422 |
| CLL1(CD371) | PE | BD Pharmingen | 562566 |
| CD123 | PerCPcy5.5 | BD Pharmingen | 558714 |
| CD15 | FITC | BD Bioscience | 332778 |
| CD64 | PE | BD Pharmingen | 558592 |
| CD11b | BV711 | BD Bioscience | 740771 |
| CD4 | APCH7 | BD Bioscience | 641398 |
| HLADR | APC-R700 | BD Horizon | 565127 |
| CD56 | BV605 | BD Horizon | 562780 |
| CD14 | BV605 | BD Horizon | 564054 |
| CD200 | BV605 | BD Biosciences | 562853 |
| CD10 | BV711 | BD Biosciences | 740770 |
| CD36 | BV786 | BD Biosciences | 745554 |
| CD19 | BV711 | BD Biosciences | 563036 |
| Antibodies (NAVIOS 10C/DxFlex 12C/13C) | Fluorochrome | Company | Catalog Number |
| CD90 | FITC | BD Pharmingen | 555595 |
| CD7 FITC | FITC | BC iotest | A07755 |
| CD13 | PE | BC iotest | A07762 |
| CD33 | PC5.5 | BC iotest | B36289 |
| CD117 | SNV428 | BC iotest | C76813 |
| CD38 | PEcy7 | BDBioscience | 335825 |
| CD34 | APC | BC iotest | IM2472 |
| CD45RA | APCH7 | BDBioscience | 560674 |
| CD19 | AA750 | BC iotest | A94681 |
| CD45 | KromeOrange | BC iotest | B36294 |
| CD97 | PE | BD Pharmingen | 555774 |
| TIM3(CD366) | PE | BD Pharmingen | 563422 |
| CLL1(CD371) | PE | BD Pharmingen | 562566 |
| CD123 | PC5.5 | BC iotest | B20022 |
| HLADR | ECD | BC iotest | B92438 |
| CD36 | AA700 | BC iotest | B46022 |
| CD19 | ECD | BC iotest | A07770 |
| CD4 | PE | BC iotest | A07751 |
| CD11b | BV650 | Bdhorizon | 569704 |
| CD14 | AA750 | BC iotest | B92421 |
| HLADR | SNV786 | BC iotest | C78087 |
| CD56 | AA700 | BC iotest | B92446 |
| CD64 | BV605 | Bdoptibuild | 569172 |
| CD36 | BV605 | BD Horizon | 563518 |
| CD10 | BV650 | Bdoptibuild | 745390 |
| CD15 | FITC | BD | 332778 |
| CD200 | BV650 | Bdoptibuild | 743085 |
| BD FACSCanto II (8-color, blue/red/violet) | BD Bioscience | 338962 | |
| BD FACSLyric 3-Laser 12-Color Instrument | BD Bioscience | 662383 | |
| BC NAVIOSNavios 10 Colors, 3 Lasers, B5-R3-V2 Configuration | Beckman Coulter | B47905 | |
| BC DxFLEX 13-Colors, 13 Detectors, 3 Laser, B5-R3-V5 | Beckman Coulter | C78505 | |
| BC Kaluza Software v 3.1 | Bekman Coulter | A82959 | |
| BD FACSuite Software v1.6 | BD Bioscience | 651360 | |
| BD FACSDiva software v 8.0.3 (Win 7 32 bit OS) | BD Bioscience | 659523 | |
| BD CST Beads | BD Bioscience | 656505 | |
| Multicolor COMPBEADS | BD Bioscience | 552843 | |
| Sphero Rainbow Calibration Particles (8 peaks), 3.0 - 3.4 µm | BD Bioscience | 559123 | |
| ClearL Lab Compensation Beads | Beckman Coulter | B99883 | |
| PharmLyse NH4Cl 100ml10x conc | BD Bioscience | 555899 | |
| DPBS, 1X | CORNING | 21-031-CV | |
| Brillant Stain Buffer Plus | BD Bioscience | 566385 | |
| MGG (May-Grünwald-Giemsa) | Sigma Aldrich | 1014242500 |
Reprints and Permissions
This article has been published
Video Coming Soon