Intracerebroventricular inhibition of microRNA-423-5p was associated with improved neurological scores, smaller infarct volume, reduced microRNA-423-5p abundance, and altered Bax/Bcl-2 protein expression after permanent middle cerebral artery occlusion in rats.
Research Article
MicroRNA-423-5p Inhibition is Associated with Reduced Infarct Severity After Permanent Cerebral Ischemia in Rats
Xue Yang*1 , Junfang Yang*2 , Tao Zang3 , Yanjun Gong4 , Jing Lin4 , Jianhao Chen5 , Ying Chen6 , Qiong Cheng4,7
1Department of Neurology, Fujian Provincial Governmental Hospital, 2Department of Neurology, People's Hospital of Changji Hui Autonomous Prefecture, 3Department of Emergency, People's Hospital of Changji Hui Autonomous Prefecture, 4Department of Neurosurgery, People's Hospital of Changji Hui Autonomous Prefecture, 5Department of Rehabilitation Medicine, Shengli Clinical Medical College of Fujian Medical University, Fuzhou University Affiliated Provincial Hospital, 6Department of Neurology, Shengli Clinical Medical College of Fujian Medical University, Fuzhou University Affiliated Provincial Hospital, 7Shengli Clinical Medical College of Fujian Medical University, Fuzhou University Affiliated Provincial Hospital
Opens in a new tab
In This Article
Summary
Loading...
$$\rightleftharpoonup{xx}$$
$$\longleftharp{xx}$$,
$$\longrightharp{xx}$$,
Abstract
Loading...
$$\rightleftharpoonup{xx}$$
$$\longleftharp{xx}$$,
$$\longrightharp{xx}$$,
Acute cerebral infarction causes irreversible injury in the infarct core and secondary damage in surrounding ischemic tissue, where apoptosis-related signaling may contribute to lesion progression. This study evaluated whether inhibition of microRNA-423-5p is associated with improved early outcomes in a rat model of permanent middle cerebral artery occlusion. Adult male Sprague-Dawley rats were assigned to Sham, permanent middle cerebral artery occlusion, permanent middle cerebral artery occlusion plus negative-control adenovirus, or permanent middle cerebral artery occlusion plus microRNA-423-5p-interfering adenovirus groups. A stereotactic intracerebroventricular injection was performed 72 h before occlusion. Neurological deficits were assessed 24 h after surgery using the Zea Longa score; infarct volume was quantified by 2,3,5-triphenyltetrazolium chloride staining; Bax and Bcl-2 protein expression were evaluated by Western blotting; and microRNA-423-5p expression was measured by quantitative real-time polymerase chain reaction. Bioinformatic prediction was also summarized to contextualize BAX as a potential microRNA-423-5p-associated apoptosis-related gene. microRNA-423-5p inhibition was associated with lower neurological deficit scores, reduced infarct volume, decreased Bax expression, increased Bcl-2 expression, and reduced microRNA-423-5p abundance in ischemic brain tissue. These findings support a preliminary association between inhibition of microRNA-423-5p and reduced injury severity after permanent cerebral ischemia. However, direct target validation and direct apoptosis assays are required to define the underlying mechanism.
Introduction
Loading...
$$\rightleftharpoonup{xx}$$
$$\longleftharp{xx}$$,
$$\longrightharp{xx}$$,
Cerebrovascular disease includes a broad group of disorders caused by impaired cerebral blood supply, vascular rupture, vascular wall injury, abnormal blood flow, or blood-related pathological changes. Ischemic stroke is the predominant subtype of stroke and remains a major cause of disability and death in China1. Because ischemic stroke often occurs suddenly and is associated with long-term neurological impairment and recurrence, additional strategies are needed to reduce early brain injury and improve neurological outcomes. During acute cerebral infarction, the ischemic lesion includes an irreversibly injured core and a surrounding region of vulnerable ischemic tissue. Delayed cell death in the ischemic area has been linked to apoptosis-related mechanisms, particularly in potentially salvageable tissue after acute brain ischemia2. Current recanalization therapies, including intravenous thrombolysis and mechanical thrombectomy, can restore blood flow in selected patients, but the clinical use is limited by a narrow therapeutic window, incomplete eligibility, hemorrhagic risk, and incomplete tissue reperfusion in some cases3. Therefore, experimental studies continue to explore molecular pathways that may contribute to secondary ischemic injury and post-ischemic cell loss4.
Apoptosis is a regulated form of cell death that contributes to physiological tissue homeostasis and to pathological cell loss under disease conditions5. In ischemic brain injury, apoptosis-related signaling is commonly investigated because it may contribute to delayed neuronal and non-neuronal cell loss in vulnerable ischemic regions. The Bcl-2 family is a central regulator of mitochondrial apoptosis. Bcl-2 generally supports cell survival, whereas Bax promotes apoptotic progression, and the relative balance between Bcl-2 and Bax is an important determinant of cell fate after apoptotic stimulation6. Altered expression of apoptosis-associated molecules, including Bcl-2 family proteins, has also been reported in human ischemic stroke tissue, supporting the relevance of these pathways in cerebral ischemic injury7.
MicroRNAs are endogenous small non-coding RNAs of approximately 22 nucleotides that regulate gene expression through sequence-dependent interactions with target transcripts. The first microRNA, lin-4, was identified in Caenorhabditis elegans in 19938. Although many microRNAs repress gene expression through partial complementarity with sites in the 3′ untranslated region of target mRNAs, microRNA-mediated regulation is not limited to a single binding region or mechanism. Target recognition and downstream effects depend on seed matching, local sequence context, transcript structure, and cell-type-specific regulatory conditions9. In addition, canonical and non-canonical microRNA biogenesis, as well as multiple mechanisms of microRNA-mediated gene regulation, have been described, indicating that microRNA effects should be interpreted within broader regulatory networks rather than as isolated one-to-one interactions10.
miR-423-5p has been linked to ischemic stroke and experimental cerebral ischemia in previous studies. Circulating microRNA profiling studies have identified miR-423-5p as a candidate blood-based biomarker associated with acute ischemic stroke11. In an experimental rat model of cerebral ischemia/reperfusion injury, miR-423-5p knockdown was reported to improve neurological indicators and reduce ischemic injury-related outcomes12. These findings suggest that miR-423-5p may be involved in ischemic brain injury, but its role in permanent cerebral ischemia and its relationship with apoptosis-related proteins remain incompletely defined.
In the present study, the authors evaluated whether intracerebroventricular delivery of a microRNA-423-5p-interfering adenovirus was associated with early neurological and molecular changes in a rat model of permanent middle cerebral artery occlusion. Neurological deficit score, infarct volume, microRNA-423-5p abundance, and Bax/Bcl-2 protein expression were assessed 24 h after ischemic injury. Bioinformatic prediction was also summarized to provide a candidate basis for discussing BAX as a potential microRNA-423-5p-associated apoptosis-related gene, while Bax protein expression was measured as an apoptosis-related molecular readout. Because direct target-validation assays and direct apoptosis assays were not performed, this study was designed and interpreted as a preliminary in vivo association analysis rather than a definitive mechanistic validation study.
Protocol
Loading...
$$\rightleftharpoonup{xx}$$
$$\longleftharp{xx}$$,
$$\longrightharp{xx}$$,
All animal experiments were reviewed and approved by the Institutional Animal Care and Use Committee of Jiangxi Zhonghong Boyuan Biotechnology Co., Ltd. (Approval No. 2022071501) and were performed in accordance with the approved animal protocol and institutional guidelines for animal welfare and biosafety.
Animal preparation and experimental grouping
Adult specific-pathogen-free male Sprague-Dawley rats, approximately 8–10 weeks of age and weighing 280–350 g at the time of surgery, were used in this study. Male rats were selected to reduce biological variability associated with estrous-cycle-dependent hormonal changes, which may influence ischemic brain injury and apoptosis-related molecular readouts in rodent stroke models. All animals were housed under controlled laboratory conditions with a 12 h light/12 h dark cycle, a temperature of 22–25 °C, and 40–60% relative humidity. Food and water were available ad libitum. Animals were acclimated to the housing environment for at least 7 days before any surgical procedure. During acclimation, animals were observed daily for general activity, grooming, body weight change, and signs of illness. Animals showing abnormal activity, marked weight loss, respiratory distress, or other signs of poor health before surgery were not included.
Rats were randomly assigned to four experimental groups, with six rats in each group: Sham, permanent middle cerebral artery occlusion, permanent middle cerebral artery occlusion plus negative-control adenovirus, and permanent middle cerebral artery occlusion plus miR-423-5p-interfering adenovirus. Randomization was performed before viral injection, and group allocation was concealed from investigators responsible for neurological scoring, infarct volume measurement, and Western blot band-intensity analysis. The negative-control adenovirus group was included to control for non-specific effects related to stereotactic injection, adenoviral delivery, and expression of a non-targeting control sequence. The Sham group underwent the same cervical exposure procedure without filament advancement to the middle cerebral artery occlusion site. Preset exclusion criteria included death before the planned endpoint, absence of neurological deficit after permanent middle cerebral artery occlusion, evidence of subarachnoid hemorrhage, or technical failure during viral injection or filament placement. Before surgery, all surgical instruments were sterilized, the stereotaxic apparatus and operating surface were disinfected, and the heating pad was pre-warmed. Ophthalmic ointment was applied after anesthesia induction to prevent corneal drying. Body temperature was maintained near 37 °C during anesthesia, surgery, and early recovery. Animals were monitored until they regained spontaneous movement and were then returned to clean cages with free access to food and water.
Adenoviral vector information and preparation
The miR-423-5p-interfering adenovirus was generated as a replication-deficient recombinant adenovirus based on an E1/E3-deleted adenoviral backbone. The interference cassette was designed to suppress rat miR-423-5p expression and was driven by the U6 promoter. The mature rat miR-423-5p sequence used for interference design was 5′-UGAGGGGCAGAGAGCGAGACUUUU-3′, and the corresponding antisense interference sequence was 5′-AAAAGTCTCGCTCTCTGCCCCTCA-3′. The negative-control adenovirus carried a scrambled non-targeting sequence, 5′-TTCTCCGAACGTGTCACGT-3′, which was designed not to target known rat transcripts. Both the miR-423-5p-interfering adenovirus and the negative-control adenovirus were prepared at a working titer of 1.0 × 10¹⁰ PFU/mL. The viral vectors contained an EGFP reporter cassette driven by the CMV promoter to monitor viral delivery, but EGFP fluorescence was not used for outcome quantification. Detailed information on the vector backbone, promoter, interference sequence, negative-control sequence, reporter cassette, viral titer, supplier, and catalog or order number is provided in the Table of Materials.
Store adenoviral aliquots at −80 °C before use and avoid repeated freeze-thaw cycles. On the day of stereotactic injection, thaw the required aliquot on ice immediately before surgery. Keep the virus on ice throughout the injection procedure and gently mix the solution before loading it into the Hamilton microsyringe. Do not vortex the virus. Load 3–5 µL of virus per rat into the microsyringe, then inspect the syringe tip to ensure no air bubbles are present. Use a separate sterile syringe, or thoroughly rinse the syringe between viral preparations, to avoid cross-contamination. The negative-control adenovirus group was included to distinguish miR-423-5p-specific effects from non-specific effects caused by stereotactic injection, adenoviral delivery, viral protein expression, or expression of a non-targeting sequence. Intervention efficiency was evaluated by quantitative real-time polymerase chain reaction measurement of miR-423-5p abundance in ischemic brain tissue collected 24 h after permanent middle cerebral artery occlusion. The decrease in miR-423-5p expression in the intervention group was interpreted as functional evidence of successful in vivo suppression of miR-423-5p.
Stereotactic intracerebroventricular injection of adenovirus
Rats assigned to the adenovirus-treated groups received a stereotactic intracerebroventricular injection 72 h before permanent middle cerebral artery occlusion. Anesthesia was induced with 3–4% isoflurane in oxygen in an induction chamber and maintained with 1.5–2% isoflurane through a nose cone during the procedure. Adequate anesthesia was confirmed by the absence of the pedal withdrawal reflex. After anesthesia induction, ophthalmic ointment was applied to both eyes, and the rat was placed on a pre-warmed heating pad to maintain body temperature near 37 °C.
The anesthetized rat was secured in a stereotaxic apparatus with the head fixed using ear bars and an incisor bar. The scalp hair was shaved, and the surgical area was disinfected by alternating povidone-iodine and 75% ethanol three times. A midline scalp incision was made to expose the skull surface. The skull was gently cleaned with sterile cotton swabs, and bregma and lambda were identified under the stereotaxic microscope. The skull position was adjusted until bregma and lambda were located on the same horizontal plane. The right lateral ventricle was targeted using the following coordinates relative to bregma: anteroposterior −0.8 mm, mediolateral +1.5 mm, and dorsoventral −3.5 mm. A small burr hole was drilled carefully at the target site without damaging the dura. A Hamilton microsyringe loaded with the miR-423-5p-interfering adenovirus or negative-control adenovirus was positioned above the burr hole. The needle was lowered slowly to the target depth to avoid tissue compression and reflux along the injection track.
A total volume of 3–5 µL adenoviral suspension was injected into the right lateral ventricle at a rate of 0.3–0.5 µL/min. After the injection was completed, the needle was kept in place for 5 min to allow diffusion of the viral suspension and to reduce backflow. The needle was then withdrawn slowly over 2–3 min. The burr hole was sealed with sterile bone wax, and the scalp incision was closed with sutures. The animal was transferred to a warmed recovery cage and monitored until spontaneous movement and stable respiration were observed. After recovery from anesthesia, animals were returned to the home cages and monitored daily for general activity, body weight, wound condition, and signs of neurological or systemic distress. Permanent middle cerebral artery occlusion was performed 72 h after intracerebroventricular viral injection to allow sufficient time for miR-423-5p suppression before ischemic injury induction.
Permanent middle cerebral artery occlusion (pMCAO) procedure
Permanent focal cerebral ischemia was induced 72 h after intracerebroventricular adenoviral injection using the intraluminal filament method. Rats were anesthetized with 3–4% isoflurane for induction and maintained with 1.5–2% isoflurane in oxygen during surgery. Adequate anesthesia was confirmed by the absence of the pedal withdrawal reflex. The rat was placed in the supine position on a pre-warmed heating pad, and body temperature was maintained near 37 °C throughout the procedure. The ventral neck region was shaved and disinfected with alternating povidone-iodine and 75% ethanol, repeated three times.
A midline cervical incision was made to expose the right carotid artery system. The right common carotid artery, external carotid artery, and internal carotid artery were carefully separated from the surrounding connective tissue under a surgical microscope. The vagus nerve was gently separated from the carotid sheath and protected throughout the procedure. The distal external carotid artery was ligated, and the proximal common carotid artery and internal carotid artery were temporarily occluded with microvascular clips. A small arteriotomy was made on the external carotid artery stump, and a silicone-coated nylon monofilament was introduced through the external carotid artery into the internal carotid artery.
The filament was advanced slowly from the carotid bifurcation toward the origin of the middle cerebral artery. The insertion depth was maintained at approximately 18–20 mm from the carotid bifurcation. Advancement was stopped when mild resistance was felt, indicating that the filament tip had reached and occluded the origin of the middle cerebral artery. The filament was secured in place to maintain permanent occlusion, and the proximal vascular clip was removed after the filament position was stabilized. The wound was closed in layers, and the animal was transferred to a warm recovery cage. For Sham-operated animals, the same anesthesia, cervical incision, carotid artery exposure, and vessel separation procedures were performed, but the filament was not advanced to the middle cerebral artery occlusion site. After surgery, all animals were monitored until spontaneous respiration and movement returned. Animals were then returned to clean cages with free access to food and water. Animals were observed after surgery for general activity, respiration, wound condition, and neurological status.
Preset exclusion criteria were applied before data analysis. Animals were excluded if they died before the planned 24 h endpoint, showed no neurological deficit after pMCAO, exhibited signs of subarachnoid hemorrhage, or had technical failure during filament insertion. Animals with severe respiratory distress, uncontrolled bleeding, or inability to recover from anesthesia were euthanized according to the approved animal protocol.
Neurological deficit assessment
Neurological function was evaluated 24 h after permanent middle cerebral artery occlusion using the Zea Longa neurological deficit scoring system. Scoring was performed by an investigator blinded to group allocation and treatment information. Before scoring, each rat was placed individually in a clean open-field observation area and allowed to move freely for several minutes. General activity, posture, spontaneous movement, forelimb extension, circling behavior, response to lateral push, and consciousness level were then assessed.
Neurological deficits were graded on a 0–5 scale. A score of 0 indicated no observable neurological deficit. A score of 1 indicated failure to fully extend the contralateral forelimb when the rat was lifted by the tail. A score of 2 indicated spontaneous circling toward the contralateral side or reduced resistance to lateral push. A score of 3 indicated falling toward the contralateral side or severe circling with impaired postural control. A score of 4 indicated the absence of spontaneous walking or markedly depressed consciousness. A score of 5 indicated death before neurological evaluation. Higher scores indicated more severe neurological impairment. Animals were evaluated at the same postoperative time point to reduce variability related to recovery time. The scorer did not participate in viral injection, pMCAO surgery, tissue collection, or molecular analysis. After neurological assessment, surviving animals were returned to the home cages and maintained under standard conditions until tissue collection.
TTC staining and infarct volume measurement
At 24 h after permanent middle cerebral artery occlusion, rats were deeply anesthetized with isoflurane until the pedal withdrawal reflex disappeared. After neurological deficit assessment, the rats were euthanized according to the approved animal protocol, and the brains were rapidly removed. The brain surface was gently rinsed with cold phosphate-buffered saline to remove residual blood. Brains with obvious surface hemorrhage, mechanical damage during removal, or incomplete tissue integrity were excluded according to the preset criteria.
Each brain was placed on an ice-cold brain matrix and cooled for 5–10 min to improve tissue firmness before sectioning. Coronal brain slices were prepared at a 2 mm thickness from the frontal pole to the occipital pole. Slices from each animal were kept in anatomical order during staining and imaging. Fresh 2% 2,3,5-triphenyltetrazolium chloride solution was prepared in phosphate-buffered saline before use and protected from light. Brain slices were incubated in 2% 2,3,5-triphenyltetrazolium chloride solution at 37 °C for 15–20 min with gentle agitation. The slices were turned once during incubation to ensure even staining on both sides. After staining, viable brain tissue appeared red, whereas infarcted tissue remained pale or white. The stained slices were then fixed in 4% paraformaldehyde at room temperature until imaging. Both sides of each slice were photographed using the same camera, lighting conditions, and imaging distance for all samples. Infarct area was quantified using Image-Pro Plus or equivalent image analysis software by an investigator blinded to group allocation. For each slice, the contralateral hemispheric area, the ipsilateral non-infarct area, and the infarct area were measured. The edema-corrected infarct area was calculated using the indirect method:
Corrected Infarct Area = Contralateral hemispheric area - Infarct Ipsilateral hemisphere area (1)
Corrected infarct volume was calculated by summing the corrected infarct areas across all slices and multiplying by slice thickness. Infarct volume was expressed as a percentage of the total brain volume or contralateral hemispheric volume, according to the predefined analysis plan used for the study.
Western blot analysis
At 24 h after permanent middle cerebral artery occlusion, ischemic hemispheric brain tissue was collected on ice immediately after euthanasia. Tissue samples were rinsed briefly with cold phosphate-buffered saline to remove surface blood, blotted dry, placed into pre-chilled microcentrifuge tubes, and stored on ice during processing. All samples were processed using the same tissue collection and lysis procedure to reduce technical variability. The cellular source of the protein signal was not separated in this assay; therefore, Bax and Bcl-2 expression was interpreted as apoptosis-related protein expression in ischemic brain tissue rather than neuron-specific expression.
Homogenize each tissue sample in ice-cold RIPA lysis buffer supplemented with protease inhibitor cocktail. Use approximately 10 volumes of lysis buffer per gram of tissue. Keep samples on ice for 30 min and vortex briefly every 5–10 min to improve protein extraction. Clarify lysates by centrifugation at 12,000 × g for 15 min at 4 °C. Transfer the supernatant to a clean, pre-chilled tube, avoiding disturbance of the pellet. Determine protein concentration using a bicinchoninic acid protein assay according to the manufacturer’s instructions. Prepare all samples at the same final protein concentration using the loading buffer. Denature protein samples at 95 °C for 5 min and briefly centrifuge the tubes before loading. Load 30 µg of total protein per lane onto a 10–12% SDS-PAGE gel. Run electrophoresis until the dye front reaches the lower portion of the gel.
Transfer proteins from the gel to a PVDF membrane that has been pre-activated in methanol. Perform wet transfer under cold conditions to reduce overheating. After transfer, block the membrane in TBST containing 5% skim milk for 1 h at room temperature with gentle shaking. Incubate the membrane overnight at 4 °C with primary antibodies against Bax, Bcl-2, and β-actin diluted in blocking buffer. Use Bax and Bcl-2 antibodies at 1:1,000 and β-actin antibody at 1:5,000. β-actin was used as the internal loading control. Wash the membrane three times with TBST for 10 min each at room temperature. Incubate the membrane with HRP-conjugated secondary antibody diluted in blocking buffer for 1 h at room temperature. Use the secondary antibody at 1:5,000–1:10,000 according to the antibody datasheet and signal intensity. Wash the membrane three times with TBST for 10 min each after secondary antibody incubation.
Develop the membrane using an enhanced chemiluminescent reagent, then capture images with a chemiluminescent imaging system. Ensure that the exposure time is within the linear detection range and does not produce saturated bands. Quantify band intensity using Quantity One or equivalent image analysis software by an investigator blinded to group allocation. Normalize Bax and Bcl-2 band intensities to β-actin from the same sample. Present the normalized values relative to the Sham group. The expected molecular weights were approximately 21 kDa for Bax, 26 kDa for Bcl-2, and 42 kDa for β-actin.
Quantitative real-time PCR for miR-423-5p
At 24 h after permanent middle cerebral artery occlusion, ischemic hemispheric brain tissue was collected on ice and processed immediately for RNA extraction or stored at −80 °C until use. Total RNA, including small RNA fractions, was isolated using TRIzol reagent according to the manufacturer’s instructions. During extraction, all tubes, pipette tips, and working surfaces were kept RNase-free. The aqueous phase was carefully transferred after chloroform separation, and RNA was precipitated with isopropanol, washed with 75% ethanol, air-dried briefly, and dissolved in RNase-free water. Determine RNA concentration and purity using a spectrophotometer. Use RNA samples with an A260/A280 ratio of 1.8–2.1 for downstream reverse transcription. Assess RNA integrity by agarose gel electrophoresis or an equivalent quality-control method when sufficient RNA is available. Use the same total RNA amount for each sample during reverse transcription to reduce technical variability among groups.
Reverse-transcribe miRNAs into cDNA using a miRNA-specific reverse transcription kit. Prepare each reverse transcription reaction on ice, following the manufacturer’s protocol. For each sample, include total RNA, reverse transcription buffer, reverse transcriptase, RNase inhibitor, dNTPs, and miRNA-specific stem-loop reverse transcription primers for miR-423-5p and U6. Perform reverse transcription under the following conditions: 42 °C for 60 min and 85 °C for 5 min. Store the resulting cDNA at −20 °C until quantitative real-time polymerase chain reaction analysis. Perform quantitative real-time polymerase chain reaction using SYBR Green chemistry on an ABI 7500 Real-Time PCR platform. Prepare each reaction using cDNA template, SYBR Green qPCR master mix, forward and reverse primers, and nuclease-free water. Use miR-423-5p as the target miRNA and U6 small nuclear RNA as the endogenous reference. Run each biological sample in three technical replicates. Include no-template controls to monitor reagent contamination and non-specific amplification.
Run quantitative real-time polymerase chain reaction using the following amplification program: initial denaturation at 95 °C for 10 min, followed by 40 cycles of denaturation at 95 °C for 15 s and annealing/extension at 60 °C for 60 s. After amplification, perform melting-curve analysis to confirm amplification specificity. Exclude reactions with abnormal amplification curves, multiple melting peaks, or obvious technical failure before statistical analysis. Calculate threshold cycle values using the same threshold setting for all samples. Average the technical replicates for each biological sample. Calculate relative miR-423-5p expression using the 2(−ΔΔCt) method, with U6 as the endogenous reference and the Sham group as the calibrator. Present the results as fold changes relative to the Sham group. All RNA extraction reagents, reverse transcription kits, quantitative real-time polymerase chain reaction reagents, primer sources, and instruments are listed in the Table of Materials.
Bioinformatic prediction of the association between miR-423-5p and BAX
Bioinformatic prediction was performed to determine whether BAX is a candidate miR-423-5p-associated apoptosis-related gene. The mature rat miR-423-5p sequence was first confirmed as 5′-UGAGGGGCAGAGAGCGAGACUUUU-3′. Three commonly used microRNA target-prediction databases, miRWalk, TargetScan, and miRDB, were then searched using miR-423-5p and BAX as the query terms. The rat species setting was used when available. For each database, the prediction result was recorded as predicted or not predicted. When available, the predicted binding region, binding site, seed match, binding probability, and minimum free energy were also recorded. The prediction results were summarized in Table 1. In the present screening, miRWalk predicted a potential miR-423-5p binding site in the BAX 3′UTR at nucleotides 889–922, with seed matching, a binding probability of 0.923, and a predicted minimum free energy of −26.2 kcal/mol. This potential interaction was not predicted by TargetScan or miRDB.
Because the prediction was supported by only one of the three databases, BAX was interpreted as a potential miR-423-5p-associated apoptosis-related gene rather than a confirmed direct target. This computational analysis was used only to provide a candidate basis for interpreting the observed Bax/Bcl-2 protein changes. Direct molecular validation, including luciferase reporter assay, RNA pull-down assay, and rescue experiments, was not performed in this study.
Statistical analysis
Statistical analysis was performed using SPSS 23.0. Continuous variables are presented as mean ± SD. Normality was assessed using the Shapiro–Wilk test and homogeneity of variances using Levene’s test. When the relevant assumptions were satisfied, comparisons across groups were conducted using one-way analysis of variance (ANOVA), followed by Tukey’s post hoc test for multiple comparisons. Neurological deficit scores were evaluated with the nonparametric Kruskal–Wallis test, and pairwise differences were further examined using Dunn’s multiple comparisons procedure. Statistical significance was defined as a two-tailed p value < 0.05.
Results
Loading...
$$\rightleftharpoonup{xx}$$
$$\longleftharp{xx}$$,
$$\longrightharp{xx}$$,
Inhibition of miR-423-5p improves neurological outcomes and reduces cerebral infarct volume in rats subjected to permanent middle cerebral artery occlusion
Neurological function was assessed 24 h after permanent middle cerebral artery occlusion using the Zea Longa scoring system (Figure 1A). Sham-operated rats showed no detectable neurological deficits. Rats in the pMCAO and pMCAO + NC groups exhibited marked neurological impairment. The pMCAO + NC group showed a modest but statistically significant difference in neurological deficit score compared with the pMCAO group (p < 0.05), suggesting that adenoviral delivery or the control sequence had a limited effect on this behavioral readout. However, rats treated with the miR-423-5p-interfering adenovirus showed a further reduction in neurological deficit scores compared with both the pMCAO and pMCAO + NC groups, supporting an association between miR-423-5p inhibition and improved early neurological outcome.
Cerebral infarct volume was quantified by TTC staining 24 h after occlusion (Figure 1B). The pMCAO group showed an infarct volume of 26.787 ± 4.109%, whereas the pMCAO + NC group showed a comparable infarct volume of 25.490 ± 3.710%, indicating that the negative-control adenovirus did not materially reduce infarct size. In contrast, the miR-423-5p-interfering adenovirus group showed a markedly reduced infarct volume of 12.957 ± 3.236% (p < 0.05 vs. both pMCAO and pMCAO + NC). Representative TTC-stained coronal brain sections are shown in Figure 1C. Consistent with the quantitative analysis, the pale infarcted region was visibly smaller in the intervention group than in the pMCAO and pMCAO + NC groups.
Inhibition of miR-423-5p alters Bax and Bcl-2 protein expression in ischemic brain tissue after pMCAO
To evaluate apoptosis-related protein changes, Bax and Bcl-2 expression were examined by Western blotting (Figure 2A, B). Compared with the Sham group, the pMCAO group showed increased Bax expression and decreased Bcl-2 expression. Densitometric analysis showed that Bax expression increased from 1.001 ± 0.001 in the Sham group to 1.829 ± 0.059 in the pMCAO group (P < 0.05; Figure 2A). In contrast, Bcl-2 expression decreased from 1.011 ± 0.165 in the Sham group to 0.682 ± 0.061 in the pMCAO group (P < 0.05; Figure 2B).
Treatment with the miR-423-5p-interfering adenovirus was associated with partial reversal of these changes in apoptosis-related proteins. In the intervention group, Bax expression decreased to 0.986 ± 0.111, whereas Bcl-2 expression increased to 0.886 ± 0.051 (P < 0.05 vs. both pMCAO and pMCAO + NC). By contrast, the pMCAO + NC group remained similar to the pMCAO group, with Bax and Bcl-2 values of 1.859 ± 0.133 and 0.693 ± 0.066, respectively. These findings indicate that miR-423-5p inhibition was associated with altered Bax/Bcl-2 protein expression in ischemic brain tissue. Because the Western blot analysis was performed on ischemic hemispheric tissue, these results should be interpreted as tissue-level changes in apoptosis-related proteins rather than neuron-specific apoptosis measurements.
Bioinformatic prediction, miR-423-5p expression, and the proposed working model in cerebral infarction
Bioinformatic predictions were performed using miRWalk, TargetScan, and miRDB to determine whether BAX may be a candidate miR-423-5p-associated apoptosis-related gene. As summarized in Table 1, miRWalk predicted a potential miR-423-5p binding site within the BAX 3′UTR at nucleotides 889–922. This predicted site showed seed matching, a binding probability of 0.923, and a predicted minimum free energy of −26.2 kcal/mol. However, the same interaction was not predicted by TargetScan or miRDB in the present screening. Therefore, BAX was interpreted as a potential miR-423-5p-associated apoptosis-related gene rather than a confirmed direct target.
Relative miR-423-5p expression in brain tissue was measured by quantitative real-time polymerase chain reaction (Figure 3A). Compared with the Sham group, miR-423-5p expression increased after pMCAO, reaching 1.310 ± 0.144-fold in the pMCAO group. The pMCAO + NC group showed a similarly elevated level of 1.245 ± 0.233-fold, indicating that the negative-control adenovirus did not materially affect miR-423-5p expression. In contrast, treatment with the miR-423-5p-interfering adenovirus reduced miR-423-5p expression to 0.404 ± 0.168-fold (P < 0.05 vs. both pMCAO and pMCAO + NC), supporting effective in vivo suppression of miR-423-5p.
Based on the observed changes in miR-423-5p expression, infarct severity, and Bax/Bcl-2 protein expression, a schematic working model is presented in Figure 3B. This model summarizes current in vivo findings and proposes that cerebral ischemia is associated with increased miR-423-5p expression and an imbalance between proapoptotic Bax/Bcl-2, whereas miR-423-5p inhibition is associated with improved neurological outcomes, reduced infarct volume, decreased Bax expression, and increased Bcl-2 expression. This schematic is intended as a hypothesis-generating model and does not establish direct molecular targeting or definitive inhibition of neuronal apoptosis.
DATA AVAILABILITY:
All raw data supporting the findings of this study are included in this article
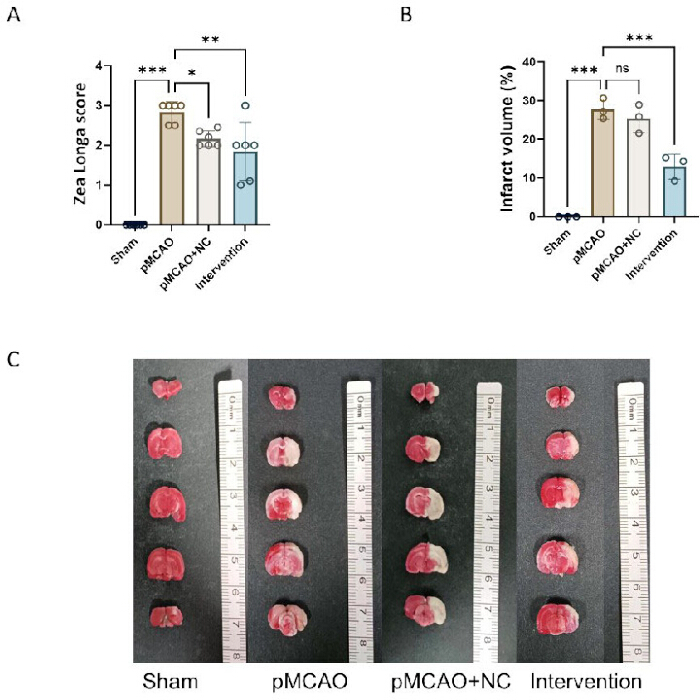
Figure 1: Inhibition of miR-423-5p improves neurological outcomes and reduces cerebral infarct volume in rats subjected to permanent middle cerebral artery occlusion (pMCAO). (A) Zea Longa's neurological deficit scores were assessed 24 h after permanent middle cerebral artery occlusion. Each dot represents one animal (n = 6 per group). Group differences were analyzed using the Kruskal-Wallis test followed by Dunn’s multiple-comparison test. (B) Quantification of cerebral infarct volume determined by 2,3,5-triphenyltetrazolium chloride staining and expressed as a percentage of total brain volume. Data are presented as mean ± SD. (C) Representative 2,3,5-triphenyltetrazolium chloride-stained coronal brain sections from the Sham, pMCAO, pMCAO + NC, and miR-423-5p-interfering adenovirus groups. Viable tissue is stained red, whereas infarcted tissue remains unstained and appears pale or white. Statistical significance is indicated on the graphs: ns, not significant; p < 0.05; p < 0.01; p < 0.001. Please click here to view a larger version of this figure.
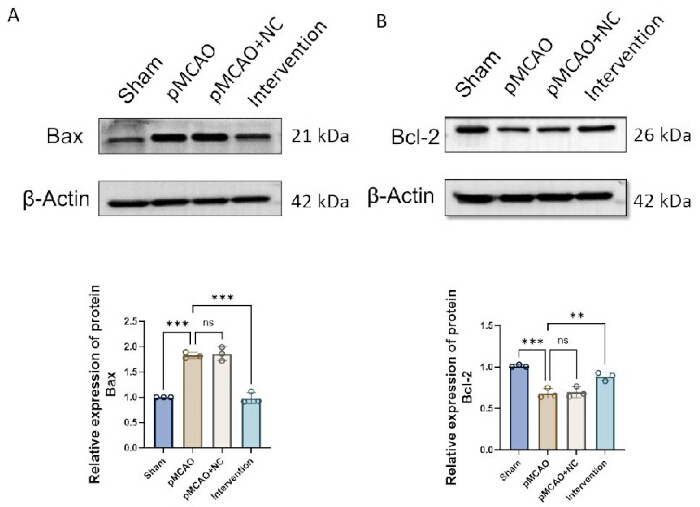
Figure 2: Inhibition of miR-423-5p alters Bax and Bcl-2 protein expression in ischemic brain tissue after pMCAO. (A) Representative Western blot images and densitometric quantification of Bax protein expression normalized to β-actin. (B) Representative Western blot images and densitometric quantification of Bcl-2 protein expression normalized to β-actin. Data are presented as mean ± SD. Statistical significance is indicated on the graphs: ns, not significant; p < 0.05; p < 0.01; p < 0.001. The Western blot results represent tissue-level apoptosis-related protein changes and do not establish neuron-specific apoptosis. Please click here to view a larger version of this figure.
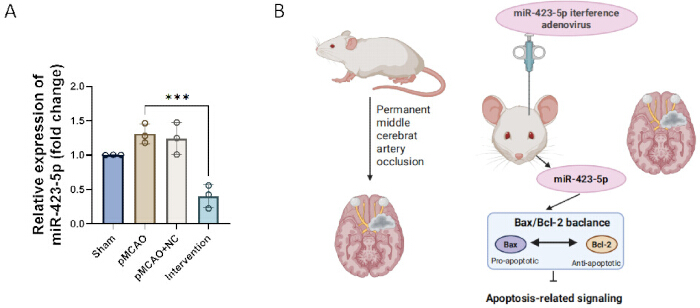
Figure 3: miR-423-5p expression and the proposed working model in cerebral infarction. (A) Relative miR-423-5p expression in brain tissue was measured by quantitative real-time polymerase chain reaction and calculated using the 2-ΔΔCt method with U6 as the endogenous reference and the Sham group as the calibrator. Data are presented as mean ± SD. Statistical annotations are indicated on the graph: ns, not significant; p < 0.001. (B) Schematic illustration of the proposed working model based on the present in vivo findings. Cerebral ischemia was associated with increased miR-423-5p expression and altered Bax/Bcl-2 protein expression. Inhibition of miR-423-5p was associated with improved neurological outcomes, reduced infarct volume, decreased Bax expression, and increased Bcl-2 expression. This schematic is hypothesis-generating and does not demonstrate direct molecular targeting of BAX by miR-423-5p or definitive inhibition of neuronal apoptosis. Figure 3B is created by the authors in Biorender, and a proper publication license is provided. Please click here to view a larger version of this figure.
| Gene | miRNA | Database | Prediction result | Predicted binding region | Binding site | Seed match | Binding probability | Minimum free energy |
| BAX | miR-423-5p | miRWalk | Predicted | 3′UTR | nt 889–922 | Yes | 0.923 | −26.2 kcal/mol |
| BAX | miR-423-5p | TargetScan | Not predicted | — | — | — | — | — |
| BAX | miR-423-5p | miRDB | Not predicted | — | — | — | — | — |
Table 1: Bioinformatic prediction of the potential association between miR-423-5p and BAX. Bioinformatic prediction was performed using miRWalk, TargetScan, and miRDB. miRWalk predicted a potential miR-423-5p binding site within the BAX 3′UTR at nucleotides 889–922, with seed matching, a binding probability of 0.923, and a predicted minimum free energy of −26.2 kcal/mol. TargetScan and miRDB did not predict this interaction in the present screening. Therefore, BAX was interpreted as a potential miR-423-5p-associated apoptosis-related gene rather than a confirmed direct target. Abbreviations; 3’ UTR = 3′ untranslated region; MFE = minimum free energy, not available or not predicted.
Discussion
Loading...
$$\rightleftharpoonup{xx}$$
$$\longleftharp{xx}$$,
$$\longrightharp{xx}$$,
This study evaluated the association between miR-423-5p inhibition and early ischemic injury in a rat model of permanent middle cerebral artery occlusion. Intracerebroventricular delivery of a miR-423-5p-interfering adenovirus reduced miR-423-5p abundance in ischemic brain tissue, improved neurological deficit scores, and decreased infarct volume 24 h after ischemic injury. The intervention was also associated with lower Bax expression and higher Bcl-2 expression in ischemic hemispheric tissue. Together, these findings suggest that miR-423-5p inhibition is associated with reduced early injury severity and altered apoptosis-related protein expression after permanent cerebral ischemia. However, because the present study did not include direct apoptosis assays or direct target-validation experiments, these findings should be interpreted as preliminary in vivo associations rather than definitive evidence of a direct molecular mechanism.
The intraluminal filament model of middle cerebral artery occlusion has been widely used to study focal cerebral ischemia and neurological deficits in rodents13,14. In the present study, permanent occlusion was selected to model sustained focal ischemic injury rather than transient ischemia followed by reperfusion. This distinction is important because molecular responses may differ between permanent ischemia and transient ischemia/reperfusion models. At 24 h after pMCAO, the untreated pMCAO group showed clear neurological deficits and infarct formation, whereas miR-423-5p inhibition was associated with lower Zea Longa scores and smaller infarct volume. These findings support an early protective association in this experimental setting, but they do not establish whether the effect persists at later time points or translates into long-term functional recovery.
Secondary injury in vulnerable ischemic tissue involves multiple processes, including oxidative stress, inflammation, mitochondrial dysfunction, and apoptosis-related signaling2,3,4. The Bax/Bcl-2 axis was examined because it is a central apoptosis-related molecular system in ischemic injury. Bax promotes mitochondrial apoptotic progression, whereas Bcl-2 supports cell survival, and the relative Bax/Bcl-2 balance is commonly used as an indicator of apoptosis-related signaling5,6. Previous studies have shown that increasing Bcl-2 expression can reduce ischemia-associated neuronal injury and infarct damage in experimental stroke models15,16,17. These reports support the biological relevance of Bcl-2 family proteins in cerebral ischemic injury. In the present study, pMCAO increased Bax expression and decreased Bcl-2 expression in ischemic brain tissue, whereas miR-423-5p inhibition partially reversed these changes. Nevertheless, Western blotting was performed using ischemic hemispheric tissue and did not distinguish neurons from glial, endothelial, or inflammatory cells. Therefore, the Bax and Bcl-2 data should be interpreted as tissue-level changes in apoptosis-related proteins rather than as direct evidence of reduced neuronal apoptosis.
MicroRNAs have emerged as important regulators and biomarkers in ischemic stroke biology. Brain and blood microRNA profiling studies have shown that ischemic stroke is accompanied by broad changes in microRNA expression18. MicroRNA-focused reviews further support the importance of microRNAs in ischemic stroke pathophysiology, biomarker discovery, and experimental therapeutic research19. Other experimental stroke studies have linked specific microRNAs to inflammatory signaling, vascular responses, and neuroprotection after cerebral ischemia20. These findings provide a rationale for studying microRNA-mediated regulation in stroke models. However, microRNA effects are often context-dependent because each microRNA may regulate multiple transcripts, and each transcript may be influenced by multiple microRNAs. Therefore, the present findings should not be interpreted as evidence of a single linear miR-423-5p–BAX pathway without direct target validation.
Previous work has specifically implicated miR-423-5p in ischemic and apoptosis-related injury contexts. Circulating microRNA profiling identified miR-423-5p as a candidate blood-based biomarker associated with acute ischemic stroke11. In an experimental cerebral ischemia/reperfusion model, miR-423-5p inhibition was reported to reduce ischemic injury-related outcomes and was linked to reduced NLRP3 inflammasome activation12. Outside the brain, miR-423-5p inhibition has also been associated with reduced cardiomyocyte apoptosis and mitochondrial dysfunction under hypoxia/reoxygenation conditions21, and miR-423-5p knockdown has been reported to alter proliferation and apoptosis-related readouts in tumor cells, including changes in Bcl-2 expression22. These studies support the broader relevance of miR-423-5p to stress-response and apoptosis-related biology, but they also show that its downstream mechanisms may vary across tissues and disease models.
The bioinformatic prediction analysis provided a limited candidate basis for discussing BAX as a potential miR-423-5p-associated apoptosis-related gene. In the present screening, miRWalk predicted a potential miR-423-5p binding site in the BAX 3′UTR at nucleotides 889–922, with seed matching, a binding probability of 0.923, and a predicted minimum free energy of −26.2 kcal/mol. However, TargetScan and miRDB did not predict the same interaction. This inconsistency among prediction databases indicates that BAX should be considered only a potential computational candidate, not a confirmed direct target. Because luciferase reporter assay, RNA pull-down assay, and rescue experiments were not performed, the observed changes in Bax/Bcl-2 expression cannot establish direct regulation of BAX by miR-423-5p. Future studies should test the predicted BAX 3′UTR site using wild-type and mutant 3′UTR luciferase reporter assays and should include rescue experiments to determine whether restoring or suppressing Bax expression modifies the effect of miR-423-5p inhibition.
The present study has several limitations. First, direct apoptosis assays, including TUNEL staining, cleaved caspase-3 detection, and NeuN/TUNEL double labeling, were not performed. Therefore, the study cannot definitively conclude that miR-423-5p inhibition reduced neuronal apoptosis. Second, the cellular source of Bax and Bcl-2 changes was not defined because Western blotting was performed on ischemic hemispheric tissue. Third, direct target-validation experiments were not performed; therefore, BAX remains a computationally predicted candidate rather than an experimentally validated miR-423-5p target. Fourth, the study used a single early time point and a relatively small animal sample size. Fifth, histopathological evidence beyond TTC staining was not included, and HE, Nissl, TUNEL, or immunofluorescence staining would be needed to better connect infarct reduction with cellular injury and apoptosis-related changes. Finally, because archived tissue was not suitable for additional staining or target validation experiments, the present revision focused on strengthening methodological transparency, adding bioinformatic predictions, and revising the interpretation to avoid overstatement.
In conclusion, inhibition of miR-423-5p was associated with improved neurological scores, reduced infarct volume, decreased miR-423-5p abundance, and altered Bax/Bcl-2 protein expression in a rat pMCAO model. Bioinformatic prediction suggested a possible miR-423-5p binding site in the BAX 3′UTR in miRWalk, but this finding was not supported by TargetScan or miRDB and was not experimentally validated. Therefore, this study supports a preliminary association between miR-423-5p inhibition and reduced early ischemic injury, while further studies using direct apoptosis assays, luciferase reporter assays, RNA pull-down assays, and rescue experiments are required to define the underlying mechanism.
Disclosures
Loading...
$$\rightleftharpoonup{xx}$$
$$\longleftharp{xx}$$,
$$\longrightharp{xx}$$,
The authors have no conflicts of interest to declare.
Acknowledgements
Loading...
$$\rightleftharpoonup{xx}$$
$$\longleftharp{xx}$$,
$$\longrightharp{xx}$$,
This work was supported by the Natural Science Foundation Project of Xinjiang Uygur Autonomous Region (No. 2022D01A07) and the Fujian Provincial Health Science and Technology Plan Medical Innovation Project (Category A) (No. 2024CXA003).
Materials
| Name | Company | Catalog Number | Comments |
|---|---|---|---|
| 10% SDS-PAGE gel preparation kit | Beijing Solarbio Science & Technology Co., Ltd. | P1203 | For preparation of 10% SDS-PAGE gels for Western blotting. |
| 12% SDS-PAGE gel preparation kit | Beijing Solarbio Science & Technology Co., Ltd. | P1224 | For preparation of 12% SDS-PAGE gels for Western blotting. |
| 2,3,5-Triphenyltetrazolium chloride staining solution (TTC, 2%) | Beijing Solarbio Science & Technology Co., Ltd. | G3005 | For TTC staining of coronal brain sections; prepare/use protected from light; 37 °C for 15–20 min. |
| 75% ethanol | Sinopharm Chemical Reagent Co., Ltd. | 10009218 | Used for alternating surgical-area disinfection with povidone-iodine. |
| ABI 7500 Real-Time PCR System | Applied Biosystems, Thermo Fisher Scientific | 4351105 | Instrument used for quantitative real-time PCR. |
| Adult male Sprague-Dawley rats, SPF, 280–350 g | Jinan Pengyue Laboratory Animal Breeding Co., Ltd. | SCXK (Lu) 2019-0003 | Experimental animals used for the pMCAO model. |
| Anti-Bax primary antibody | Proteintech Group, Inc. | 50599-2-Ig | Western blot; use at 1:1,000 in this protocol. |
| Anti-Bcl-2 primary antibody | Proteintech Group, Inc. | 60178-1-Ig | Western blot; use at 1:1,000 in this protocol. |
| BCA protein assay kit | Elabscience Biotechnology Inc. | E-BC-K318-M | For determination of total protein concentration before Western blotting. |
| Brain matrix, rat, coronal, 1 mm | Shenzhen RWD Life Science Co., Ltd. | 68711 | Used to prepare coronal brain slices; appropriate for rats around 300–600 g. |
| ChemiDoc MP Imaging System | Bio-Rad Laboratories, Inc. | 17001402 | Chemiluminescence imaging system for Western blot detection. |
| Enhanced chemiluminescence substrate | Thermo Fisher Scientific | 34580 | HRP chemiluminescent substrate for Western blot signal development. |
| Hamilton microsyringe, 10 µL | Hamilton Company | 80300 | For stereotactic intracerebroventricular adenovirus injection. |
| HRP-conjugated goat anti-mouse IgG secondary antibody | Servicebio Technology Co., Ltd. | GB23301 | Western blot secondary antibody; use at 1:5,000–1:10,000 according to signal intensity. |
| HRP-conjugated goat anti-rabbit IgG secondary antibody | Servicebio Technology Co., Ltd. | GB23303 | Western blot secondary antibody; use at 1:5,000–1:10,000 according to signal intensity. |
| Image-Pro Plus software | Media Cybernetics, Inc. | Version 6.0 | Used for infarct-area and infarct-volume quantification. |
| Isoflurane | Shenzhen RWD Life Science Co., Ltd. | R510-22-8 | Inhalation anesthetic; 3%–4% induction and 1.5%–2% maintenance in oxygen. |
| miR-423-5p and U6 quantitative PCR primers | General Biological Systems (Anhui) Co., Ltd. | https://www.generalbiol.com/ | Sequence-specific primers used for miR-423-5p and U6 qPCR. |
| miR-423-5p-interfering adenovirus | Hanheng Biotechnology Co., Ltd. | https://www.hanbio.net/en | Replication-deficient E1/E3-deleted adenoviral vector; U6-driven antisense sequence 5′-AAAAGTCTCGCTCTCTGCCCCTCA-3′; CMV-EGFP reporter; working titer 1.0 × 10^10 PFU/mL. |
| miRDB database | miRDB | https://mirdb.org/ | Used for bioinformatic prediction of candidate miRNA-target associations. |
| miRNA 1st strand cDNA synthesis kit | Vazyme Biotech Co., Ltd. | MR201-01 | For reverse transcription of miRNAs before qPCR. |
| miRWalk database | miRWalk | http://mirwalk.umm.uni-heidelberg.de/ | Used for bioinformatic prediction of miR-423-5p binding to BAX 3′UTR. |
| Negative-control adenovirus | Hanheng Biotechnology Co., Ltd. | https://www.hanbio.net/en | Replication-deficient adenoviral vector carrying scrambled non-targeting sequence 5′-TTCTCCGAACGTGTCACGT-3′; same backbone/reporter/titer as intervention virus. |
| Ophthalmic ointment | Alcon Laboratories, Inc. | Systane Lubricant Eye Ointment | Applied after anesthesia induction to prevent corneal drying. |
| Oxygen supply | Local certified supplier | Medical-grade oxygen | Carrier gas for isoflurane induction and maintenance. |
| Paraformaldehyde solution, 4% | Beijing Solarbio Science & Technology Co., Ltd. | P1110 | For fixation of TTC-stained brain sections. |
| Phosphate-buffered saline (PBS), 1x, pH 7.2–7.4 | Beijing Solarbio Science & Technology Co., Ltd. | P1020 | Used for tissue rinsing and TTC solution preparation. |
| Povidone-iodine disinfectant | Beijing Solarbio Science & Technology Co., Ltd. | P8150 | Used for alternating skin/scalp disinfection before stereotactic injection and pMCAO surgery. |
| Protease inhibitor cocktail | Applygen Technologies Inc. | P1265 | Added to RIPA lysis buffer for protein extraction. |
| PVDF membrane | Millipore, Merck KGaA | IPVH00010 | Protein transfer membrane for Western blotting. |
| Quantity One software | Bio-Rad Laboratories, Inc. | 170-8601 | Used for Western blot densitometric analysis. |
| RIPA lysis buffer | Applygen Technologies Inc. | C1053 | For extraction of total protein from ischemic hemispheric brain tissue. |
| Silicone-coated MCAO monofilament suture | Beijing Cinontech Co., Ltd. | 2636A4 | Used for intraluminal-filament pMCAO; insertion depth approximately 18–20 mm from the carotid bifurcation. |
| Skim milk powder | Beijing Solarbio Science & Technology Co., Ltd. | D8340 | Prepared as 5% skim milk in TBST for Western blot membrane blocking. |
| Small animal anesthesia machine | Shenzhen RWD Life Science Co., Ltd. | R500IE | For isoflurane anesthesia induction/maintenance in oxygen. |
| SPSS Statistics software | IBM Corp. | Version 23.0 | Used for statistical analysis. |
| Stereotaxic apparatus, rat | Shenzhen RWD Life Science Co., Ltd. | 68001 | Used for intracerebroventricular adenovirus injection. |
| Sterile bone wax | Ethicon, Johnson & Johnson | W31G | Used to seal the burr hole after intracerebroventricular injection. |
| Surgical microscope | Suzhou Kangjie Medical Inc. | XTS-4A | Used for carotid artery exposure and separation during pMCAO surgery. |
| Surgical sutures | Ethicon, Johnson & Johnson | W1614 | Used for skin/incision closure after stereotactic injection and pMCAO surgery. |
| SYBR Green qPCR master mix | Vazyme Biotech Co., Ltd. | Q711-02 | SYBR Green chemistry used for quantitative real-time PCR. |
| TargetScan database | TargetScan | https://www.targetscan.org/ | Used for bioinformatic prediction of candidate miRNA-target associations. |
| TBST buffer | Beijing Solarbio Science & Technology Co., Ltd. | P1033 | Used for Western blot washing and antibody incubation buffer preparation. |
| Temperature-controlled heating pad | Shenzhen RWD Life Science Co., Ltd. | 69023 | Used to maintain body temperature near 37 °C during anesthesia, surgery, and early recovery. |
| TRIzol-like reagent | CWBIO, Jiangsu CoWin Biotech Co., Ltd. | CW0580S | Used to isolate total RNA, including small RNAs, from ischemic brain tissue. |
| Tween-20 | Beijing Solarbio Science & Technology Co., Ltd. | T8220 | Component of TBST for Western blot washing. |
| β-actin primary antibody | TransGen Biotech Co., Ltd. | HC201-01 | Western blot loading control; use at 1:5,000 in this protocol. |
Reprints and Permissions
Request permission to reuse the text or figures of this JoVE article
Request Permission