This randomized trial compared opioid-sparing multimodal analgesia with conventional opioid analgesia in 130 patients undergoing laparoscopic radical gastrectomy. Gastrointestinal recovery, cine-MRI motility measurements, pain outcomes, and opioid consumption were compared between groups.
Research Article
Opioid-Sparing Analgesia After Laparoscopic Gastrectomy: Exploratory Clinical Outcomes and Cine-MRI Assessment of Small-Bowel Motility
In This Article
Summary
Abstract
This prospective randomized controlled trial compared opioid-sparing multimodal analgesia with conventional opioid analgesia in 130 patients undergoing laparoscopic radical gastrectomy, with 65 patients allocated to each group. Gastrointestinal motility was assessed using cine-MRI at 24, 48, and 72 h after surgery. Postoperative ileus (POI) occurred in 6/65 patients (9.2%) in the opioid-sparing group and 17/65 (26.2%) in the conventional group. The between-group comparison yielded a two-sided Fisher exact p = 0.0201, an unadjusted risk ratio of 0.35 (95% CI, 0.15–0.84), and a risk difference of −16.9 percentage points. Cine magnetic resonance imaging (Cine-MRI) contraction frequency, contraction amplitude, and motility scores were higher in the opioid-sparing group across postoperative assessments. The opioid-sparing group also had lower opioid exposure and pain scores and shorter gastrointestinal recovery times. These findings support the use of multimodal opioid-sparing analgesia as a perioperative strategy after laparoscopic gastrectomy and demonstrate the potential value of cine-MRI for dynamic assessment of postoperative gastrointestinal motility.
Introduction
Postoperative ileus (POI) describes impaired gastrointestinal recovery after surgery, but its operational definition and assessment window vary across studies1,2. Surgical stress, inflammation, autonomic pathways, and perioperative medications contribute to its multifactorial pathophysiology3,4. Peripheral µ-opioid receptor activation can suppress intestinal propulsion, providing a rationale for reducing opioid exposure while maintaining adequate analgesia. A clinical diagnosis must nevertheless be distinguished from individual recovery milestones and from imaging measurements of bowel motion.
Enhanced recovery after gastrectomy integrates analgesia with nutrition, mobilization, and other perioperative measures5. A randomized trial of a multimodal pathway after totally laparoscopic distal gastrectomy reported faster functional recovery, although the contribution of each component could not be separated6. Across surgical specialties, the TASMAN prospective cohort found no greater satisfaction with pain relief associated with opioid prescribing at discharge; the observational design limits causal inference7. A urological review also supports procedure-specific multimodal approaches8. Opioid sparing should not be equated with mandatory opioid elimination. The POFA trial of dexmedetomidine-based opioid-free intraoperative anesthesia was stopped after severe bradycardia events and did not demonstrate a gastrointestinal recovery advantage9. A systematic review found less postoperative nausea and vomiting with opioid-free anesthesia, but no clinically important analgesic benefit, and uncertainty about safety10.
Gastrectomy-specific randomized trials have evaluated catheter-based subcostal transversus abdominis plane analgesia, single-shot subcostal blocks, and intertransverse process blocks11,12,13. These techniques differ in anatomical targets and administration schedules; abdominal wall blocks primarily address somatic pain and constitute one component of multimodal analgesia14. Clinical milestones such as flatus and oral intake provide practical indicators of recovery but do not directly quantify bowel wall motion. Cine-MRI offers dynamic assessment without ionizing radiation. Previous studies have described quantitative small-bowel measurements, motion-registration methods, observer variability, and postoperative small-bowel imaging15,16,17,18, supporting its further application to postoperative gastrointestinal motility assessment.
This trial compared opioid-sparing multimodal analgesia with conventional opioid analgesia after laparoscopic radical gastrectomy. The primary objective was to compare the reported incidence of POI. Secondary objectives were to compare serial cine-MRI motility measures, pain, opioid consumption, and clinical recovery. Imaging outcomes were considered complementary measures of gastrointestinal recovery rather than a validated diagnostic test for POI.
Protocol
The study protocol was approved by the Clinical Research Ethics Committee of Guangdong Medical University Affiliated Hospital (approval number: PJKT2025-316; approval date: December 10, 2023). Written informed consent was obtained from all participants before study procedures were performed. After ethics approval was obtained, patients scheduled for elective laparoscopic radical gastrectomy were screened for eligibility between December 2023 and December 2025.
Study design
A two-group, parallel randomized comparison of opioid-sparing multimodal analgesia and conventional opioid analgesia was conducted in patients undergoing laparoscopic radical gastrectomy. The study schedule is shown in Figure 1, and the eligibility, allocation, treatment, and follow-up procedures are documented in Figure 2.
Gastrointestinal motility was assessed at 24, 48, and 72 h after surgery. Clinical recovery and analgesic outcomes were recorded at the prespecified assessment time points. Figure 1 summarizes the intervention components and assessment schedule.
Participants and sample size
Inclusion criteria were age 18–75 years, American Society of Anesthesiologists (ASA) physical status I–III, pathologically diagnosed gastric cancer without distant metastasis, planned laparoscopic radical gastrectomy, ability to provide informed consent, and suitability for MRI.
The stated exclusion criteria were applied, including previous intestinal obstruction or intestinal surgery, MRI contraindications, long-term opioid use or dependence, severe hepatic or renal impairment (Child–Pugh class C or creatinine clearance <30 mL/min), severe cardiopulmonary disease, psychiatric conditions preventing participation, inability to complete follow-up or MRI, and pregnancy or breastfeeding.
The planned sample size was determined before study initiation based on the expected difference in the primary outcome between the two groups. PASS software (version 15, NCSS, LLC, USA) was used for the initial sample size estimate. However, the original input parameters, assumptions, and effect-size estimates used for this calculation were not available for independent verification. Therefore, the final recruitment target was set at 130 participants, with 65 participants allocated to each group. All randomized participants were included in the intention-to-treat analysis.
Randomization and masking
An independent statistician generated the random allocation sequence, and group assignments were placed in opaque sealed envelopes. Envelopes were opened after eligibility confirmation and enrollment procedures were completed. Because the analgesic interventions involved different routes of administration, anesthesiologists and surgeons responsible for perioperative management were not blinded to group allocation. Outcome assessors, cine-MRI readers, and data analysts were blinded to group assignment. Outcome assessments were performed by personnel who were not involved in treatment allocation
Anesthesia and analgesia
The conventional group received patient-controlled intravenous analgesia (PCIA) containing sufentanil (2 µg/mL) according to the institutional postoperative analgesia protocol. The PCIA settings were as follows: background infusion rate of 2 mL/h, bolus dose of 2 mL, lockout interval of 15 min, and a maximum dose limit of 20 mL over 4 h. Nonsteroidal anti-inflammatory drugs (parecoxib 40 mg intravenously every 12 h) were administered as rescue analgesics when predefined criteria were met.
The opioid-sparing group received ultrasound-guided bilateral transversus abdominis plane blocks and rectus sheath blocks using 0.2% ropivacaine (20 mL per side for the transversus abdominis plane block and 10 mL per side for the rectus sheath block; total dose 120 mg) combined with dexamethasone (5 mg). Postoperative analgesia included continuous infusion of a multimodal analgesic solution (e.g., lidocaine 1 mg/kg/h and/or other institutional standard components) at 2 mL/h, intravenous dexmedetomidine (a loading dose of 0.5 µg/kg followed by an infusion rate of 0.2 µg/kg/h for 24 h), and intravenous acetaminophen (1 g every 8 h).
Cine-MRI acquisition and analysis
Cine-MRI was performed on a 3.0 T scanner at 24, 48, and 72 h after surgery. A two-dimensional balanced steady-state free-precession sequence was used with repetition time 3.4 ms, echo time 1.2 ms, flip angle 75°, slice thickness 8–10 mm, matrix 256 x 256, field of view 400–450 mm, and temporal resolution 0.3 s/frame. Three 30 s acquisitions were obtained with respiratory gating. Patients fasted for 6 h before each cine-MRI examination and received an oral bowel-distension preparation consisting of 1 L polyethylene glycol solution (macrogol 4000 formulation) approximately 60 min before imaging acquisition.
Two independent readers, blinded to group allocation, used semi-automated cine-MRI analysis software (MATLAB-based in-house software, version R2023a) to analyze representative jejunal and ileal segments. For each patient, representative jejunal segment(s) and representative ileal segment(s) were analyzed, with each segment measuring approximately 5 cm in length. Jejunal and ileal segments were selected based on clear visualization of the bowel wall, adequate luminal distension, and absence of severe motion artifacts or overlapping bowel loops. Representative segments were defined as bowel segments that were continuously visualized throughout the cine-MRI acquisition period and exhibited sufficient peristaltic activity for quantitative assessment. Measurements included contraction frequency, contraction amplitude, and motility grade. Motility grade was assigned using a three-level ordinal scale: 1, no peristalsis; 2, weak peristalsis; and 3, normal peristalsis. Contraction frequency was calculated as the number of visible bowel contractions divided by the observation duration and expressed as contractions per minute. Contraction amplitude was calculated as the maximal change in bowel diameter between the contracted and relaxed states during the cine-MRI acquisition and was expressed in millimeters. The measurements from the two readers were averaged for analysis.
Outcomes and postoperative management
POI was designated as the primary outcome and was assessed during the first 7 postoperative days. Two independent clinicians who were blinded to treatment allocation diagnosed POI on the basis of clinically significant delayed gastrointestinal recovery, characterized by one or more of the following: persistent intolerance of oral intake; nausea or vomiting requiring clinical intervention; inadequate recovery of bowel function; or other clinically significant gastrointestinal dysfunction requiring additional management. The I-FEED score was used as a standardized measure of postoperative gastrointestinal function, with scores of 0–2 indicating normal gastrointestinal function, 3–5 indicating postoperative gastrointestinal intolerance, and ≥6 indicating postoperative gastrointestinal dysfunction. The I-FEED score was not used as a standalone diagnostic threshold for POI19.
Outcome assessors were trained and masked to group assignment. Pain and quality-of-recovery assessments were collected by interview, and cine-MRI examinations were interpreted by masked readers. Postoperative management included routine clinical monitoring, analgesia, antiemetic treatment, nutritional support, fluid and electrolyte management, and escalation of care when clinically indicated. Rescue analgesia was administered when postoperative pain was inadequately controlled despite the assigned analgesic regimen. Rescue antiemetic treatment was administered for clinically significant nausea or vomiting requiring treatment. Numerical rating scale (NRS) pain was assessed at predefined postoperative time points, and Quality of Recovery-15 (QoR-15) was used to evaluate postoperative recovery quality20,21,22.
Statistical analysis
Statistical analyses were performed using SPSS version 26.0. Continuous variables were assessed for distributional characteristics and summarized as mean ± standard deviation or median (interquartile range), as appropriate. Between-group comparisons used independent-samples t tests or Mann–Whitney U tests. Categorical variables were compared using χ2 tests or two-sided Fisher's exact tests. Longitudinal outcomes measured at multiple postoperative time points were analyzed using a two-way repeated-measures analysis of variance (ANOVA), with postoperative time as the within-subjects factor and treatment group as the between-subjects factor. The group-by-time interaction was evaluated to determine whether changes over time differed between groups. The assumption of sphericity was assessed using Mauchly’s test, and the Greenhouse–Geisser correction was applied when the assumption was violated. Post hoc pairwise comparisons were performed with Bonferroni adjustment for multiple comparisons. Binary outcomes are presented with risk estimates and 95% confidence intervals where appropriate. All tests were two-sided, with p < 0.05 considered statistically significant. Opioid doses were converted to morphine milligram equivalents (MME) using published equianalgesic conversion guidelines23. Sufentanil doses were converted using the conversion factor of 1 µg sufentanil = 10 mg intravenous morphine equivalents. The same conversion approach was applied consistently for all participants.
For the reported analysis, sufentanil was converted using the stated conversion factor of 1 µg sufentanil = 10 mg intravenous morphine equivalents, and total MME was calculated from the administered sufentanil dose using this factor.

Results
Participant flow
The target sample size was determined before study initiation based on the planned comparison of the primary outcome between the two groups. Sample-size estimation was performed using PASS software (version 15, NCSS, LLC, USA). However, the original input parameters and assumptions used for the calculation could not be independently verified from the available study records. Therefore, the final sample size was retained as the prespecified recruitment target, and the uncertainty regarding the reproducibility of the original sample-size calculation is acknowledged as a limitation. A total of 130 patients were randomized, with 65 allocated to each group. The flow chart reports that all allocated patients received the intervention and were included in the intention-to-treat analysis, with no losses to follow-up.
Baseline characteristics
Baseline and perioperative characteristics are summarized in Table 1. In the opioid-sparing and conventional groups, respectively, mean age was 59.3 ± 8.7 and 60.1 ± 9.2 years, the proportion of men was 64.6% and 61.5%, and mean body mass index was 22.4 ± 3.1 and 22.7 ± 2.9 kg/m2.
ASA physical status, tumor stage, comorbidities, hemoglobin, surgical duration, blood loss, and lymph-node yield are described in Table 1. Baseline characteristics are presented descriptively; no baseline significance tests are used to claim equivalence or rule out confounding.
Primary outcome: incidence of postoperative ileus (POI)
POI occurred in 6/65 patients (9.2%) in the opioid-sparing group and 17/65 patients (26.2%) in the conventional group (Table 2). POI cases were identified according to the prespecified diagnostic criteria described in the protocol section. The between-group comparison yielded a two-sided Fisher exact p = 0.0201, an unadjusted risk ratio of 0.35 (95% CI, 0.15–0.84), and a risk difference of −16.9 percentage points (opioid-sparing minus conventional).
Contraction frequency and amplitude were higher in the opioid-sparing group at 24, 48, and 72 h (all reported p < 0.001). Motility grading scores were also higher (24 h, p = 0.002; 48 and 72 h, p < 0.001; Table 3).
The imaging outcomes and clinical recovery milestones showed consistent between-group trends, with higher cine-MRI motility measures accompanying faster gastrointestinal recovery in the opioid-sparing group.
Visualized gastrointestinal motility by cine-MRI
Serial cine-MRI measurements are summarized in Table 3. A quantitative presentation of the reported group-level values is provided in Figure 3.
Figure 3 shows contraction frequency, contraction amplitude, and motility grading scores at 24, 48, and 72 h. Points indicate group means, and error bars indicate standard deviations. These summaries describe differences between-group differences and do not reproduce individual patient image sequences.
At 48 h, contraction frequency was 1.45 ± 0.42 versus 0.93 ± 0.37 contractions/min, amplitude was 5.9 ± 1.6 versus 3.8 ± 1.4 mm, and motility score was 2.3 ± 0.6 versus 1.7 ± 0.5 in the opioid-sparing and conventional groups, respectively (reported p < 0.001 for each comparison). No inter-reader reliability coefficient, repeatability analysis, or diagnostic sensitivity estimate is available in the reported results.
Opioid consumption
Figure 4 summarizes perioperative and postoperative opioid exposure in the two study groups.
Reported median perioperative opioid exposure expressed as morphine milligram equivalents (MME) was 36.8 (interquartile range, 27–48) in the opioid-sparing group and 108.4 (74–125) in the conventional group (reported p < 0.01). The difference between these reported medians corresponds to a 66.1% lower median exposure in the opioid-sparing group.
Median postoperative MME values on postoperative days 1, 2, and 3 were 10.4, 6.9, and 2.8 in the opioid-sparing group and 46.2, 29.5, and 17.8 in the conventional group, respectively.
Postoperative pain scores and rescue analgesia
Resting numerical rating scale (NRS) scores were lower in the opioid-sparing group at all reported time points (Figure 5A; Table 4). At 12, 24, 48, and 72 h, mean scores were 2.4 ± 0.6 versus 3.0 ± 0.7, 2.1 ± 0.5 versus 2.7 ± 0.6, 1.6 ± 0.6 versus 2.2 ± 0.7, and 1.1 ± 0.5 versus 1.5 ± 0.6, respectively.
Movement NRS scores were also lower in the opioid-sparing group (Figure 5B; Table 4). At 12, 24, 48, and 72 h, mean scores were 3.2 ± 0.7 versus 3.9 ± 0.8, 2.8 ± 0.6 versus 3.5 ± 0.7, 2.1 ± 0.7 versus 2.8 ± 0.8, and 1.4 ± 0.6 versus 1.9 ± 0.7, respectively.
Rescue analgesia within 72 h was required by 11/65 patients (16.9%) in the opioid-sparing group and 27/65 patients (41.5%) in the conventional group (two-sided Fisher exact p = 0.0035). Median rescue analgesic administrations were 0 (0–1) and 1 (0–2), respectively (p = 0.001; Table 4).
Quality of recovery and clinical recovery milestones
Quality-of-recovery scores and gastrointestinal recovery times are summarized in Figure 6 and Table 5. The reported QoR-15 scores on postoperative days 1, 2, 3, and 7 were 106.3 ± 10.9 versus 88.4 ± 12.6, 119.7 ± 9.7 versus 99.2 ± 11.3, 136.8 ± 8.4 versus 126.1 ± 9.8, and 141.2 ± 9.1 versus 133.5 ± 10.4 in the opioid-sparing and conventional groups, respectively (all reported p < 0.001; Figure 6). Higher scores indicate better-reported recovery.
Median time to first flatus was 28 (22–35) versus 48 (38–62) h; time to first defecation was 52 (42–68) versus 78 (65–96) h; and time to tolerance of solid food was 72 (60–85) versus 96 (84–118) h in the opioid-sparing and conventional groups, respectively (all p < 0.001; Table 5).
Secondary clinical outcomes and complications
Secondary clinical outcomes were compared between the two groups, with emphasis on hospital stay, postoperative nausea and vomiting, rescue antiemetic use, readmission, and postoperative complications.
Table 6 summarizes hospital stay, postoperative nausea and vomiting, rescue antiemetic use, and readmission. Table 7 summarizes other postoperative complications.
Median postoperative hospital stay was 6 (5–7) versus 8 (7–10) days (p < 0.001). Postoperative nausea and vomiting occurred in 12/65 patients (18.5%) in the opioid-sparing group and 29/65 (44.6%) in the conventional group (two-sided Fisher's exact p = 0.0023). Rescue antiemetic use was 12.3% versus 33.8%, and 30-day readmission was 1.5% versus 6.2%, respectively.
Table 7 summarizes wound infection (2/65 versus 4/65), pulmonary infection (1/65 versus 3/65), and urinary retention (2/65 versus 5/65). Two-sided Fisher's exact p-values were 0.6801, 0.6191, and 0.4401, respectively. No anastomotic leaks or 30-day deaths occurred in either group.
Data Availability:
The data supporting the findings of this study are available in Zenodo at https://zenodo.org/records/22686172.
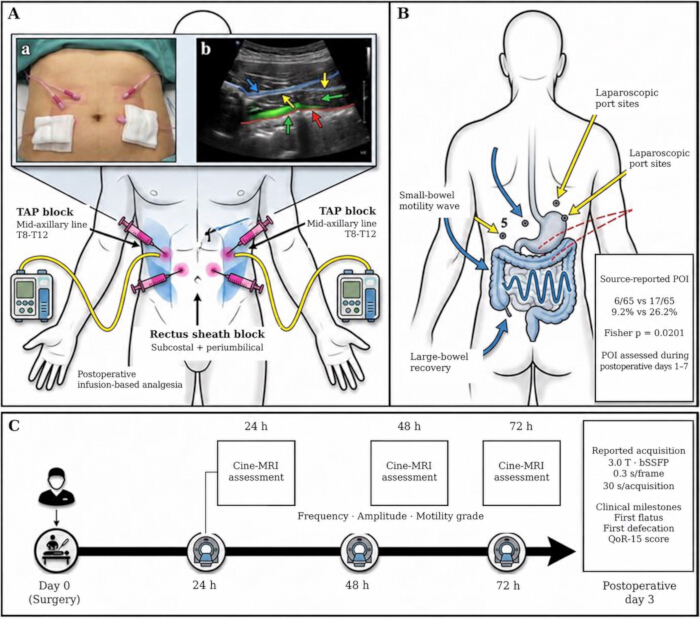
Figure 1: Opioid-sparing analgesia and postoperative gastrointestinal recovery assessment schedule. (A) Components of the opioid-sparing analgesic intervention, including transversus abdominis plane blocks, rectus sheath blocks, and postoperative analgesic management. (B) Postoperative gastrointestinal recovery assessment, including the reported incidence of postoperative ileus (POI) and related gastrointestinal outcomes. (C) Cine-MRI assessment schedule at 24, 48, and 72 h after surgery, with evaluation of intestinal motility parameters and clinical recovery milestones. Please click here to view a larger version of this figure.
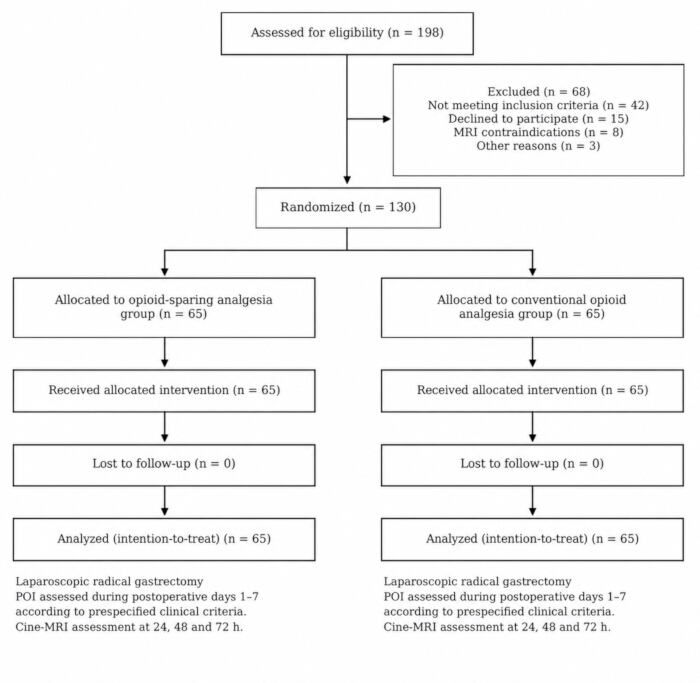
Figure 2: Participant flow. Of 198 patients assessed for eligibility, 68 were excluded, and 130 were randomized. Each group included 65 patients in the intention-to-treat analysis. Please click here to view a larger version of this figure.
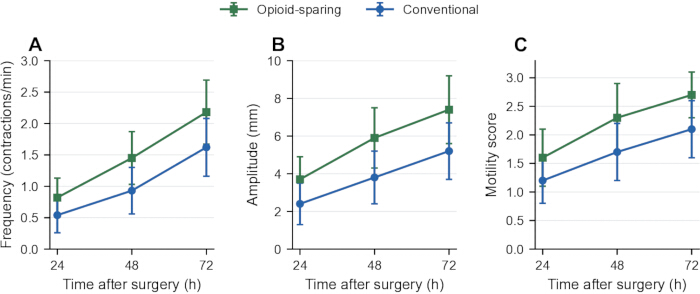
Figure 3: Serial cine-MRI motility measurements. (A) Contraction frequency. (B) Contraction amplitude. (C) Motility grading score. Points and error bars represent mean ± standard deviation; n = 65 per group. Statistical comparisons were performed using two-way repeated-measures ANOVA with Bonferroni-adjusted post hoc comparisons. Please click here to view a larger version of this figure.
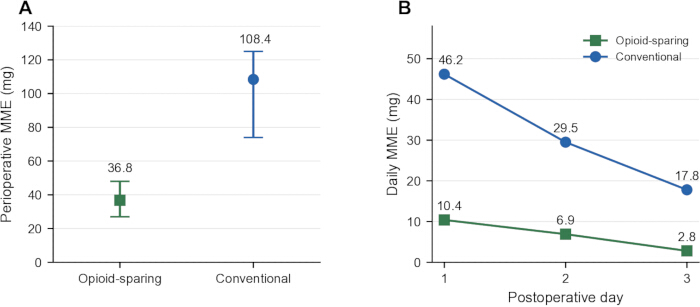
Figure 4: Opioid exposure. (A) Perioperative morphine milligram equivalents (MME), shown as median with interquartile range. (B) Median MME on postoperative days 1–3; n = 65 per group. Please click here to view a larger version of this figure.
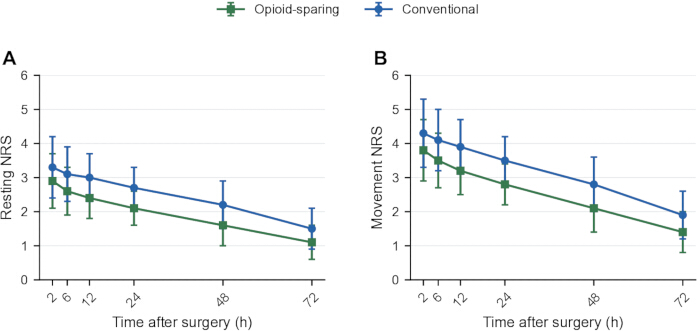
Figure 5: Postoperative pain. (A) Resting numerical rating scale (NRS). (B) Movement NRS. Points and error bars represent mean ± standard deviation; n = 65 per group. Please click here to view a larger version of this figure.
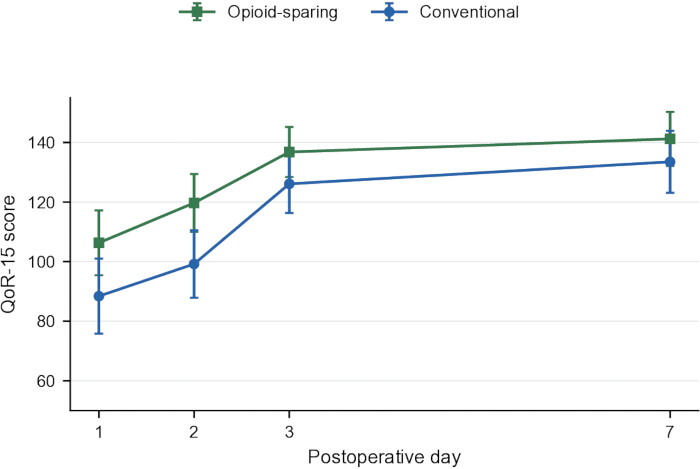
Figure 6: Quality of recovery. QoR-15 scores on postoperative days 1, 2, 3, and 7 are shown as mean ± standard deviation; n = 65 per group. Higher scores indicate better recovery. Please click here to view a larger version of this figure.
| Characteristics | Opioid-sparing analgesia group (n = 65) | Conventional opioid analgesia group (n = 65) |
| Age (years), mean ± SD | 59.3 ± 8.7 | 60.1 ± 9.2 |
| Sex, n (%) | ||
| - Male | 42 (64.6) | 40 (61.5) |
| - Female | 23 (35.4) | 25 (38.5) |
| Body mass index (kg/m2), mean ± SD | 22.4 ± 3.1 | 22.7 ± 2.9 |
| ASA physical status, n (%) | ||
| - I | 12 (18.5) | 10 (15.4) |
| - II | 40 (61.5) | 42 (64.6) |
| - III | 13 (20.0) | 13 (20.0) |
| Tumor stage (AJCC 8th), n (%) | ||
| - I | 18 (27.7) | 17 (26.2) |
| - II | 25 (38.5) | 27 (41.5) |
| - III | 22 (33.8) | 21 (32.3) |
| Comorbidities, n (%) | ||
| - Hypertension | 28 (43.1) | 30 (46.2) |
| - Diabetes mellitus | 15 (23.1) | 14 (21.5) |
| - Chronic obstructive pulmonary disease | 7 (10.8) | 8 (12.3) |
| Preoperative hemoglobin (g/dL), mean ± SD | 12.8 ± 1.4 | 12.6 ± 1.5 |
| Surgical duration (min), mean ± SD | 192.4 ± 28.6 | 195.7 ± 30.2 |
| Intraoperative blood loss (mL), mean ± SD | 148.2 ± 45.9 | 152.3 ± 47.1 |
| Lymph nodes resected, median (IQR) | 28 (24–32) | 27 (23–31) |
Table 1: Baseline and perioperative characteristics. Data are mean ± standard deviation, median (interquartile range), or n (%), as labeled. Abbreviations: ASA = American Society of Anesthesiologists; AJCC = American Joint Committee on Cancer; BMI = body mass index. Group size is 65 in each arm.
| Outcomes | Opioid-sparing analgesia group (n = 65) | Conventional opioid analgesia group (n = 65) | p value |
| Postoperative ileus (POI), n (%) | 6 (9.2) | 17 (26.2) | 0.0201 |
Table 2: Incidence of postoperative ileus. Data are n (%) with 65 patients per group. Between-group comparison used a two-sided Fisher's exact test. POI was defined according to the prespecified clinical criteria described in the protocol section.
| Parameter | Time Point | Opioid-sparing analgesia group (n = 65) | Conventional opioid analgesia group (n = 65) | p value |
| Contraction frequency (contractions/min) | 24 h | 0.82 ± 0.31 | 0.54 ± 0.28 | <0.001 |
| 48 h | 1.45 ± 0.42 | 0.93 ± 0.37 | <0.001 | |
| 72 h | 2.18 ± 0.51 | 1.62 ± 0.46 | <0.001 | |
| Contraction amplitude (mm) | 24 h | 3.7 ± 1.2 | 2.4 ± 1.1 | <0.001 |
| 48 h | 5.9 ± 1.6 | 3.8 ± 1.4 | <0.001 | |
| 72 h | 7.4 ± 1.8 | 5.2 ± 1.5 | <0.001 | |
| Motility grading score (1–3) | 24 h | 1.6 ± 0.5 | 1.2 ± 0.4 | 0.002 |
| 48 h | 2.3 ± 0.6 | 1.7 ± 0.5 | <0.001 | |
| 72 h | 2.7 ± 0.4 | 2.1 ± 0.5 | <0.001 |
Table 3: Serial cine-MRI motility measurements. Data are mean ± standard deviation. Motility scores are graded as 1 = no peristalsis; 2 = weak peristalsis; and 3 = normal peristalsis. Group size is 65 per arm.
| Parameter | Time Point | Opioid-sparing analgesia group (n = 65) | Conventional opioid analgesia group (n = 65) | p value |
| Resting NRS, mean ± SD | 2 h | 2.9 ± 0.8 | 3.3 ± 0.9 | 0.012 |
| 6 h | 2.6 ± 0.7 | 3.1 ± 0.8 | 0.003 | |
| 12 h | 2.4 ± 0.6 | 3.0 ± 0.7 | <0.001 | |
| 24 h | 2.1 ± 0.5 | 2.7 ± 0.6 | <0.001 | |
| 48 h | 1.6 ± 0.6 | 2.2 ± 0.7 | 0.001 | |
| 72 h | 1.1 ± 0.5 | 1.5 ± 0.6 | 0.008 | |
| Dynamic (movement) NRS, mean ± SD | 2 h | 3.8 ± 0.9 | 4.3 ± 1.0 | 0.007 |
| 6 h | 3.5 ± 0.8 | 4.1 ± 0.9 | 0.002 | |
| 12 h | 3.2 ± 0.7 | 3.9 ± 0.8 | <0.001 | |
| 24 h | 2.8 ± 0.6 | 3.5 ± 0.7 | <0.001 | |
| 48 h | 2.1 ± 0.7 | 2.8 ± 0.8 | <0.001 | |
| 72 h | 1.4 ± 0.6 | 1.9 ± 0.7 | 0.004 | |
| Patients requiring rescue analgesia, n (%) | 0–72 h | 11 (16.9) | 27 (41.5) | 0.0035 |
| Number of rescue doses per patient, median (IQR) | 0–72 h | 0 (0–1) | 1 (0–2) | 0.001 |
Table 4: Postoperative pain scores and rescue analgesia. NRS values are mean ± standard deviation; rescue use is n (%); rescue administrations are median (interquartile range). Group size is 65 per arm. Abbreviations: NRS = numerical rating scale; SD = standard deviation; IQR = interquartile range.
| Milestone | Opioid-sparing analgesia group (n = 65) | Conventional opioid analgesia group (n = 65) | p value |
| Time to first flatus (h) | 28 (22–35) | 48 (38–62) | <0.001 |
| Time to first defecation (h) | 52 (42–68) | 78 (65–96) | <0.001 |
| Time to tolerance of solid diet (h) | 72 (60–85) | 96 (84–118) | <0.001 |
Table 5: Gastrointestinal recovery milestones. Values are median (interquartile range), in hours, with 65 patients per group.
| Parameter | Opioid-sparing analgesia group (n = 65) | Conventional opioid analgesia group (n = 65) | p value |
| Postoperative hospital stay, days, median (IQR) | 6 (5–7) | 8 (7–10) | <0.001 |
| Postoperative nausea and vomiting, n (%) | 12 (18.5) | 29 (44.6) | 0.0023 |
| Rescue antiemetic use, % | 12.3 | 33.8 | — |
| 30-day readmission, % | 1.5 | 6.2 | — |
Table 6: Secondary clinical outcomes. Hospital stay is median (interquartile range); postoperative nausea and vomiting are n (%); rescue antiemetic use and readmission are percentages. Group size is 65 per arm.
| Parameter | Opioid-sparing analgesia group (n = 65) | Conventional opioid analgesia group (n = 65) | p value |
| Wound infection, n (%) | 2 (3.1) | 4 (6.2) | 0.6801 |
| Pulmonary infection, n (%) | 1 (1.5) | 3 (4.6) | 0.6191 |
| Urinary retention, n (%) | 2 (3.1) | 5 (7.7) | 0.4401 |
| Anastomotic leakage, n (%) | 0 (0) | 0 (0) | — |
| 30-day mortality, n (%) | 0 (0) | 0 (0) | — |
Table 7: Other postoperative complications. Data are n (%), with 65 patients per group. Between-group comparisons for nonzero events used two-sided Fisher's exact tests.
Discussion
The findings indicate that opioid-sparing multimodal analgesia was associated with lower POI incidence, reduced opioid exposure, lower postoperative pain scores, and faster gastrointestinal recovery after laparoscopic gastrectomy. POI incidence was 9.2% in the opioid-sparing group and 26.2% in the conventional group, corresponding to an unadjusted risk ratio of 0.35 and a risk difference of −16.9 percentage points.
The direction of the findings is consistent with the rationale for multimodal opioid-sparing analgesia. The gastrectomy trial by Lin and colleagues provides procedure-specific evidence for a catheter-based regional technique11, while multispecialty observational evidence and a urological review support minimizing unnecessary opioid exposure in other settings7,8. Evidence from opioid-free anesthesia further indicates that opioid reduction should be integrated with balanced perioperative management rather than pursued as an isolated objective9,10.
Reduced intestinal µ-opioid receptor activation is a plausible contributor to improved bowel function4. A randomized trial of the peripheral antagonist alvimopan after major abdominal surgery supports this biological rationale, but it evaluated a different drug and surgical population24. The present trial compared a multimodal package and cannot isolate individual components or establish mediation through opioid reduction. Fluid therapy has been examined separately in laparoscopic gastric surgery, with no demonstrated overall benefit in complications from the restrictive strategy in the cited trial25. Early enteral feeding has also been studied after lower gastrointestinal surgery, with heterogeneous and generally low-certainty evidence26. These findings emphasize the need to report cointerventions; neither the alvimopan regimen nor those fluid or feeding protocols should be assumed to have been used in this study.
Cine-MRI can complement symptom-based outcomes by directly depicting bowel motion. Previous studies have demonstrated the technical feasibility of quantitative small-bowel motility assessment, registration-based quantification, and observer-based analysis15,16,17. In the present study, cine-MRI measurements focused on selected jejunal and ileal segments and were used to characterize postoperative motility changes over time. Standardized acquisition, segment selection, and reader procedures may further improve reproducibility in future multicenter applications.
Several limitations should be considered. This was a single-center study with 130 randomized patients, which may limit generalizability. In addition, although the recruitment target was determined before study initiation, the inputs to the original sample-size calculation could not be independently verified, limiting assessment of the reproducibility of the initial estimate. The modest number of events also limits precision for uncommon complications and readmission outcomes. In addition, complete patient-level data on perioperative electrolyte abnormalities, including potassium and magnesium disturbances, and sepsis-related events, were not available for adjustment. These factors may independently influence postoperative gastrointestinal function and could represent potential unmeasured confounders. Future studies should incorporate standardized assessment of electrolyte status and infectious complications to better evaluate their contributions to postoperative gastrointestinal recovery. In addition, cine-MRI measurements were obtained from selected jejunal and ileal segments rather than the entire gastrointestinal tract, and the study did not include an independent diagnostic-accuracy analysis. Larger multicenter studies with standardized cine-MRI acquisition and analysis procedures are warranted to further evaluate reproducibility and clinical applicability.
In conclusion, opioid-sparing multimodal analgesia was associated with favorable postoperative gastrointestinal recovery, lower opioid exposure, and improved pain-related outcomes after laparoscopic radical gastrectomy. Cine-MRI provided dynamic quantitative measurements of postoperative gastrointestinal motility and may complement conventional clinical recovery indicators. Further multicenter evaluation is warranted to establish the generalizability of these findings and optimize imaging-based assessment protocols.
Disclosures
The authors have no conflicts of interest to declare. Python and Matplotlib were used for figure preparation and visualization. AI-assisted code support tools were used during code development to generate figures. All generated figures were reviewed and verified by the authors, who take full responsibility for the accuracy and integrity of the presented content.
Author Contributions:
Yijun Liu: Conceptualization, Methodology, Investigation, Data curation, Writing – original draft. Xinjuan Tan: Investigation, Data curation, Visualization. Jian Mo: Methodology, Formal analysis, Visualization. Danchun Chen: Investigation, Resources, Project administration. Guixi Mo: Conceptualization, Supervision, Project administration, Writing – review and editing. All authors reviewed and approved the final manuscript.
Acknowledgements
We would like to express our profound gratitude to the participating patients and the clinical staff at the Department of Anesthesiology for their invaluable support during this clinical trial. Special thanks are extended to the radiology team for their technical assistance with the cine-MRI assessments and continuous monitoring. This research was generously supported by the Guangdong Institute of Modern Hospital Management 2025-2026 Annual Special Research Project (Project Number: GDXDYGS2025037). We deeply appreciate their financial support, which facilitated the successful execution of this study and the advancement of visualized postoperative assessments.
Materials
| Name | Company | Catalog Number | Comments |
|---|---|---|---|
| 3.0 T MRI scanner | Siemens Healthineers, Erlangen, Germany | MAGNETOM Skyra 3.0 T | Cine-MRI at 24, 48, and 72 h; 2D balanced steady-state free-precession sequence: TR 3.4 ms, TE 1.2 ms, flip angle 75°, slice thickness 8–10 mm, matrix 256 × 256, FOV 400–450 mm, temporal resolution 0.3 s/frame, three 30-s acquisitions, with respiratory gating. |
| Acetaminophen for intravenous use | B. Braun Medical, Germany | Paracetamol (acetaminophen) solution for infusion; catalog/batch no. not reported | Intravenous non-opioid analgesic used in the opioid-sparing analgesia regimen. |
| Common Terminology Criteria for Adverse Events (CTCAE) | Not applicable | Version 5.0 | Adverse-event grading framework. |
| Dexamethasone | Fresenius Kabi, Germany | Dexamethasone sodium phosphate injection; catalog/batch no. not reported | Used as an adjunct with ropivacaine for abdominal wall blocks. |
| Dexmedetomidine | Jiangsu Hengrui Medicine Co., Ltd., China | Dexmedetomidine hydrochloride injection; catalog/batch no. not reported | Intravenous adjunct used in the opioid-sparing analgesia regimen. |
| Flurbiprofen axetil | Jiangsu Hengrui Medicine Co., Ltd., China | Flurbiprofen axetil injection; catalog/batch no. not reported | Rescue analgesic used when postoperative pain remained inadequately controlled despite the assigned analgesic regimen. |
| I-FEED assessment instrument | Not applicable | Form/version not reported | Assessment instrument described for postoperative gastrointestinal function. |
| MATLAB-based in-house cine-MRI analysis software | MathWorks, Natick, MA, USA | MATLAB R2023a | Used by two independent readers for jejunal and ileal cine-MRI analysis, including contraction frequency, contraction amplitude, and motility grading. |
| Morphine | Northeast Pharmaceutical Group Shenyang No. 1 Pharmaceutical Co., Ltd., China | Morphine hydrochloride injection; catalog/batch no. not reported | Opioid named as an option in the conventional patient-controlled intravenous analgesia regimen. |
| Numerical rating scale (NRS) | Not applicable | Form/language not reported | Resting and movement pain assessments at 2, 6, 12, 24, 48, and 72 h. |
| PASS | NCSS, LLC | 15 | Software used for sample-size calculation. |
| Patient-controlled intravenous analgesia pump | WOO YOUNG MEDICAL Co., Ltd., Republic of Korea | Model not available in current records | Used for conventional postoperative opioid analgesia. |
| Polyethylene glycol (macrogol 4000) oral preparation | Beaufour Ipsen Industrie, France | Forlax/macrogol 4000 oral powder for oral solution | Used as bowel-distension preparation; 1 L oral solution administered approximately 60 min before cine-MRI acquisition. |
| Portable continuous-infusion pump | Smiths Medical, USA | Model not available in current records | Used for postoperative infusion-based analgesia in the opioid-sparing group. |
| Quality of Recovery-15 (QoR-15) questionnaire | Not applicable | Version/language not reported | Quality-of-recovery assessments on postoperative days 1, 2, 3, and 7. |
| Ropivacaine | AstraZeneca, Sweden | Ropivacaine hydrochloride injection; catalog/batch no. not reported | 0.2% ropivacaine used for transversus abdominis plane and rectus sheath blocks. |
| SPSS | IBM | 26 | Software used for statistical analysis. |
| Sufentanil | Yichang Humanwell Pharmaceutical Co., Ltd., China | Sufentanil citrate injection; catalog/batch no. not reported | Opioid used in the conventional patient-controlled intravenous analgesia regimen. |
| Ultrasound system | Shenzhen Mindray Bio-Medical Electronics Co., Ltd., Shenzhen, China | M9 ultrasound system with high-frequency linear probe | Used to guide bilateral transversus abdominis plane and rectus sheath blocks. |
References
- Vather R, Trivedi S, Bissett I. Defining postoperative ileus: results of a systematic review and global survey. J Gastrointest Surg. 2013;17(5):962–72.
- Hedrick TL et al. American Society for Enhanced Recovery and Perioperative Quality Initiative Joint Consensus Statement on Postoperative Gastrointestinal Dysfunction Within an Enhanced Recovery Pathway for Elective Colorectal Surgery. Anesth Analg. 2018;126(6):1896–907.
- Vather R, O'Grady G, Bissett IP, Dinning PG. Postoperative ileus: mechanisms and future directions for research. Clin Exp Pharmacol Physiol. 2014;41(5):358–70.
- Bauer AJ, Boeckxstaens GE. Mechanisms of postoperative ileus. Neurogastroenterol Motil. 2004;16(Suppl 2):54–60.
- Mortensen K et al. Consensus guidelines for enhanced recovery after gastrectomy: Enhanced Recovery After Surgery (ERAS®) Society recommendations. Br J Surg. 2014;101(10):1209–29.
- Kang SH et al. Multimodal Enhanced Recovery After Surgery (ERAS) Program is the Optimal Perioperative Care in Patients Undergoing Totally Laparoscopic Distal Gastrectomy for Gastric Cancer: A Prospective, Randomized, Clinical Trial. Ann Surg Oncol. 2018;25(11):3231–8.
- Collaborative T. Impact of opioid-free analgesia on pain severity and patient satisfaction after discharge from surgery: multispecialty, prospective cohort study in 25 countries. Br J Surg. 2024;111(1):znad421.
- Samenezhad S, Rafighi D. Opioid-sparing pain management in urologic surgery: A comprehensive narrative review of ERAS protocols and multimodal strategies. Perioper Care Oper Room Manag. 2026;42:100609.
- Beloeil H et al. Balanced Opioid-free Anesthesia with Dexmedetomidine versus Balanced Anesthesia with Remifentanil for Major or Intermediate Noncardiac Surgery. Anesthesiology. 2021;134(4):541–51.
- Salomé A, Harkouk H, Fletcher D, Martinez V. Opioid-Free Anesthesia Benefit-Risk Balance: A Systematic Review and Meta-Analysis of Randomized Controlled Trials. J Clin Med. 2021;10(10):2069.
- Lin Z, Chen Z, Li Y. Analgesic efficacy of an opioid-free postoperative pain management strategy versus a conventional opioid-based strategy following laparoscopic radical gastrectomy: an open-label, randomized, controlled, non-inferiority trial. World J Surg Oncol. 2024;22:54.
- Wu Y et al. The analgesic efficacy of subcostal transversus abdominis plane block compared with thoracic epidural analgesia and intravenous opioid analgesia after radical gastrectomy. Anesth Analg. 2013;117(2):507–13.
- Chen Q et al. Intertransverse process block versus subcostal transversus abdominis plane block in patients undergoing laparoscopic radical gastrectomy: a prospective randomized controlled trial. BMC Anesthesiol. 2025;25:9.
- Chin KJ et al. Essentials of Our Current Understanding: Abdominal Wall Blocks. Reg Anesth Pain Med. 2017;42(2):133–83.
- Choi JY et al. Technical Feasibility of Quantitative Measurement of Various Degrees of Small Bowel Motility Using Cine Magnetic Resonance Imaging. Korean J Radiol. 2023;24(11):1093–101.
- Odille F et al. Quantitative assessment of small bowel motility by nonrigid registration of dynamic MR images. Magn Reson Med. 2012;68(3):783–93.
- Hameed M et al. Inter- and intra-observer variability of software quantified bowel motility measurements of small bowel Crohn's disease: findings from the MOTILITY trial. Insights Imaging. 2025;16:111.
- Patak MA et al. Non-invasive measurement of small-bowel motility by MRI after abdominal surgery. Gut. 2007;56(7):1023–5.
- Alsharqawi N et al. Validity of the I-FEED score for postoperative gastrointestinal function in patients undergoing colorectal surgery. Surg Endosc. 2020;34(5):2219–26.
- Hjermstad MJ et al. Studies comparing Numerical Rating Scales, Verbal Rating Scales, and Visual Analogue Scales for assessment of pain intensity in adults: a systematic literature review. J Pain Symptom Manage. 2011;41(6):1073–93.
- Stark PA, Myles PS, Burke JA. Development and psychometric evaluation of a postoperative quality of recovery score: the QoR-15. Anesthesiology. 2013;118(6):1332–40.
- Myles PS, Myles DB. An Updated Minimal Clinically Important Difference for the QoR-15 Scale. Anesthesiology. 2021;135(5):934–5.
- Dowell D, Ragan KR, Jones CM, Baldwin GT, Chou R. CDC Clinical Practice Guideline for Prescribing Opioids for Pain—United States, 2022. MMWR Recommendations and Reports. 2022;71(3):1–95.
- Wolff BG et al. Alvimopan, a novel, peripherally acting mu opioid antagonist: results of a multicenter, randomized, double-blind, placebo-controlled, phase III trial of major abdominal surgery and postoperative ileus. Ann Surg. 2004;240(4):728–35.
- Kusaka Y, Ueno T, Minami T. Effect of restrictive versus liberal fluid therapy for laparoscopic gastric surgery on postoperative complications: a randomized controlled trial. J Anesth. 2025;39(1):101–10.
- Herbert G et al. Early enteral nutrition within 24 hours of lower gastrointestinal surgery versus later commencement for length of hospital stay and postoperative complications. Cochrane Database Syst Rev. 2019;7:CD004080.