A hybrid CNN-ViT model extracted multiparametric MRI features, and stacked logistic regression fused imaging and clinical predictions to estimate 90-day functional outcome after acute ischemic stroke. The fusion model achieved the highest internal test performance, with an AUC of 0.885 and accuracy of 0.840, and showed encouraging external validation performance.
A subscription to JoVE is required to view this content. Sign in or start your free trial.
Research Article
Hybrid CNN-ViT Modeling For Predicting Functional Outcome After Ischemic Stroke: A Retrospective Study
* These authors contributed equally
In This Article
Summary
Abstract
Acute ischemic stroke (AIS) is a major cause of death and long-term disability, and early prediction of functional recovery is important for guiding clinical decision-making and rehabilitation planning. Functional outcome at 90 days is commonly assessed using the modified Rankin Scale (mRS), but predicting long-term outcome from early clinical and imaging information remains challenging. We hypothesized that integrating multiparametric magnetic resonance imaging (MRI) with structured clinical variables using a hybrid convolutional neural network (CNN)-Vision Transformer (ViT) architecture would improve prediction of 90-day functional outcomes compared with single-modality models. A retrospective cohort of 300 AIS patients who underwent multiparametric MRI was analyzed and divided into a training-validation cohort (n = 250) and an internal independent test cohort (n = 50). An additional external test cohort of 37 AIS patients was included to assess model generalizability. A hybrid CNN-ViT model was developed to extract multiparametric MRI features, and imaging and clinical predictions were integrated using stacked logistic regression. Model performance was evaluated using the area under the receiver operating characteristic curve (AUC), sensitivity, specificity, and accuracy. Among the evaluated clinical models, the support vector machine achieved the highest internal test AUC (0.878). The imaging model achieved an AUC of 0.782. The multimodal fusion model achieved the best overall internal performance, with an AUC of 0.885, sensitivity of 0.920, specificity of 0.760, and accuracy of 0.840. Similar performance trends were observed in the external test cohort. These findings suggest that stacked fusion of multiparametric MRI and clinical predictions may improve 90-day functional outcome prediction after AIS. However, larger multicenter validation studies are required before clinical implementation.
Introduction
Acute ischemic stroke (AIS) remains a leading cause of death and long-term disability, and clinicians must estimate recovery early when treatment and discharge decisions are most time-sensitive1. Accurate early prediction of functional recovery is therefore clinically important for guiding treatment strategies, rehabilitation planning, and discharge decision-making. Ninety-day functional outcome is a standard endpoint in stroke research and care and is most commonly measured using the modified Rankin Scale (mRS), which has established validity and reliability in clinical trials and observational studies2,3. Despite its routine use, predicting 90-day mRS from admission data remains difficult because disability reflects both irreversible tissue injury and premorbid reserve and comorbidity burden, which influence recovery even when acute imaging findings are similar2,4.
Multiparametric MRI provides clinically actionable biomarkers of early ischemic injury and tissue status that are not fully captured by a single imaging contrast. Diffusion-weighted imaging (DWI) is highly sensitive to early ischemic changes. Apparent diffusion coefficient (ADC) imaging quantifies diffusion restriction and has demonstrated prognostic utility in acute stroke cohorts5. T2 fluid-attenuated inversion recovery (T2-FLAIR) complements diffusion imaging by enhancing visualization of lesion evolution and is central to DWI-FLAIR mismatch approaches used to estimate lesion age and treatment eligibility when onset time is uncertain6,7. Large multicenter studies and randomized trials have shown that DWI-FLAIR mismatch identifies patients within a 4.5-hour therapeutic window and supports MRI-guided thrombolysis in unknown-onset stroke, underscoring the prognostic relevance of DWI and FLAIR beyond diagnosis6,7. Collectively, these observations support modeling strategies integrating DWI, ADC, and T2-FLAIR to capture both early ischemic core characteristics and temporal information that may influence functional recovery.
In parallel, established clinical variables provide a strong prognostic signal and are routinely available at admission4. The National Institutes of Health Stroke Scale (NIHSS) is a widely used measure of neurologic deficit severity and strongly predicts clinical outcome. Stroke etiologic subtype, including Trial of Org 10172 in Acute Stroke Treatment (TOAST) classification, may provide additional prognostic information beyond NIHSS in some analyses8,9. Prior work has also demonstrated that vascular risk factors and comorbid conditions are repeatedly identified among candidate predictors of poor outcome in ischemic stroke cohorts and prognostic studies4,10. Specific comorbidities such as atrial fibrillation, decompensated heart failure, and diabetes are consistently associated with poorer functional outcomes after stroke1,11,12. Smoking is associated with worse 90-day functional outcomes, whereas alcohol use demonstrates weaker or dose-dependent associations, and lipid disorders show more complex relationships with post-stroke disability13,14,15,16,17. These findings support combining structured clinical predictors capturing stroke severity, etiology, and comorbidity burden with multiparametric MRI rather than relying on either modality alone.
Recent machine learning studies suggest that computational models can integrate heterogeneous biomarkers to improve stroke outcome prediction, although performance depends strongly on data modality, cohort composition, model design, and class imbalance handling strategies18,19,20. Gradient boosting and ensemble methods have demonstrated feasibility for predicting 90-day mRS using imaging, demographic, and clinical variables, particularly for binary classification of an unfavorable outcome (mRS > 2)18. Recent multicenter studies combining 3-dimensional convolutional neural network (CNN)-derived MRI features from DWI, ADC, and FLAIR with structured clinical variables have shown that multimodal models capture complementary prognostic information beyond single-modality approaches21. Similar findings have been reported using single imaging modalities such as diffusion-weighted imaging or noncontrast computed tomography fused with clinical variables18,22. Representative studies using multimodal artificial intelligence models for stroke outcome prediction are summarized in Table 1.
| Study | Imaging Modality | AI Technique (Model) | Objective | Summary |
| Liu et al.18 | MRI (DWI) + Clinical | Deep learning predictive model (DLPD, CNN-based imaging network + clinical feature network) | Predict ordinal 90-day mRS using fused imaging and clinical information. | The fused model significantly outperformed imaging-only and clinical-only models and achieved high accuracy for predicting unfavorable outcome. |
| Jung et al.21 | MRI (DWI, ADC, FLAIR) + Clinical | Ensemble deep learning model combining 3D-CNN imaging networks and multilayer perceptron (MLP) clinical model | Develop a multimodal ensemble DL model for functional outcome prediction in AIS. | Multimodal integration improved prediction of 3-month outcomes compared with single-modality models in a large multicenter cohort. |
| Wei et al.27 | MRI (DWI, ADC) + Clinical | Radiomics + machine learning (LASSO feature selection + logistic regression / random forest classifiers) | Predict long-term functional outcomes using MRI radiomics and clinical variables. | The radiomics-clinical model achieved better prognostic performance than imaging-only or clinical-only models. |
| Liu et al.22 | Non-contrast CT + Clinical | Deep learning fusion model (CNN imaging encoder + clinical MLP network) | Predict 90-day functional outcomes from acute-phase CT and clinical data. | Multimodal fusion significantly improved prediction accuracy compared with single-modality models. |
| Liu et al.19 | MRI (DWI) + Clinical | Deep learning predictive model (DLPD, CNN-based fusion model) | Evaluate the deep learning outcome prediction model against physician predictions. | The AI model achieved comparable performance to stroke specialists in predicting 90-day mRS outcomes. |
| Rehman et al.20 | Clinical | Hybrid deep learning (CNN+GRU with ADASYN) | Predict stroke risk from imbalanced clinical data | Hybrid deep learning with ADASYN improved stroke risk prediction performance, demonstrating the value of advanced data balancing and multimodel learning. |
| Ali et al.29 | MRI/fMRI/rs-fMRI | Systematic meta-review of ML, DL, and hybrid models | Evaluate computational intelligence techniques for neuroimaging-based diagnosis | Hybrid models generally outperformed standalone ML and DL approaches, supporting the value of hybrid architectures for neuroimaging-based prediction. |
Table 1: Summary of previous studies on artificial intelligence-based prediction of functional outcomes after acute ischemic stroke. Representative studies using imaging, clinical variables, or multimodal approaches for prediction of post-stroke functional outcomes are summarized, including imaging modality, artificial intelligence technique, study objective, and principal findings. Please click here to download this Table.
However, many existing studies rely on single imaging sequences or conventional deep learning models that primarily capture local spatial features and may not fully model long-range contextual relationships within brain imaging data. Consequently, a specific gap remains in developing and externally evaluating a multimodal approach that jointly uses DWI, ADC, and T2-FLAIR with structured clinical variables while combining local lesion feature extraction and global contextual modeling. Although CNNs are well established for lesion-level feature extraction, Transformer-based architectures such as Vision Transformers (ViTs) enable modeling of long-range contextual relationships through attention mechanisms, thereby providing complementary global representations23,24. Hybrid CNN-ViT models, therefore, provide a rational framework for jointly encoding local morphologic detail and global brain context. Machine learning algorithms are similarly well-suited for modeling complex nonlinear relationships within heterogeneous structured clinical data25. Guided by recent multimodal learning principles emphasizing complementary cross-modal integration26, this study combined multiparametric MRI within a CNN-ViT imaging backbone and integrated these features with a machine learning clinical model for 90-day outcome prediction. The novelty of the study lies in the development and external evaluation of a stacked multimodal fusion framework integrating complementary MRI sequences, local-global CNN-ViT imaging representations, and structured clinical predictors within a unified 90-day outcome prediction model.
The study's hypothesis was that integrating multiparametric MRI with structured clinical variables using a hybrid CNN-ViT architecture would improve the prediction of 90-day functional outcomes after AIS compared with single-modality models. Accordingly, the objective was to develop and evaluate a multimodal deep learning framework integrating DWI, ADC, and T2-FLAIR MRI sequences with structured clinical predictors to estimate 90-day mRS outcomes in AIS patients.
Access restricted. Please log in or start a trial to view this content.
Protocol
This study was approved by the Institutional Review Board of Shenzhen University General Hospital (IRB approval no. KYLL-2026-077-1). The requirement for written informed consent was waived due to the study's retrospective design.
1. Study cohort
Patients with acute ischemic stroke (AIS) who underwent multiparametric MRI were retrospectively identified from the institutional clinical database. The overall study workflow, including dataset partitioning, imaging model development, clinical model construction, and multimodal fusion, is illustrated in Figure 1.
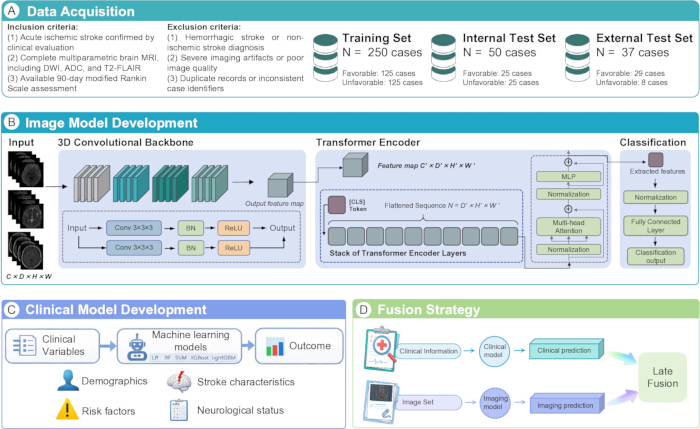
Figure 1: Workflow of the multimodal outcome prediction framework. (A) Data acquisition. Patients with acute ischemic stroke (AIS) meeting predefined inclusion criteria were retrospectively identified. The dataset was divided into a training-validation cohort (n = 250), an internal independent test cohort (n = 50), and an external test cohort (n = 37). Stratified five-fold cross-validation was performed within the training-validation cohort. (B) Imaging model development. Multiparametric MRI sequences, including diffusion-weighted imaging (DWI), apparent diffusion coefficient (ADC), and T2 fluid-attenuated inversion recovery (T2-FLAIR), were processed using a hybrid 3-dimensional convolutional neural network-Vision Transformer (CNN-ViT) architecture for outcome prediction. (C) Clinical model development. Structured clinical variables were used to train machine learning models for prediction of 90-day functional outcome. (D) Multimodal fusion strategy. Predictions generated by the imaging and clinical models were integrated using a stacked logistic regression meta-learner to produce final outcome predictions. Please click here to view a larger version of this figure.
MRI examinations were performed using clinical MRI systems. A dedicated phased-array head coil was used for image acquisition. All sequences were acquired in the axial plane using consistent slice positioning across modalities. Diffusion-weighted imaging (DWI) was acquired using a single-shot spin-echo echo-planar imaging sequence with repetition time (TR) of 3,000–5,000 ms and echo time (TE) of 80–90 ms. Diffusion sensitization was applied using b-values of 0 and 800–1,000 s/mm2 in at least 3 orthogonal directions. The field of view ranged from 220–240 mm with a matrix size of 128 × 128. Slice thickness was 5–6 mm with an interslice gap of 1–1.5 mm. Two to four signal averages were acquired.
Apparent diffusion coefficient (ADC) maps were automatically generated from DWI data on the scanner workstation using mono-exponential fitting based on the acquired b-values. ADC values were calculated voxel-wise and exported for quantitative analysis. T2 fluid-attenuated inversion recovery (T2-FLAIR) images were acquired using an inversion recovery sequence with TR of 8,000–10,000 ms, TE of 80–140 ms, and inversion time of 2,200–2,600 ms. The field of view ranged from 220–240 mm with a matrix size of 192 × 192 to 256 × 256. Slice thickness was 4–5 mm with an interslice gap of 1–1.5 mm.
2. Data preprocessing
Clinical data were imported from structured spreadsheets containing case identifiers, mRS outcome scores, dataset split labels, and demographic and clinical variables. Case identifiers were standardized to ensure consistency with imaging filenames. Clinical variables included demographic characteristics, stroke severity measured using the National Institutes of Health Stroke Scale (NIHSS), vascular risk factors, and comorbid conditions recorded at admission.
The primary outcome was functional status at 90 days after stroke onset measured using the modified Rankin Scale (mRS). A favorable outcome was defined as mRS ≤ 2 and an unfavorable outcome as mRS > 2. The dataset was randomly divided into training-validation and internal independent test cohorts using stratified sampling based on mRS distribution to preserve outcome balance. An external test cohort was processed separately and was not used during model development. Within the training-validation cohort, stratified k-fold cross-validation was applied to maintain consistent outcome distributions across folds.
All DWI, ADC, and T2-FLAIR volumes were preprocessed before model training to ensure spatial and numerical consistency across modalities. The same preprocessing pipeline was applied to the training-validation, internal test, and external test cohorts without modification. Images were reoriented to canonical RAS orientation and converted to floating-point arrays. In-plane spatial resolution was resampled to 256 × 256 using linear interpolation. The through-plane dimension was standardized to 20 slices using a center-based strategy: volumes containing more than 20 slices were center-cropped, whereas volumes containing fewer than 20 slices were symmetrically zero-padded. The final volume size was 256 × 256 × 20.
Intensity normalization was performed independently for each volume using z-score normalization:
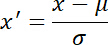
where x denotes voxel intensity, µ is the mean intensity of the volume, and σ is the standard deviation. If σ = 0, normalization was not applied to prevent numerical instability. Processed volumes were saved in NIfTI format with a standardized affine matrix for downstream deep learning analysis.
3. Clinical model development
Structured clinical variables were used to develop machine learning models for outcome prediction. Candidate predictors included demographic characteristics, vascular risk factors, stroke etiology, and baseline clinical severity measures. Continuous variables were imputed using median values and standardized. Categorical variables were imputed using the most frequent category and encoded using one-hot encoding.
Multiple machine learning algorithms were evaluated, including logistic regression, random forest, gradient boosting, support vector machine (SVM), extreme gradient boosting, and light gradient boosting machine models. Model development followed a stratified five-fold cross-validation framework within the training-validation cohort to estimate generalization performance. Final predictions for the internal and external test cohorts were generated by averaging predictions from models trained on each cross-validation fold. No external test samples were used during cross-validation or model selection.
4. Deep learning model architecture
A 3-dimensional CNN-ViT hybrid architecture was implemented for outcome prediction from multimodal MRI volumes. The network was designed to combine local spatial feature extraction with global contextual modeling within a unified framework. Input volumes consisted of multichannel 3-dimensional images processed end-to-end.
Feature extraction was initially performed using a hierarchical 3-dimensional convolutional backbone composed of 4 stages. Each stage included 2 convolutional layers with kernel size of 3 × 3 × 3 and padding of 1 voxel, followed by batch normalization and rectified linear unit activation. Spatial resolution was progressively reduced using 3-dimensional max-pooling layers applied after the first 3 stages, while feature-channel depth increased at each level to capture higher-level semantic representations. Dropout regularization (dropout rate = 0.1) was applied after the final convolutional stage to reduce overfitting. The convolutional backbone transformed the input volume of size C × D × H × W into a compact high-level feature representation with reduced spatial dimensions.
The resulting feature map was reshaped into a sequence of tokens by flattening spatial dimensions such that the number of tokens corresponded to:
N = D' x H' x W'
Global contextual relationships among tokens were modeled using Transformer encoder layers composed of multi-head self-attention and feedforward networks. Self-attention was computed as:

where Q, K, and V denote query, key, and value matrices, respectively, and d represents embedding dimension. Layer normalization and dropout were applied within each encoder layer to improve training stability. The Transformer module consisted of 3 encoder layers with 8 attention heads and an embedding dimension of 256.
After Transformer encoding, the representation corresponding to the classification token was extracted and normalized. A fully connected linear layer produced a single logit output for binary classification.
The proposed hybrid CNN-ViT architecture was intentionally designed as a lightweight and parameter-efficient model to balance representational capacity and overfitting risk. The model comprised 3.79 million trainable parameters (approximately 14.4 MB in fp32 precision), including 1.38 million in the convolutional backbone and 2.37 million in the Transformer encoder.
5. Imaging model training
Training of the imaging model was performed using a stratified five-fold cross-validation framework to preserve outcome distribution across folds while improving robustness of performance estimation. The dataset was divided into a training-validation cohort and an internal independent test cohort using stratified sampling based on outcome distribution. Within the training-validation cohort, stratified five-fold cross-validation was applied. For each fold, the imaging model was trained using the training subset and evaluated using the corresponding validation subset, whereas the held-out test cohort was reserved exclusively for final performance evaluation.
Model optimization was performed using a deep learning framework on a GPU-equipped workstation with the AdamW optimizer, learning rate of 3 × 10⁻5, and weight decay of 3 × 10⁻4. Training was conducted using a batch size of 8 for up to 200 epochs. Binary cross-entropy with logits was used as the loss function.
To address class imbalance, a positive-class weighting factor was computed for each fold based on the ratio of negative to positive samples and incorporated into the loss function. Gradient norm clipping with a maximum norm of 0.5 was applied to improve numerical stability during optimization. Automatic mixed-precision training was enabled to improve computational efficiency.
Early stopping was implemented when validation performance failed to improve by at least 1 × 10⁻4 over 30 consecutive epochs. The best-performing model checkpoint from each fold was retained. After completion of all folds, predictions for the internal and external test cohorts were generated using each fold-specific model, and final probabilities were obtained by averaging predictions across the 5 models to generate ensemble outputs.
6. Multimodal fusion model
A stacked fusion strategy was implemented to integrate imaging-derived predictions with structured clinical information. The deep learning imaging model and clinical prediction model served as base learners, and their predicted probabilities were used as input features for a logistic regression meta-learner. Additional interaction features, including the product and absolute difference of predicted probabilities, were incorporated to capture complementary information between imaging and clinical predictions.
To prevent information leakage, the meta-learner was trained using out-of-fold predicted probabilities generated from the training-validation cohort. Cross-validated out-of-fold probabilities from the imaging and clinical models were merged by patient identifier to construct the meta-learner training dataset. For the internal and external test cohorts, corresponding test-set probabilities from the imaging and clinical models were used as inputs to the trained meta-learner to generate fused probabilities. The trained meta-learner was applied to both test cohorts without refitting.
7. Ablation study
Ablation experiments were performed to assess the contributions of individual MRI sequences and the Vision Transformer component using identical training and evaluation settings as the primary model. Sequence ablations included single-sequence models, leave-one-sequence-out models, and the full multiparametric model. To evaluate the contribution of the Vision Transformer module, the proposed hybrid architecture was additionally compared with a CNN-only baseline in which the Transformer encoder was removed while preserving the same convolutional backbone.
8. Statistical analysis
Model performance was evaluated separately in the internal independent test cohort and external test cohort using area under the receiver operating characteristic curve (AUC) as the primary discrimination metric. Receiver operating characteristic (ROC) curves were constructed using predicted probabilities generated by each model. Sensitivity, specificity, and overall accuracy were additionally calculated to characterize classification performance.
Binary outcomes were generated using thresholds determined according to Youden’s index. Sensitivity, specificity, and accuracy were subsequently calculated at the optimal threshold. All statistical analyses, machine learning model development, and deep learning model training were implemented using standard scientific computing and machine learning software packages.
Access restricted. Please log in or start a trial to view this content.
Results
Study cohort
A total of 300 patients with acute ischemic stroke (AIS) were included after application of predefined inclusion and exclusion criteria. The dataset was divided into a training-validation cohort (n = 250) and an internal independent test cohort (n = 50) using stratified sampling based on functional outcome distribution. In addition, an external test cohort of 37 AIS patients from an independent dataset was included to provide preliminary external validation. Strat...
Access restricted. Please log in or start a trial to view this content.
Discussion
This study developed and evaluated a multimodal artificial intelligence framework integrating multiparametric MRI and structured clinical variables for prediction of 90-day functional outcome after acute ischemic stroke (AIS). The proposed fusion model demonstrated higher predictive performance than either the imaging or clinical model alone. Specifically, the stacked multimodal model integrating predictions from the support vector machine (SVM)-based clinical model and the imaging model achieved an AUC of 0.885 in the i...
Access restricted. Please log in or start a trial to view this content.
Disclosures
The authors declare no competing interests.
Acknowledgements
This research received no specific grant from any funding agency in the public, commercial, or not-for-profit sectors.
Access restricted. Please log in or start a trial to view this content.
Materials
| Name | Company | Catalog Number | Comments |
|---|---|---|---|
| Magnetic resonance imaging system ((Discovery MR750 3.0T) | GE Healthcare | https://www.gehealthcare.in/products/magnetic-resonance-imaging/3-0t/discovery-mr750 | Clinical MRI scanner used for acquisition of DWI, ADC, and T2-FLAIR images |
| Phased-array head coil | GE Healthcare | https://services.gehealthcare.com/gehcstorefront/p/5450630 | Head coil used for MRI signal reception |
| Graphics processing unit (RTX 4090) | NVIDIA | https://www.nvidia.com/en-us/geforce/graphics-cards/40-series/rtx-4090/ | GPU used for deep learning model training |
| Deep learning framework (PyTorch v2.1) | PyTorch Foundation | https://pytorch.org/ | Framework used to implement the CNN-Transformer model |
| Programming language (Python v3.10) | Python Software Foundation | https://www.python.org/downloads/release/python-3100/ | Environment used for model development and data processing |
| Machine learning library (scikit-learn) | scikit-learn Developers | https://scikit-learn.org/stable/ | Used for clinical machine learning models and statistical analysis |
| Gradient boosting library (XGBoost) | DMLC | https://xgboost.readthedocs.io/en/release_3.2.0/ | Used for gradient boosting model implementation |
| Gradient boosting library (LightGBM) | Microsoft | https://lightgbm.readthedocs.io/en/stable/ | Used for LightGBM clinical model |