This protocol presents a mixed-methods framework integrating pedestrian trajectory tracking, participatory mapping, and multi-criteria evaluation to assess community public spaces and identify evidence-based urban renewal priorities.
A subscription to JoVE is required to view this content. Sign in or start your free trial.
Method Article
Prioritizing Micro-Scale Urban Renewal Through Behavioral Tracking and Participatory Mapping of Community Public Spaces
In This Article
Summary
Abstract
The effective renewal of community public spaces requires an integrated understanding of physical conditions and user experiences. However, conventional assessment approaches often separate behavioral observation from user perception. This protocol presents a mixed-methods framework for evaluating community public spaces by combining observed usage patterns, perceived environmental quality, and place-specific spatial feedback. The workflow includes physical site audits, repeated pedestrian observations, trajectory tracing, intercept surveys, and participatory mapping. These data streams are integrated within a weighted multi-criteria evaluation (MCE) framework to determine site-specific renewal priorities. To demonstrate the protocol, eight neighborhood public spaces were evaluated, generating 336 observation blocks, 240 intercept surveys, and 96 coded micro-spatial units. Behavioral indicators, including pedestrian count and trajectory complexity, were analyzed alongside subjective measures such as comfort and perceived safety. The representative findings demonstrate that renewal urgency cannot be determined by physical deterioration alone. Instead, high-priority sites were characterized by the convergence of intensive routine use, low perceived quality, and concentrated negative spatial feedback. This protocol provides urban researchers and planners with a reproducible and spatially grounded method for diagnosing public-space deficits and prioritizing targeted urban-renewal interventions.
Introduction
Historically, urban renewal was associated with large-scale, top-down redevelopment. Contemporary planning approaches, however, increasingly emphasize micro-scale and user-centered community regeneration. Within this context, community public spaces serve as primary environments for daily urban activity, accommodating movement, rest, and social interaction. Foundational urban theorists, including William H. Whyte and Jan Gehl, demonstrated that the social value of public space extends beyond physical infrastructure alone. Gehl’s distinction between “necessary” and “optional” activities further suggests that high pedestrian volume may reflect functional necessity rather than positive spatial quality. Consequently, evaluating the renewal needs of community public spaces requires more than assessing physical design or maintenance conditions. Recent studies have increasingly emphasized user-centered approaches that translate subjective experiences into measurable dimensions of public-space quality1. Neighborhood public spaces are therefore commonly evaluated through multiple dimensions, including accessibility, comfort, and functional adaptability for everyday use2.
To capture these dimensions, public-space assessment methods have evolved beyond static land-use indicators and occasional pedestrian counts toward approaches capable of recording continuous micro-spatial behavior3,4. Recent spatiotemporal tracking studies demonstrate that pedestrian movement patterns are highly sensitive to temporal variation and environmental configuration5,6. Pedestrian volume alone cannot determine whether a space functions as a meaningful destination or merely as a transit corridor7,8. At the same time, research on place experience has shown that perceptions of safety and comfort are influenced not only by formal infrastructure but also by localized environmental conditions9. Comprehensive public-space evaluation therefore requires the integration of objective behavioral observation with subjective user experience10.
Spatially contextualizing subjective experience is equally important. Participatory mapping methods can identify localized environmental perceptions and site-specific spatial concerns that are often overlooked in conventional questionnaires11. These approaches have proven effective for translating user feedback into spatially actionable information for targeted public-space interventions12. Despite these advances, behavioral monitoring, perception assessment, and decision-support evaluation are often treated as separate analytical processes. Observational approaches alone cannot explain the subjective motivations underlying spatial behavior, whereas surveys alone frequently lack precise geographic context. Although multi-criteria analysis and Analytic Hierarchy Process (AHP) methods have been applied to urban mobility and public-space decision-making13,14, these frameworks rarely integrate localized behavioral and perceptual data within a unified workflow.
This limitation is particularly important for neighborhood public spaces, which are highly context-sensitive and closely embedded in residents’ daily routines. Assessing renewal urgency in these environments requires integrated evaluation models capable of identifying both operational deficiencies and experiential shortcomings15. Because data collected through separate methods often remain analytically fragmented16, a standardized and reproducible assessment protocol is needed.
This article presents a mixed-methods field protocol that integrates repeated pedestrian observation, trajectory tracing, intercept surveys, and participatory mapping within a Multi-Criteria Evaluation (MCE) framework. The protocol directly links observed movement patterns with georeferenced user perceptions to support evidence-based renewal assessment. By integrating multiple data streams within a single analytical structure, the workflow reduces fragmentation across conventional assessment methods and enables the identification of site-specific environmental priorities. The protocol is based on the premise that high utilization does not necessarily indicate high spatial quality, and that physical deterioration alone does not determine the urgency of renewal. Instead, renewal priority emerges from the interaction between routine use intensity, perceived environmental deficits, and concentrated negative spatial feedback. This framework provides urban researchers and planners with a reproducible method for identifying and prioritizing targeted interventions in community public spaces.
Access restricted. Please log in or start a trial to view this content.
Protocol
All methods involving human subjects were conducted in compliance with the institutional Ethics Committee guidelines at City University of Macau (Approval Number: PIOM771899). The research tools used in the protocol are listed in the Table of Materials.
1. Study site selection and preparation
- Establish a typological matrix based on local morphological characteristics and demographic distributions. Select eight representative community public-space types, including a pocket park, neighborhood square, community garden, transit-edge plaza, waterfront walkway, street-corner resting space, senior activity court, and youth sports forecourt.
- Include only sites that are publicly accessible without cost or registration, contain clearly defined pedestrian-use areas, support routine weekday and holiday activity, include identifiable internal subspaces for coding, and provide adequate visibility from a stationary observation point.
- Exclude sites under construction, partially closed, temporarily occupied by events, or visually obstructed.
- Assign an alphanumeric site code to each location before fieldwork begins (Table 1). Summarize the workflow using the schematic shown in Figure 1.
| Site ID | Site name | Space type | Context | Accessibility | Seating | Shade | Lighting | Greenery | Cleanliness | Activity support | Maintenance |
| S1 | Riverside Pocket Park | Pocket park | Inner-neighborhood | 76.4 | 59.3 | 67.7 | 83.9 | 53.7 | 67.9 | 80.7 | 75.1 |
| S2 | Maple Square | Neighborhood square | Inner-neighborhood | 65.4 | 63.5 | 47.3 | 60.4 | 54.1 | 48.8 | 39.9 | 56.9 |
| S3 | Sunrise Community Garden | Community garden | Mixed residential | 65.9 | 66.8 | 48.3 | 56.4 | 84.5 | 70 | 66.2 | 52.8 |
| S4 | Transit Frontage Plaza | Transit-edge plaza | Mixed commercial | 61.6 | 54.3 | 32.9 | 65.3 | 33.4 | 59.4 | 47.9 | 79.9 |
| S5 | Lakeside Promenade | Waterfront walkway | Mixed residential | 75.5 | 52.3 | 74.9 | 60.1 | 67.9 | 56.4 | 53.1 | 72.5 |
| S6 | Market Lane Rest Area | Street-corner resting space | Commercial edge | 73.5 | 57.1 | 49.8 | 60.3 | 22.9 | 57.5 | 51.6 | 72.9 |
| S7 | Harmony Senior Activity Court | Senior activity court | Aging community | 73.5 | 37.8 | 60.7 | 63 | 43 | 73.5 | 72.4 | 75.1 |
| S8 | Youth Sports Forecourt | Youth sports forecourt | School-adjacent | 61.7 | 52.3 | 57.2 | 74 | 40.7 | 63.3 | 45.6 | 49 |
Table 1: Baseline typological characteristics and standardized audited environmental domains for the selected study locations. The table outlines the general characteristics of the eight community public spaces, including site name, space type, and neighborhood context. Subsequent columns present independent audit scores for access, seating, shade, lighting, greenery, cleanliness, activity support, and maintenance. NOTE: All audited domains were scored on a 0-100 scale, with higher scores indicating better observed physical conditions. Site IDs (S1 through S8) serve as fixed row headers for all subsequent analytical datasets to maintain structural consistency.
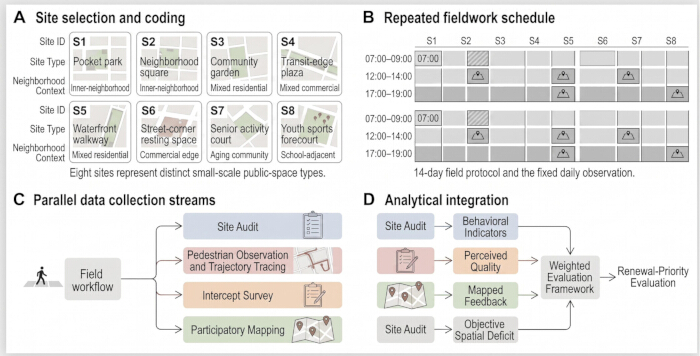
Figure 1: Comprehensive methodological workflow illustrating the integrated process of site inspection, repeated behavioral observation, intercept surveys, participatory mapping, and renewal-priority assessment. (A) Selection and coding of the eight community public spaces categorized by specific site types and neighborhood contexts to ensure spatial diversity. (B) Repeated field observation schedule spanning a 14-day period across three fixed daily timeslots (07:00–09:00, 12:00–14:00, and 17:00–19:00) to rigorously capture temporal behavioral variations. (C) Parallel collection of site-audit, pedestrian trajectory, intercept-survey, and participatory mapping data streams executed concurrently. (D) Analytical integration of the four data streams to form weighted site-level indicators and compute the ultimate renewal-priority evaluation. Please click here to view a larger version of this figure.
2. Baseline physical condition auditing
- Conduct a baseline site audit before behavioral observations. Have the same two trained examiners independently evaluate each site during a single half-day session.
- Score accessibility, seating, shade, lighting, greenery, cleanliness, activity support, and maintenance on a 0–100 scale, where higher values indicate better conditions.
- Define accessibility according to entrance clarity, uninterrupted pedestrian circulation, and barrier-free movement. Define activity support according to the availability of facilities for sitting, playing, or light exercise.
- Compare the independent scores after each audit. Reinspect any category with a discrepancy greater than 10 points and establish a reconciled consensus score.
3. Fieldwork scheduling and observer training
- Conduct fieldwork over a continuous 14-day period to capture weekday and weekend usage patterns.
- Schedule observations during three daily periods: 07:00–09:00, 12:00–14:00, and 17:00–19:00.
- Record air temperature and rainfall conditions at the start of each observation block. Repeat any block interrupted by heavy rain, equipment malfunction, or crowd-control measures.
- Maintain exactly 42 valid observation blocks per site, totaling 336 blocks across all locations (Table 2).
- Require all field personnel to complete a pilot training session before formal data collection. Train observers in pedestrian counting, trajectory tracing, stopwatch operation, respondent recruitment, survey administration, and segment coding.
- Deploy two observers during each observation block. Assign one observer to pedestrian counting and field-note recording, and assign the second observer to trajectory tracing and duration recording.
- Resolve on-site discrepancies using time-stamped records and baseline field notes.
| Component | Specification |
| Fieldwork period | 7 April 2025 to 20 April 2025 |
| Total field duration | 14 consecutive days |
| Number of study sites | 8 |
| Observation periods per day | 3 |
| Morning block | 07:00-09:00 |
| Midday block | 12:00-14:00 |
| Evening block | 17:00-19:00 |
| Observation duration per block | 2 hours |
| Blocks per site | 42 |
| Total observation blocks | 336 |
| Weather recorded at block start | Air temperature; rainfall status |
| Block rescheduling criteria | Heavy rain; equipment failure; crowd-control intervention; non-routine disturbance preventing valid observation |
| Block retention rule | Block retained only when full two-hour observation met recording criteria |
| Observer arrangement | 2 trained observers per block |
| Counting responsibility | Observer 1: pedestrian count and block notes |
| Tracing responsibility | Observer 2: trajectory tracing and timing |
Table 2: Field schedule and observation-block structure. Summary of the fieldwork parameters, daily observation window times, block duration, total number of sites and observation blocks, weather-recording items, rescheduling criteria, and observer assignment. This specifies the temporal arrangement for multiple-field observations adopted in the protocol.
4. Pedestrian observation and trajectory tracing
- Monitor pedestrian behavior continuously during each two-hour observation block.
- Count all pedestrians entering the defined site boundaries. Exclude individuals moving only along adjacent roads without entering the site.
- Record re-entering individuals as separate entries.
- Trace the path of every third eligible pedestrian entering the site.
- Define eligibility as the ability to visually follow more than 50% of the participant’s intended movement path.
- Exclude individuals who become immediately obscured, move only along the outer boundary, or merge into visually inseparable groups.
- Record the entry point, exit point or terminal location, path shape, stop behavior, and movement duration for each traced participant.
- Digitize all trajectory paths at the end of each field day using the standardized base maps and site codes (Figure 2).
- Calculate pedestrian count by aggregating valid entries within each observation block.
- Calculate average dwell time as the mean duration spent within site boundaries by fully traced users.
- Calculate average walking speed by dividing the path length by the recorded travel time. Exclude stationary participants from this calculation.
- Calculate the stationary share as the proportion of traced individuals remaining stationary for at least 30 s.
- Classify trajectories into predefined route categories and calculate the trajectory-diversity index.
- Identify turns, detours, and structural loops to calculate the trajectory-complexity score (Table 3).
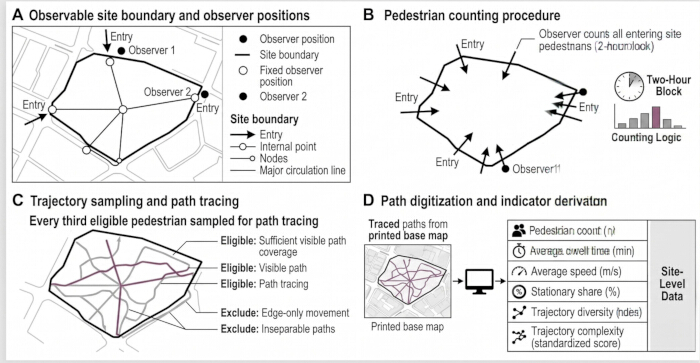
Figure 2: Pedestrian counting and trajectory-tracking workflow. (A) Definition of an observable site boundary and fixed observation points. (B) The pedestrian count carried out every 2 hours. (C) Sampling and tracing of every third eligible pedestrian path on the printed base map. (D) Traced path digitization and behavior indicator generation, including pedestrian counts, average dwell times, average speeds, stationary shares, trajectory diversities, and trajectory complexity indices. Please click here to view a larger version of this figure.
| Variable | Operational definition | Scale / unit | Analytical level | ||
| Accessibility | Entrance clarity, path continuity, barrier-free movement, and ease of approach from adjacent streets | 0-100 score | Site | ||
| Seating | Availability, distribution, and usability of formal or informal resting opportunities | 0-100 score | Site | ||
| Shade | Tree canopy and built shelter at common stay locations | 0-100 score | Site | ||
| Lighting | Adequacy of evening illumination based on field inspection | 0-100 score | Site | ||
| Greenery | Visible vegetation within the public-use area | 0-100 score | Site | ||
| Cleanliness | Litter, surface tidiness, and general upkeep | 0-100 score | Site | ||
| Activity support | Physical accommodation for sitting, waiting, socializing, play, or light exercise | 0-100 score | Site | ||
| Maintenance | Visible damage, broken elements, worn surfaces, and repair condition | 0-100 score | Site | ||
| Pedestrian count | Total number of site entries recorded during one observation block | Count | Observation block | ||
| Average dwell time | Mean time spent within the site among traced users whose entry and exit or full stay episode were observable | Minutes | Observation block | ||
| Average speed | Digitized path length divided by movement time for traced users with continuous movement paths; stationary users excluded | m/s | Observation block | ||
| Stationary share | Proportion of traced users who stopped, sat, stood, waited, socialized, or remained stationary for at least 30 s | Proportion | Observation block | ||
| Trajectory diversity | Standardized score derived from the distribution of traced users across predefined internal route classes within the same block | Standardized score | Observation block | ||
| Trajectory complexity | Standardized mean score derived from turning, detour, and looping features of traced paths within the same block | Standardized score | Observation block | ||
| Safety | Respondent rating of perceived personal and situational safety in the site | 1-5 Likert | Respondent | ||
| Comfort | Respondent rating of thermal, physical, and general experiential comfort | 1-5 Likert | Respondent | ||
| Enjoyment | Respondent rating of pleasure or positive experiential value | 1-5 Likert | Respondent | ||
| Cleanliness perception | Respondent rating of observed cleanliness and order | 1-5 Likert | Respondent | ||
| Accessibility perception | Respondent rating of ease of reaching and moving through the site | 1-5 Likert | Respondent | ||
| Social value | Respondent rating of the site’s value for meeting, staying, or neighborhood interaction | 1-5 Likert | Respondent | ||
| Overall satisfaction | Respondent global evaluation of the site | 1-5 Likert | Respondent | ||
| Renewal support | Respondent assessment of whether the site should be improved in the near term | 1-5 Likert | Respondent | ||
| Top renewal request | Single highest-priority improvement selected by the respondent | Categorical | Respondent | ||
| Positive mapped feedback | Positive segment-level mark assigned by a respondent within one mapping domain | Count | Segment / site | ||
| Negative mapped feedback | Negative segment-level mark assigned by a respondent within one mapping domain | Count | Segment / site | ||
| Perceived quality | Site-level mean of respondent-rated perception items retained for integrated analysis | Mean score | Site | ||
| Objective spatial deficit | Inverse of reconciled site-audit score used in the renewal-priority model | Normalized component | Site | ||
| Use intensity | Site-level aggregated pedestrian count used in the renewal-priority model | Normalized component | Site | ||
| Renewal-priority score | Weighted multi-criteria score integrating use intensity, low perceived quality, negative mapped feedback, and objective spatial deficit | 0-1 normalized score | Site | ||
Table 3: Operational definitions, scales, and aggregation levels of analytical variables. This table lists all variables used in the study: auditing of environmental domains, block-based behavioral indicators, respondents' perception variables, mapping-derived indicators, and site-level integrated variables for renewal priority assessment. The measurement scale, units, and analytical levels for all variables are indicated. Please click here to download Table 3.
5. Intercept surveys and participatory mapping
- Conduct intercept surveys concurrently with the observation period.
- Recruit adults aged 18 years or older who remained at the site for at least 5 min or visibly traversed the study area.
- Distribute recruitment evenly across the three observation periods and target 30 respondents per site.
- Approach approximately every third eligible adult. Record refusals and proceed to the next eligible participant.
- Collect demographic information, travel distance, visit frequency, and primary visit purpose using the standardized questionnaire.
- Ask respondents to rate safety, comfort, enjoyment, cleanliness, accessibility, social value, overall satisfaction, and support for spatial renewal.
- Ask respondents to identify the highest-priority improvement need for the site.
- Conduct participatory mapping immediately after survey completion.
- Provide respondents with a simplified site map divided into predefined micro-spatial segments. Code a total of 96 segments across all eight sites.
- Instruct respondents to identify positive or negative experiences related to safety, comfort, activity support, accessibility, greenery, and maintenance.
- Limit each respondent to a maximum of three marked segments. Permit one positive and one negative mark per domain, while allowing multiple domain annotations within the same segment when applicable (Figure 3).
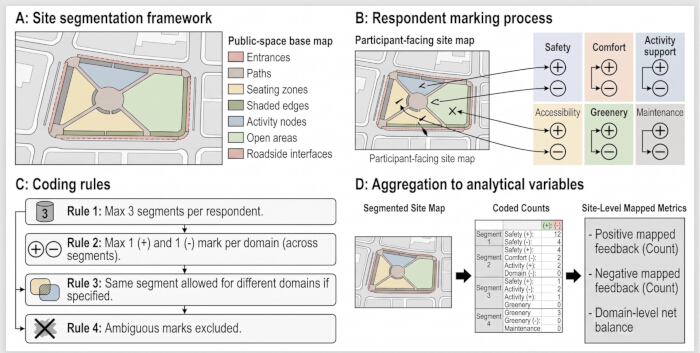
Figure 3: Participatory mapping procedure and segment-coding logic. (A) Pre-segmentation of each site into recognizable internal micro-geographical areas. (B) Respondent-based positive and negative ratings for several sub-items in each of the six aspects: Safety, Comfort, Activity Support, Accessibility, Greenery, and Maintenance. (C) Limitations on the quantity of marked segments and management of domain-specific positive and negative labels. (D) Aggregation of segment-mapped feedback to produce site-level mapped items. Please click here to view a larger version of this figure.
6. Data processing and quality control
- Merge site-audit files, observation records, survey responses, and mapping annotations using the standardized site codes.
- Calculate inter-rater reliability before merging observational datasets.
- Calculate the Intraclass Correlation Coefficient (ICC) for continuous audit variables and Cohen’s Kappa for categorical trajectory classifications.
- Import scanned field maps into QGIS 3.34.
- Open the Georeferencer tool and align the scanned maps with the standardized base map using fixed site reference points.
- Create a new polyline shapefile layer and manually digitize all traced pedestrian trajectories.
- Export the digitized trajectories as GeoJSON files.
- Execute the Python 3.11 processing script using the pandas and geopandas libraries to calculate path lengths and merge spatial data with Excel 365 records.
- Provide the Python scripts, observer-training sheets, survey templates, and example mapping annotations as Supplementary Files.
- Review all data files after each field day.
- Remove duplicate respondent IDs, incomplete records, impossible walking speeds, incorrect segment labels, and temporal inconsistencies.
- Apply predefined exclusion criteria to ensure data quality.
- Exclude respondents younger than 18 years or questionnaires with incomplete perception ratings.
- Exclude trajectories with less than 60% continuous visual path coverage.
- Maintain a minimum Cohen’s Kappa value of 0.75 for categorical trajectory coding.
- Maintain a minimum ICC value of 0.80 for physical-audit scoring.
- Re-audit any observation block that fails to meet the predefined reliability thresholds.
- Exclude mapping records containing invalid segment codes.
- Retain only complete records for the final analysis and do not apply statistical imputation.
- Aggregate cleaned datasets at the site level.
- Calculate average survey ratings and summarize negative mapped expressions to derive the perceived-quality metric.
- Set statistical significance at P < 0.05.
- Standardize all continuous outputs, including behavioral indicators, perception ratings, reliability coefficients, and evaluation scores, to two decimal places.
7. Multi-Criteria Evaluation (MCE) for renewal priority
- Evaluate renewal priority using four components: use intensity, low perceived quality, negative mapped feedback, and objective spatial deficit.
- Calculate use intensity from aggregated pedestrian counts.
- Calculate low perceived quality using the reciprocal of the site-level perceived-quality score.
- Calculate negative mapped feedback using the total number of negative annotations across all domains.
- Calculate the objective spatial deficit using the reciprocal of the reconciled physical-audit score.
- Normalize all four components to a 0–1 range using min-max normalization.
- Derive criteria weights using the Analytic Hierarchy Process (AHP).
- Convene a panel of local planners, urban designers, and community representatives to perform pairwise comparisons of the four evaluation components.
- Calculate the final renewal-priority score using Equation 1.
Priority = 0.30 (Use Intensity) + 0.30 (Low Perceived Quality) + 0.25 (Negative Mapped Feedback) + 0.15 (Objective Spatial Deficit) - Perform a one-way sensitivity analysis before finalizing the rankings.
- Increase and decrease each individual weight by 0.05 while proportionally adjusting the remaining weights to maintain a total value of 1.00 (Table 4).
- Confirm ranking stability by verifying whether the highest-priority sites remain consistent under the modified weighting conditions.
| Component | Definition in Model | AHP-derived Weight | Data Source | Transformation Before Weighting |
| Use intensity | Aggregated pedestrian count at site level | 0.3 | Observation blocks | Min-max normalization to 0-1 |
| Low perceived quality | Inverse of site-level perceived quality | 0.3 | Intercept survey | Min-max normalization to 0-1 |
| Negative mapped feedback | Total number of negative annotations summed across segments and domains within the same site | 0.25 | Participatory mapping | Min-max normalization to 0-1 |
| Objective spatial deficit | Inverse of reconciled site-audit score | 0.15 | Site audit | Min-max normalization to 0-1 |
Table 4: Weighting matrix for renewal-priority evaluation. The table lists the four components of the weighted multi-criteria evaluation model: their operational definitions, specified weightages, source data streams, and pre-weighted transformation procedures. A sensitivity-check rule is applied, in which each component weight is adjusted by ±0.05.
Access restricted. Please log in or start a trial to view this content.
Results
The protocol generated a structured analytical dataset comprising eight monitored sites, 336 valid observation blocks, 240 completed intercept surveys, and 96 coded micro-spatial units. The retained analytical sample is summarized in Table 5 and Figure 4. All scheduled observation blocks were completed without statistical imputation.
| Site ID | <... |
Access restricted. Please log in or start a trial to view this content.
Discussion
The analytical findings successfully demonstrate the operational viability and diagnostic sensitivity of the proposed mixed-methods approach. The primary objective of this protocol is to provide urban researchers and planners with a reproducible, mixed-methods framework capable of diagnosing public space performance by triangulating objective behavioral tracking, subjective perception ratings, and georeferenced participant mapping. The representative results validate the core premise of this methodology: high routine use...
Access restricted. Please log in or start a trial to view this content.
Disclosures
The authors have nothing to disclose.
Acknowledgements
The authors thank all participants involved in the field surveys and participatory mapping exercises for their time and contributions to this study. The authors also acknowledge the Faculty of Innovative Design at the City University of Macau and the School of Architecture at the University of Edinburgh for providing academic support and research resources. This research received no specific grant from funding agencies in the public, commercial, or not-for-profit sectors.
Access restricted. Please log in or start a trial to view this content.
Materials
| Name | Company | Catalog Number | Comments |
|---|---|---|---|
| Intercept survey questionnaire | Self-prepared by authors | Structured questionnaire form | Collection of demographic, perception, and renewal-demand data |
| Microsoft Excel | Microsoft Corporation | Microsoft Excel 365 | Spreadsheet validation and data organization |
| Participatory mapping sheet | Self-prepared by authors | Segment-coded mapping form | Recording positive and negative spatial feedback |
| Printed base maps | Self-prepared by authors | Site-coded field maps | Pedestrian trajectory tracing and participatory mapping |
| Python | Python Software Foundation | Version 3.11 | Data cleaning, aggregation, and statistical processing |
| QGIS | QGIS Development Team | Version 3.34 | Base map verification and trajectory digitization |