Phase-contrast magnetic resonance imaging (PC-MRI) and four-dimensional flow MRI (4D-Flow) reveal an altered association between cerebrospinal fluid (CSF) dynamics and cerebral vasculature in Alzheimer's disease, reflecting potential glymphatic alterations and offering a non-invasive, quantitative method for potential adjunctive biomarker and disease monitoring.
A subscription to JoVE is required to view this content. Sign in or start your free trial.
Research Article
Quantitative Assessment of Cerebrospinal Fluid-Vascular Association in Alzheimer's Disease Using Phase-Contrast and 4D-Flow Magnetic Resonance Imaging
* These authors contributed equally
In This Article
Summary
Abstract
From a neuropathological perspective, the most well-known pathological change in Alzheimer's disease (AD) to date is primarily tau protein hyperphosphorylation, which leads to the formation of intracellular neurofibrillary tangles (NFTs) and amyloid protein deposition—namely, the accumulation of amyloid protein (Aβ) and other protein aggregates outside cells, resulting in neurofibrillary tangles. The glymphatic system, driven by arterial pulsation, clears waste, including amyloid-β, via perivascular spaces (PVS). In AD, vascular dysfunction and slow-wave sleep speculation have been separately observed, and both are hypothesized to impair glymphatic clearance. However, causal links among these factors remain unproven, and the proposed self‑reinforcing cycle—where vascular failure may aggravate protein deposition and further vascular damage—is speculative. This study utilized two-dimensional cine phase-contrast MRI (PC-MRI) and four-dimensional flow MRI (4D-Flow) to quantify hydrodynamic parameters, including cerebrospinal fluid (CSF) flow in the cerebral aqueduct (CA) and blood flow in the internal carotid artery (ICA). Altered CSF-vascular association was observed in AD, suggesting possible glymphatic involvement. The integration of CSF and vascular flow metrics provides a promising biomarker framework for early AD detection and monitoring. PC-MRI and 4D-Flow reveal altered CSF-vascular association in Alzheimer’s disease, reflecting potential glymphatic alteration and offering a non-invasive, quantitative method for potential adjunctive biomarker and disease monitoring.
Introduction
Alzheimer's disease (AD) is the most common type of dementia—a progressive, irreversible neurological disorder characterized by memory loss and cognitive dysfunction1,2. With its global incidence rising rapidly3, early detection and intervention have gained significant attention worldwide.
The precise etiology of AD remains unclear due to its complex pathophysiology. Key neuropathological features include intracellular neurofibrillary tangles from tau hyperphosphorylation and extracellular amyloid-β (Aβ) plaques1. Accumulating evidence suggests that impaired clearance of Aβ, rather than its overproduction, is a major driver of amyloid deposition, thereby promoting disease onset and progression4. A critical pathway for Aβ clearance in the brain is the glymphatic system, a perivascular waste‑clearance network mediated by aquaporin‑4 (AQP4)5,6. Glymphatic dysfunction compromises the influx of cerebrospinal fluid (CSF) into the brain parenchyma via paravascular spaces, thereby hindering the exchange between CSF and interstitial fluid (ISF) and impeding the clearance of metabolic wastes, including Aβ7. Alterations in AD biomarkers, detectable via PET or CSF analysis, can precede clinical symptoms by years8. Research in AD model mice indicates glymphatic system anomalies occurring prior to Aβ deposition9,10, highlighting its role in brain waste clearance via perivascular pathways.
CSF dynamics and cerebral hemodynamics are critical to understanding aging and cognitive impairment. CSF maintains CNS homeostasis, facilitates waste clearance, and provides mechanical protection. The flow pattern of cerebral blood is related to various factors, including the compliance of brain tissue, vascular integrity, changes in intracranial pressure11, and cortical tau deposition12,13. Cerebral blood flow, arterial pulsation, and vasomotion are key indicators of cerebrovascular health, particularly in aging and AD populations14. Abnormal CSF dynamics are associated with various neurological disorders, including AD and normal pressure hydrocephalus (NPH)15,16. Recent studies have found that the severity of Alzheimer's disease may be related to changes in the permeability of the choroid plexus, suggesting that CSF circulation disorders play a role in the development of AD17.
Advanced imaging techniques like 4D flow MRI and 2D cine phase-contrast (PC) MRI have significantly enhanced the ability to evaluate these dynamic changes. PC-MRI noninvasively quantifies velocity, direction, and signal intensity of intracranial arterial, venous, and CSF flow within a cardiac cycle18. 4D flow MRI captures three-dimensional blood flow over time, enabling comprehensive hemodynamic assessment, including wall shear stress and pulse wave velocity19. Earlier foundational work using 2D cine PC-MRI has established its value in quantifying CSF and blood flow dynamics1,20,21,22. For instance, elevated cerebroarterial pulsations measured by 2D PC MRI have been linked to microvascular damage and cognitive decline in elderly populations23. Recently, studies employing 4D blood flow MRI have provided critical insights into the relationship between cerebrovascular dynamics and cognitive impairment, with some research demonstrating that arterial pulsatility enhancement is linked to cognitive decline, particularly in populations with AD and MCI24. Meanwhile, the latest advancements in real-time PC-MRI provide a more profound perspective for capturing transient flow phenomena25.
This study aims to use PC-MRI to quantify hydrodynamic markers of CSF in the cerebral aqueduct and hemodynamic indicators of cervical macrovessels, explore differences among AD, MCI, and NC groups, and correlate these parameters with cognitive scores. Integrating these imaging modalities may advance diagnostic capabilities and inform targeted therapeutic strategies for neurological disorders15.
Access restricted. Please log in or start a trial to view this content.
Protocol
Participants
Participants were recruited from the Neurology Department of Ningde Municipal Hospital and Ningde Normal University between November 2022 and November 2023. Following the inclusion/exclusion criteria, 35 patients (16 AD, 19 MCI) and 25 healthy elderly controls (NC) were included. Informed consent was obtained from all participants and from the families of those with cognitive impairment. This study was performed in line with the principles of the Declaration of Helsinki. Approval was granted by the Ethics Committee of Ningde Municipal Hospital (Approval No: 20200901).
Inclusion criteria were age between 50 and 85 years, willingness to undergo MRI and provide informed consent, and ability to complete imaging with family assistance or across multiple sessions if needed. Exclusion criteria included the presence of brain tumors; severe cardiovascular disease; history of psychiatric illness; previous traumatic brain injury; major neurological disorders such as central nervous system infections, Parkinson‘s disease, Huntington’s disease, epilepsy, or multiple sclerosis; severe systemic diseases; non-removable metallic implants; severe sensory impairments that prevented cognitive assessment; image artifacts; and left-handedness.
Diagnoses of Alzheimer’s disease (AD), mild cognitive impairment (MCI), and normal cognition (NC) were established by two neurologists using the National Institute on Aging–Alzheimer’s Association (NIA-AA) criteria. Probable AD required progressive cognitive and functional decline; MCI required objective cognitive impairment with preserved daily function; NC required no cognitive or neurological abnormalities. A consensus diagnosis was reached for all participants. Biomarker confirmation was not uniformly available, which constitutes a study limitation. All the tools and materials used in this study are listed in the Table of Materials.
Clinical data
Demographic and clinical data were collected, including age, sex, education, medical history (hypertension, diabetes, hyperlipidemia), and physical examination findings. Cognitive function was assessed using the mini-mental state examination (MMSE) and Montreal cognitive assessment (MoCA).
Image acquisition
Imaging was performed on a 3.0T MRI scanner using a dedicated head-neck coil. The imaging protocol included T2-weighted fluid-attenuated inversion recovery (T2-FLAIR), diffusion-weighted imaging (DWI), sagittal T1-weighted imaging, and phase-contrast MRI (comprising 2D cine phase-contrast and 4D flow sequences). All participants were positioned supine, head-first, with the head immobilized using foam pads and ear protection applied to reduce motion artifacts.
Two-dimensional cine phase-contrast MRI
A 2D cine phase-contrast sequence (Fast PC Cine Slice) was acquired perpendicular to the mid-cerebral aqueduct, as defined on the sagittal T1-weighted localizer images. The imaging parameters were as follows: field of view, 24 × 24 cm; slice thickness, 5.0 mm; repetition time/echo time, 20.2/6.1 ms; matrix, 288 × 256; pixel size, 0.83 × 0.94 mm; bandwidth, 31.25 kHz; number of excitations, 1.0; flip angle, 20°; encoding velocity, 12 cm/s; peripheral gating; and 20–30 phases per cardiac cycle. The encoding velocity was selected to adequately capture aqueductal CSF flow without aliasing. The acquisition duration ranged from 1 to 3 min, depending on the participant‘s heart rate.
Four-dimensional flow MRI
A 4D flow sequence (Sag 4D Flow) was performed to cover the cervical carotid region. The imaging parameters were as follows: field of view, 24 × 24 cm; slice thickness, 1.0 mm; slice spacing, 2.0 mm; 40–50 slices; repetition time/echo time, 6.6/2.8 ms; matrix, 180 × 180; pixel size, 1.33 × 1.33 mm; bandwidth, 62.50 kHz; number of excitations, 1.0; flip angle, 15°; encoding velocity, 50 cm/s; and 20–30 phases per cardiac cycle. The encoding velocity of 50 cm/s was chosen to adequately capture carotid arterial flow while minimizing aliasing. Acquisition duration ranged from 1 to 3 minutes, depending on heart rate. All images were analyzed using specialized post-processing software (Table of Materials).
Image processing and analysis
Analysis of cerebrospinal fluid-related parameters
Two-dimensional cine PC magnitude and phase images were analyzed using specialized post-processing software (Figure 1A–D). Two radiologists (each with three years of neuroimaging experience) independently drew regions of interest (ROIs) along the outer edge of the cerebral aqueduct at its maximum cross-sectional area, identified on the sagittal T1-weighted localizer and confirmed on the magnitude image. Each radiologist delineated the ROI twice, with an interval of at least two weeks between sessions. Background phase correction was performed using the built-in stationary tissue correction algorithm in the software, which subtracts the mean phase of a static tissue region (placed in the midbrain parenchyma adjacent to the aqueduct) from the velocity-encoded phase images to minimize eddy current and Maxwell term effects. The following parameters were generated for each participant: maximum systolic velocity (peak systolic velocity, PSV), maximum diastolic velocity (peak diastolic velocity, PDV), net stroke volume, and flow curves. The aqueduct cross-sectional area was recorded (Figure 2). Inter-rater and intra-rater reliability were assessed using two-way random-effects intraclass correlation coefficients (ICC) for absolute agreement; both exceeded 0.90 for all parameters.
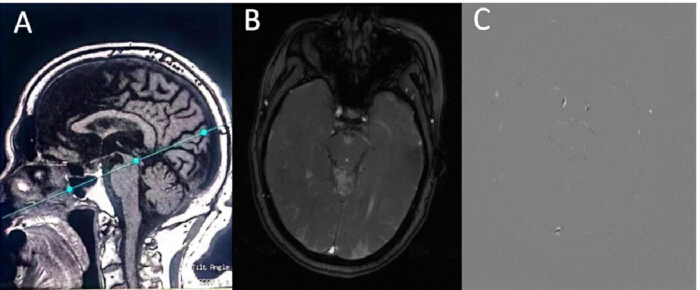
Figure 1: Cerebrospinal fluid flow imaging acquisition and processing. (A) Sagittal T1-weighted localizer image showing the positioning of the 2D cine phase-contrast slice, set perpendicular to the mid-cerebral aqueduct (dashed line). (B) Magnitude image of the cine 2D sequence showing the anatomical structure of the cerebral aqueduct. (C) Phase image of the cine 2D sequence showing CSF flow signal intensity. Abbreviations: CA = cerebral aqueduct; CSF = cerebrospinal fluid. Please click here to view a larger version of this figure.
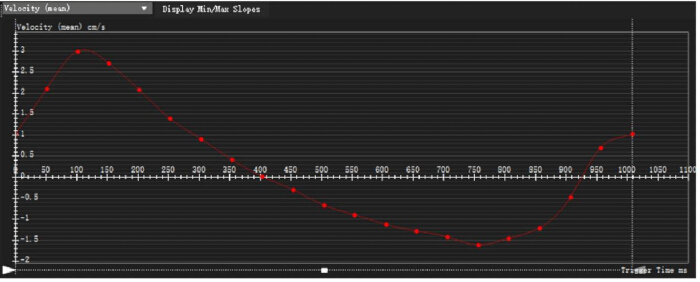
Figure 2: Representative cerebrospinal fluid flow velocity curve. Time–flow velocity curve showing the biphasic, quasi-sinusoidal CSF flow pattern over a single cardiac cycle. The curve illustrates changes in velocity during systole and diastole. Abbreviations: CSF = cerebrospinal fluid. Please click here to view a larger version of this figure.
Analysis of parameters related to internal carotid artery flow
Four-dimensional flow data were reconstructed and analyzed using the 4D Flow module in specialized post-processing software. Phase-offset correction was applied using a first-order polynomial fit to static tissue regions. The left internal carotid artery (LICA) was isolated using a semi-automatic threshold-based segmentation tool with manual refinement, which generated a 3D angiographic volume. A vessel centerline was automatically computed, and three cross-sectional planes orthogonal to the centerline were placed at the C1 segment (approximately 2–3 cm above the carotid bifurcation) with 5-mm spacing between adjacent planes. The left internal carotid artery was selected for analysis based on its consistent anatomical course and flow characteristics; the right internal carotid artery was not assessed to minimize scanning duration and participant burden. While a unilateral approach was adopted for feasibility in this exploratory study, bilateral assessment is warranted in future investigations. For each plane, the vessel lumen was contoured using a semi-automatic edge-detection algorithm with manual adjustment at each cardiac time frame (approximately 20 frames per cycle) (Figure 3A–D).
From the time-resolved lumen contours, the following parameters were computed: maximum flow velocity, flow volume per cardiac cycle, and mean wall shear stress (WSS). WSS was derived using the formula:
WSS = μ × (∂v/∂r)|_wall (1)
where µ = 0.004 Pa·s is the assumed blood viscosity, and ∂v/∂r is the velocity gradient normal to the vessel wall, obtained by fitting a parabolic profile to the near-wall velocity data at each circumferential position and averaging over the lumen circumference. Flow velocity, vector, and WSS maps were generated, and time-flow and time-WSS curves were plotted. Values from the three planes were averaged to obtain a single representative value per participant. All image processing was performed by the same two radiologists independently, and the mean of their measurements was used for statistical analysis (Figure 4).
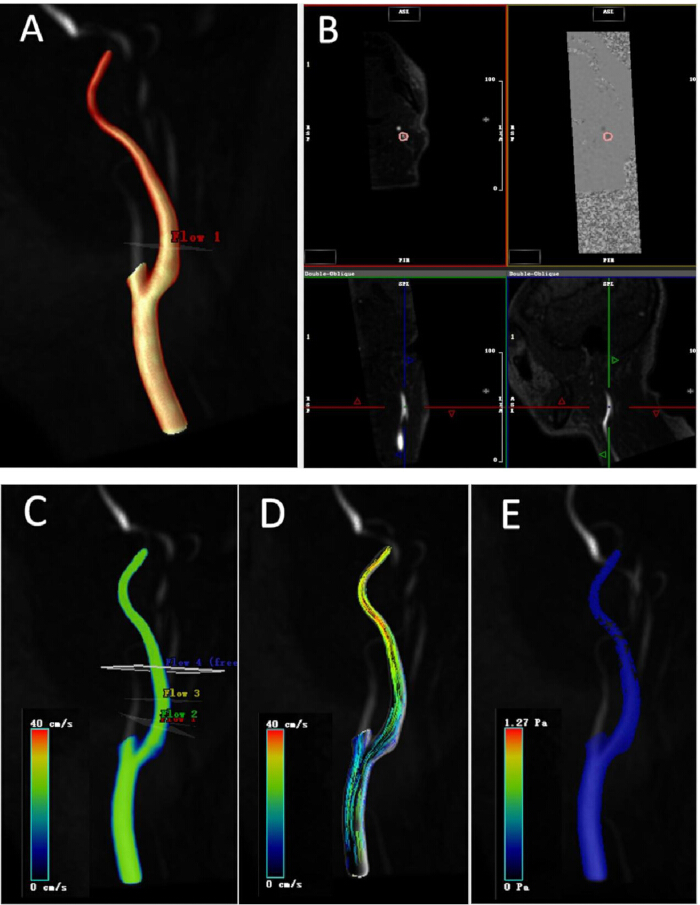
Figure 3: Three-dimensional reconstruction and hemodynamic analysis of the left internal carotid artery. (A) Three-dimensional volume-rendered reconstruction of the left carotid artery following vessel segmentation. (B) Positioning of the three cross-sectional analysis planes (Flow 1–3) along the C1 segment. (C) Flow velocity maps. (D) Vector diagrams showing flow direction. (E) Wall shear stress maps. Abbreviations: LICA = left internal carotid artery; WSS = wall shear stress. Please click here to view a larger version of this figure.
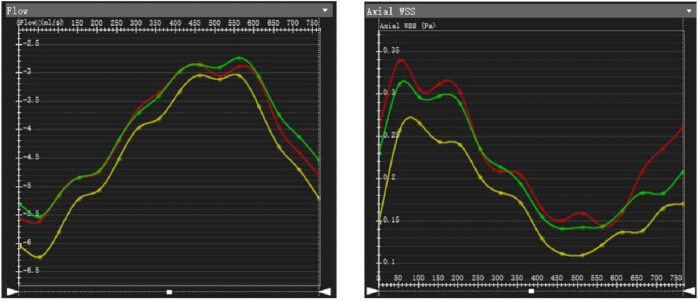
Figure 4: Left internal carotid artery post-processing curves. Time–flow curves (left panel) and time–wall shear stress curves (right panel) across one cardiac cycle. Different colors represent the three sampling planes (red, yellow, green). Abbreviations: LICA = left internal carotid artery; WSS = wall shear stress. Please click here to view a larger version of this figure.
Statistical analysis
Data were analyzed using standard statistical software (Table of Materials). Normally distributed variables, assessed by the Shapiro–Wilk test, were expressed as mean ± SD and compared by one-way ANOVA. Non-normally distributed variables were expressed as median (IQR) and compared by the Kruskal–Wallis test. Categorical variables were compared by the chi-square test. ANCOVA with age and education as covariates was used for intergroup comparisons, with Bonferroni correction for multiple comparisons. Spearman correlation and multiple linear regression assessed relationships between imaging and cognitive measures, adjusting for vascular risk factors (hypertension, diabetes, hyperlipidemia). Receiver operating characteristic (ROC) analysis was conducted to evaluate the diagnostic performance of each imaging parameter. The area under the curve (AUC), sensitivity, and specificity were calculated. ROC analyses were performed without covariate adjustment to evaluate the intrinsic discriminative performance of each parameter. However, given the observed group differences in age and education, supplemental analyses adjusting for these covariates yielded consistent findings. A two-tailed p < 0.05 was considered statistically significant. A complete list of materials and equipment used in this study is provided in the Table of Materials.
Access restricted. Please log in or start a trial to view this content.
Results
Clinical baseline information and cognitive scores
The cohort comprised 16 AD, 19 MCI, and 25 NC participants. Groups were comparable in gender, weight, height, BMI, cardiovascular risk factors, and heart rate (p > 0.05), but differed in age (p = 0.026) and years of education (p = 0.033) (Table 1). As expected, MMSE and MoCA total and sub-scores differed significantly among groups (all p < 0.001), with AD < MCI < NC (Table 2
Access restricted. Please log in or start a trial to view this content.
Discussion
By integrating 2D cine PC-MRI and 4D flow MRI, this study quantitatively evaluated alterations in CSF dynamics and cervical macrovascular hemodynamics across the AD spectrum, as well as their interplay. The principal findings can be summarized as follows: (1) Peak systolic and diastolic CSF flow velocities in the cerebral aqueduct were significantly reduced in patients with AD and MCI, and these reductions correlated with cognitive scores. (2) Maximum flow velocity and WSS in the LICA were significantly lower in the AD g...
Access restricted. Please log in or start a trial to view this content.
Disclosures
The authors have no relevant financial or non-financial interests to disclose.
Acknowledgements
Appreciation is extended to all participants and legal guardians for involvement in this study, and to the radiology technicians at Ningde Municipal Hospital for technical support. This work was supported by Ningde Normal University Medical College Integrated Development Special Research Project [grant numbers 2024ZX70] and the Fujian Health Technology Project, China [grant numbers 2022CXA060].
Access restricted. Please log in or start a trial to view this content.
Materials
| Name | Company | Catalog Number | Comments |
|---|---|---|---|
| 28-channel head-neck coil | GE Healthcare, Waukesha, WI, USA | Part of GE SIGNA Architect system; https://www.gehealthcare.com | Dedicated receive-only phased-array coil for combined head and neck imaging; employed for signal reception in all MRI sequences. |
| 2D cine phase-contrast MRI sequence (Fast PC Cine Slice) | GE Healthcare, Waukesha, WI, USA | Part of GE SIGNA Architect software package | 2D retrospectively gated phase-contrast sequence; used to quantify CSF flow velocity and stroke volume in the cerebral aqueduct. Parameters: Venc 12 cm/s, 20–30 phases/cardiac cycle, acquired perpendicular to the aqueduct. |
| 4D flow MRI sequence (Sag 4D Flow) | GE Healthcare, Waukesha, WI, USA | Part of GE SIGNA Architect software package | Time-resolved 3D phase-contrast sequence; used to capture spatially resolved hemodynamic data in the cervical carotid arteries. Parameters: Venc 50 cm/s, 20–30 phases/cardiac cycle, 40–50 slices. |
| CVI42 post-processing workstation (version 5.14) | Circle Cardiovascular Imaging, Calgary, Canada | https://www.circlecvi.com/cvi42/ | Dedicated cardiovascular and flow analysis software; used for vessel segmentation, ROI delineation, flow quantification (CSF and blood), and wall shear stress calculation. Version 5.14. |
| GE SIGNA Architect 3.0T MRI scanner | GE Healthcare, Waukesha, WI, USA | https://www.gehealthcare.com/products/magnetic-resonance-imaging/signa-architect | Whole-body 3.0T superconducting MRI system equipped with a 28-channel head-neck quadrature coil; used for all structural, 2D cine PC, and 4D flow acquisitions. |
| IBM SPSS Statistics (version 25) | IBM Corp., Armonk, NY, USA | SCR_002865; https://www.ibm.com/products/spss-statistics | Statistical analysis software; used for all descriptive statistics, group comparisons, correlations, regression analyses, and ROC curve analysis. Version 25. |
References
- Graff-Radford J, et al. New insights into atypical Alzheimer's disease in the era of biomarkers. The Lancet Neurology. 2021;20(3):222-34.
- Zhang XW, Zhu XX, Tang DS, Lu JH. Targeting autophagy in Alzheimer’s disease: Animal models and mechanisms. Zoological Research. 2023;44(6):1132-45.
- Muroni A, et al. Point prevalence of epilepsy in dementia: A "real-world" estimate. Epileptic Disorders. 2024.
- Shokri-Kojori E, et al. β-Amyloid accumulation in the human brain after one night of sleep deprivation. Proceedings of the National Academy of Sciences. 2018;115(17):4483-8.
- Chandra A., et al. Aquaporin-4 polymorphisms predict amyloid burden and clinical outcome in the Alzheimer's disease spectrum. Neurobiology of Aging. 2021;97:1-9.
- Iliff JJ, et al. A Paravascular Pathway Facilitates CSF Flow Through the Brain Parenchyma and the Clearance of Interstitial Solutes, Including Amyloid β. Science Translational Medicine. 2012;4(147).
- Wu C, et al. Continuous Theta-Burst Stimulation Promotes Paravascular CSF-Interstitial Fluid Exchange through Regulation of Aquaporin-4 Polarization in APP/PS1 Mice. Mediators of Inflammation. 2022;2022:1-12.
- Buchhave P. Cerebrospinal Fluid Levels of β-Amyloid 1-42, but Not of Tau, Are Fully Changed Already 5 to 10 Years Before the Onset of Alzheimer Dementia. Archives of General Psychiatry. 2012;69(1).
- Peng W, et al. Suppression of glymphatic fluid transport in a mouse model of Alzheimer's disease. Neurobiology of Disease. 2016;93:215-25.
- Ben-Nejma IRH, et al. Altered dynamics of glymphatic flow in a mature-onset Tet-off APP mouse model of amyloidosis. Alzheimer's Research & Therapy. 2023;15(1):23.
- Algin O, Hakyemez B, Parlak M. The Efficiency of PC-MRI in Diagnosis of Normal Pressure Hydrocephalus and Prediction of Shunt Response. Academic Radiology. 2010;17(2):181-7.
- Cavallin L, et al. Voxel-based correlation between coregistered single-photon emission computed tomography and dynamic susceptibility contrast magnetic resonance imaging in subjects with suspected Alzheimer's disease. Acta Radiologica. 2008;49(10):1154-61.
- Eskildsen SF, et al. Increased cortical capillary transit time heterogeneity in Alzheimer's disease: a DSC-MRI perfusion study. Neurobiology of Aging. 2017;50:107-18.
- Rivera-Rivera LA, et al. Changes in intracranial venous blood flow and pulsatility in Alzheimer’s disease: A 4D flow MRI study. Journal of Cerebral Blood Flow & Metabolism. 2016;37(6):2149-58.
- Korbecki A, et al. Imaging of cerebrospinal fluid flow: fundamentals, techniques, and clinical applications of phase-contrast magnetic resonance imaging. Polish Journal of Radiology. 2019;84:240-50.
- Vikner T, et al. CSF dynamics throughout the ventricular system using 4D flow MRI: associations to arterial pulsatility, ventricular volumes, and age. Fluids and Barriers of the CNS. 2024;21(1).
- Duck CJ, et al. Choroid Plexus Volume and Permeability at Brain MRI within the Alzheimer's Disease Clinical Spectrum. Radiology. 2022;304(3):212400.
- Tucker O, Samuel M, Bruce G, Scott F. Noninvasive Calculation of Cerebrospinal Fluid Production Using Phase-Contrast Magnetic Resonance Imaging: First Implementation in Augusta, Georgia. Cureus. 2023;15(5):e39686.
- Zhuang B, Sirajuddin A, Zhao S, Lu M. The role of 4D flow MRI for clinical applications in cardiovascular disease: current status and future perspectives. Quantitative Imaging in Medicine and Surgery. 2021;11(9):4193-210.
- Bradley WG, et al. Normal-pressure hydrocephalus: evaluation with cerebrospinal fluid flow measurements at MR imaging. Radiology. 1996;198(2):523-9.
- Bateman GA. Pulse-wave encephalopathy: a comparative study of the hydrodynamics of leukoaraiosis and normal-pressure hydrocephalus. Neuroradiology. 2002;44(9):740-8.
- El Sankari S, et al. Cerebrospinal fluid and blood flow in mild cognitive impairment and Alzheimer’s disease: a differential diagnosis from idiopathic normal pressure hydrocephalus. Fluids and Barriers of the CNS. 2011;8(1):1-12.
- Pahlavian SH, et al. Cerebroarterial pulsatility and resistivity indices are associated with cognitive impairment and white matter hyperintensity in elderly subjects: A phase-contrast MRI study. Journal of Cerebral Blood Flow & Metabolism. 2020;41(3):670-83.
- Rivera-Rivera LA, et al. Assessment of vascular stiffness in the internal carotid artery proximal to the carotid canal in Alzheimer’s disease using pulse wave velocity from low rank reconstructed 4D flow MRI. Journal of Cerebral Blood Flow & Metabolism. 2020;41(2):298-311.
- Karki P, et al. Real-time phase-contrast MRI to monitor cervical blood flow and CSF flow: a feasibility study. Magnetic Resonance in Medicine. 2022;87(2):966-77.
- Lee J, et al. The impact of breathing patterns on CSF flow and global brain BOLD signal while awake: A study using real-time phase-contrast MRI and fast rsfMRI. Alzheimer's & Dementia. 2023;19(S19).
- Lotz J, et al. In vitro validation of phase-contrast flow measurements at 3 T in comparison to 1.5 T: Precision, accuracy, and signal-to-noise ratios. Journal of Magnetic Resonance Imaging. 2005;21(5):604-10.
- Pan L, et al. Validating the accuracy of real-time phase-contrast MRI and quantifying the effects of free breathing on cerebrospinal fluid dynamics. Fluids and Barriers of the CNS. 2024;21(1):25.
- Greitz D, et al. Pulsatile brain movement and associated hydrodynamics studied by magnetic resonance phase imaging. Neuroradiology. 1993;35(5):350-5.
- Virhammar J, Laurell K, Cesarini KG, Larsson EM. Aqueductal CSF Stroke Volume Is Increased in Patients with Idiopathic Normal Pressure Hydrocephalus and Decreases after Shunt Surgery. AJNR Am J Neuroradiol. 2019;40(3):453-9.
- Balédent O, et al. Relationship Between Cerebrospinal Fluid and Blood Dynamics in Healthy Volunteers and Patients with Communicating Hydrocephalus. Investigative Radiology. 2004;39(1):45-55.
- Jennifer H, Asha S, Stephen L, Sumit P. Systematic Approach to Pediatric Macrocephaly. Radiographics. 2023;43(5):e220159.
- Takase H, et al. Transcriptomic Profiling Reveals Neuroinflammation in the Corpus Callosum of a Transgenic Mouse Model of Alzheimer's Disease. Journal of Alzheimer's Disease. 2024.
- Yamamoto R, et al. Effects of hippocampal atrophy and white matter lesions on cognitive function in Alzheimer’s disease. Alzheimer's & Dementia. 2023;19(S17).
- Yaqing L, Jiaxin Z, Tian L, Junjian Z. White Matter and Alzheimer's Disease: A Bidirectional Mendelian Randomization Study. Neurology and Therapy. 2022;11(2):881-92.
- Fang X, et al. Amyloid beta accumulation in TgF344-AD rats is associated with reduced cerebral capillary endothelial Kir2.1 expression and neurovascular uncoupling. GeroScience. 2023;45(5):2909-26.
- Pyne J, et al. Total and posterior cerebral blood flow is associated with white matter hyperintensity volume and Alzheimer ’s-like patterns of brain atrophy in older adults. Alzheimer's & Dementia. 2023;19(S17).
- Axel M, et al. Undetectable gadolinium brain retention in individuals with an age-dependent blood-brain barrier breakdown in the hippocampus and mild cognitive impairment. Alzheimer's & Dementia. 2019;15(12):1568-75.
- Sofia M, et al. Effects of Interventions on Cerebral Perfusion in the Alzheimer's Disease Spectrum: A Systematic Review. Aging Research Reviews. 2022;79:101661.
- Costantino I. The overlap between neurodegenerative and vascular factors in the pathogenesis of dementia. Acta Neuropathologica. 2010;120(3):287-96.
- Xie L, et al. Higher intracranial arterial pulsatility is associated with presumed imaging markers of the glymphatic system: An explorative study. NeuroImage. 2024;288.
- Erdélyi-Bótor S, et al. Serum L-arginine and dimethylarginine levels in migraine patients with brain white matter lesions. Cephalalgia. 2016;37(6):571-80.
- Odano I, et al. Diagnostic approach with Z-score mapping to reduce artifacts caused by cerebral atrophy in regional CBF assessment of mild cognitive impairment (MCI) and Alzheimer's disease by [99mTc]-ECD and SPECT. Japanese Journal of Radiology. 2024.
Access restricted. Please log in or start a trial to view this content.