This protocol describes the construction of a microfluidic BBB‑glioblastoma (BBB‑GBM) chip model. The model is validated for BBB integrity and enables investigation of low‑intensity ultrasound‑induced transient and largely reversible BBB opening, thereby allowing quantitative evaluation of ultrasound‑mediated nanomicelle transport across the BBB and tumor-targeting efficiency.
A subscription to JoVE is required to view this content. Sign in or start your free trial.
Method Article
Ultrasound-Controlled Blood-Brain Barrier (BBB) Opening in a BBB-Glioblastoma Microfluidic Chip for Drug Delivery Studies
* These authors contributed equally
In This Article
Summary
Abstract
The blood-brain barrier (BBB) is a major obstacle to treating glioblastoma (GBM) by restricting the entry of most therapeutic molecules into the brain. Interspecies differences in BBB structure and function complicate the clinical translation of animal models, highlighting the need for human-relevant in vitro BBB platforms for assessing drug permeability in GBM therapy. Here, a protocol is described for constructing a microfluidic BBB-GBM chip model. This model establishes a tri-culture system comprising human cerebral microvascular endothelial cells (HCMECs), primary astrocytes (ACs), and U87-MG cells within a Matrigel-embedded microfluidic platform. BBB integrity is verified through continuous zonula occludens-1 (ZO-1) immunostaining and FITC-dextran permeability assay. Low-intensity ultrasound (US) (1 MHz, 1 W/cm2, 30 s) is then employed to induce transient and largely reversible BBB opening, allowing tumor-targeting nanomicelles (SFN@RB@SPMs) to efficiently traverse the barrier and accumulate in GBM cells. A key feature of this protocol is the integration of real-time BBB permeability and drug delivery measurements within a single ultrasound-responsive chip, providing a powerful platform to dissect the mechanisms of ultrasound-augmented drug delivery in GBM.
Introduction
The treatment of glioblastoma (GBM) is strongly limited by the BBB, which severely limits the entry of nearly all therapeutic agents into the brain1,2. The BBB is formed by non-fenestrated endothelial cells joined by tight junction proteins (e.g., occludin, ZO-1), with additional support from pericytes and astrocytic end-feet3. Although animal models have provided valuable insights into BBB function, species-specific variations in physiology and metabolism limit their ability to accurately predict human drug responses4,5. Consequently, physiologically relevant human BBB models are indispensable for evaluating drug permeability in GBM therapy.
Traditional in vitro BBB models, such as the Transwell culture system, fail to recapitulate the complexity of the BBB, including cell-cell interaction, dynamic fluidic change, and flow-induced shear stress6. In contrast, microfluidic BBB models have emerged as superior platforms that closely mimic these in vivo-like characteristics7. Such BBB-on-a-chip systems have been widely used to study brain tumor metastasis8, investigate BBB dysfunction in neurodegenerative diseases such as Alzheimer’s disease9, and evaluate drug transport across the BBB10,11. However, most existing BBB-chip models are mainly used for drug permeability testing and lack the capability to incorporate external physical stimuli that modulate BBB permeability. Currently, focused ultrasound (FUS) has emerged as a promising strategy to transiently open the BBB with substantial recovery, enabling enhanced delivery of therapeutic agents to the brain12,13. Previous mechanistic studies have demonstrated that ultrasound-induced mechanical stimulation can transiently modulate barrier function by remodeling cell-cell junctions and enhancing endothelial permeability. For example, Silvani et al. showed that ultrasound-induced mechanical forces generated reversible interendothelial gap formation in in vitro vessel-on-a-chip14. Consistent with these findings, Beekers et al. demonstrated that ultrasound-mediated mechanical bioeffects induced a transient opening of endothelial cell-cell contacts, thereby increasing endothelial permeability15. More recently, Qiao et al. reported that endothelial barrier permeability is critically regulated by the ultrasound exposure parameters, particularly pulse length, emphasizing the importance of optimizing acoustic parameters to achieve safe and controllable BBB modulation16. Despite this progress, in vitro platforms that simultaneously allow quantitative analysis of ultrasound-mediated BBB opening and its impact on nanomedicine delivery remain limited.
To address the above gap, a protocol is presented for constructing a microfluidic BBB-GBM chip. The microfluidic device supports a tri-culture of HCMECs, primary ACs, and U87-MG GBM cells embedded in Matrigel. The reconstructed BBB exhibited both structural and functional characteristics of an intact barrier, demonstrated by continuous ZO-1 localization along intercellular junctions and limited diffusion of 40 kDa FITC-dextran across the vascular interface. Importantly, this chip can be coupled with controlled ultrasound stimulation to induce transient BBB opening, thereby enhancing the subsequent transport and tumor-targeting efficiency of nanomicelles. Using this system, the transport and tumor-targeting efficiency of nanomicelles SFN@RB@SPM can be quantitatively assessed. Overall, this platform provides a useful tool for studying the relationship between ultrasound parameters, BBB modulation with reversible characteristics, and enhanced nanomicelles delivery in GBM therapy.
Access restricted. Please log in or start a trial to view this content.
Protocol
All animal procedures adhered to the Guidelines (GB/T35892-2018) for Ethical Review of Experimental Animal Welfare and were approved by the Institutional Animal Care and Use Committee (IACUC) of Ningbo Institute of Life and Health Industry, UCAS (Approval No. GK-2023-XM-0073). The reagents and the equipment used are listed in the Table of Materials.
1. Fabrication and preparation of the BBB-GBM organ-on-a-chip device
- Chip design and photomask layout
- Design the chip using Auto CAD software.
NOTE: The chip consists of three parallel microfluidic channels, including a blood channel, a brain channel, and a tumor channel. The widths of the blood channel and tumor channel are both 1000 µm, while the width of the brain channel is 1300 µm. The height of the three channels is 150 µm, and adjacent channels are separated by trapezoid micropillar arrays with a width of 200 µm, which allow intercompartmental molecular diffusion and cellular communication. The detailed photomask design layout is provided in Supplementary Figure 1 and Supplementary Figure 2. The SU-8 photoresist used in the present study is 3050.
- Design the chip using Auto CAD software.
- Fabricate a silicon master mold using standard photolithography with SU-8 photoresist.
- Place a blank silicon wafer on the spin coater vacuum chuck and activate the vacuum to securely immobilize the wafer.
- Slowly dispense 10 mL of SU-8 photoresist onto the center of the wafer.
- Perform a two-step spin-coating process to obtain a uniform photoresist layer: first at 500 rpm for 10 s, then at 2500 rpm for 90 s.
- Transfer the coated wafer to a hot plate and perform a soft bake at 95 °C for 30 min to evaporate the solvent.
- Allow the wafer to cool to room temperature and measure the thickness of the SU-8 layer using a thickness gauge.
NOTE: For optimal BBB formation, a channel height of 110–150 µm is recommended. A single spin-coat (step 1.2.3) typically yields a film thickness of 40–50 µm; therefore, two to three spin-coating processes are required to reach the desired total thickness.
- Photolithographic patterning
- Set the ultraviolet (UV) light intensity of the mask aligner to 14–15 mW/cm2.
- Align the chromium photomask with the SU-8-coated silicon wafer and perform UV exposure for 10 s.
- Immediately transfer the silicon wafer to a hot plate for post-exposure baking under the following conditions: 65 °C for 10 s, followed by 95 °C for 300 s.
- After the silicon wafer has cooled to room temperature, immerse it in developer solution (propylene glycol monomethyl ether acetate, PGMEA) and allow it to develop for 4–6 min.
- Rinse the wafer with isopropanol to terminate development, followed by washing with deionized water.
- Dry the wafer using nitrogen gas and inspect the patterned microchannel structures under an optical microscope.
NOTE: If undeveloped photoresist residues remain, repeat the developing step until the microstructures are clearly defined. - Bake the completed silicon master in an oven at 200 °C for 1 h to improve adhesion between the SU-8 photoresist and the silicon wafer surface.
- PDMS chip fabrication
- Prepare polydimethylsiloxane (PDMS) by thoroughly mixing the base prepolymer and curing agent at a 10:1 weight ratio (w/w) for 30 min to obtain a homogeneous PDMS prepolymer.
- Pour the PDMS mixture onto the fabricated silicon master mold, ensuring that the microstructures are fully covered.
- Place the master mold in a vacuum desiccator for degassing to remove air bubbles.
- Transfer the master mold to an oven and cure it at 65 °C for 1.5–2 h.
- After curing, carefully cut the PDMS layer along the chip boundaries using a craft knife and gently peel it from the silicon master mold.
- Immerse the PDMS chip in 70%–75% ethanol for 30 min for preliminary sterilization, then rinse with deionized water and allow to air-dry.
- Punch inlet and outlet ports using a 2 mm biopsy punch.
- Plasma bonding and device assembling
- Place the PDMS chip and a clean glass slide into the chamber of a plasma cleaner, ensuring that the microchannel side of the PDMS is facing upward.
- Evacuate the chamber until the pressure drops below 30 Pa, then introduce oxygen gas.
- Maintain the oxygen flow for 90 s while keeping the chamber pressure below 40 Pa.
- Set the Radio Frequency (RF) power to 55% and perform plasma treatment for 90 s to activate the PDMS and glass surfaces.
- Immediately bring the activated PDMS chip into contact with the glass slide and gently press to achieve irreversible bonding.
- Place the assembled device in an oven at 65 °C for 24 h to stabilize the bonding and restore its hydrophobicity.
- Prior to cell seeding, sterilize the bonded device by ultraviolet irradiation for 30 min.
NOTE: Maintain sterile conditions by storing the sterilized chips in sealed Petri dishes inside a biosafety cabinet until use.
2. Cell seeding and establishment of the BBB-GBM model
- Prepare the following reagents:
- ACs culture medium (for the brain channel): DMEM/F12 basal medium containing 20% fetal bovine serum (FBS) and 1% penicillin/streptomycin (P/S).
- HCMECs culture medium (for the vascular channel): Endothelial cell medium (ECM) supplemented with 1% P/S.
- GBM cell culture medium (for the glioma channel): MEM basal medium containing 10% FBS and 1% P/S.
- Cell dissociation reagent: Use 0.25% trypsin-EDTA solution for detaching adherent cells.
NOTE: Prolonged exposure to trypsin may reduce cell viability. Monitor cell detachment under a microscope and neutralize trypsin promptly with complete medium. - Maintain all cells (ACs, HCMECs, and U87-MG) in 100 mm-culture dishes prior to seeding into the microfluidic device.
- Primary ACs isolation
- Isolate primary ACs from cerebral cortices of neonatal rats (postnatal day 1–3). After carefully removing the meninges and blood vessels on ice, mince the cortical tissue with sterile surgical scissors and subject it to enzymatic digestion.
- Wash the dissociated cell suspension with ice-cold PBS, and treat with trypsin to achieve single-cell dissociation, and collect the pellets by centrifugation (400 x g, 5 min, room temperature).
- Resuspend the cells and seed them into T25 culture flasks containing ACs culture medium.
- Identify the ACs by GFAP through immunofluorescence staining. The image is provided in Supplementary Figure 3.
- Cell seeding
NOTE: Day 1 - Seeding of ACs in the brain channel.- Introduce 1 mL of 0.25% trypsin-EDTA into the ACs-containing culture dish. Gently swirl to ensure even coverage.
- Incubate at 37 °C for 1–2 min until the cells detach from the culture dish.
- Add 3 mL ACs culture medium (from step 2.1.1) to neutralize trypsin. Pipette gently to obtain a single-cell suspension.
- Collect the cell suspension into a centrifuge tube and centrifuge at 300 × g for 3 min at 4 °C.
- Remove the supernatant and resuspend the cell pellet in 200 µL of AC medium.
- Determine the cell concentration using an automated cell counter and adjust the density to 2.5 × 10⁶ cells/mL.
- Mix the ACs cell suspension with Matrigel at a 3:5 (v/v) ratio (AC cells: Matrigel).
- Using a micropipette, dispense 10 µL of the Matrigel-ACs mixture into the brain channel.
NOTE: Perform the loading procedure with the chip maintained on ice to prevent premature Matrigel polymerization. - Incubate the chip at 37 °C in a 5% CO2 incubator for 30 min to allow Matrigel polymerization and cell stabilization.
NOTE: Day 1 - Seeding of HCMECs in the vascular channel. - Apply 1 mL of 0.25% trypsin-EDTA and incubate at 37 °C for approximately 30 s until cells detach.
- Add 3 mL of HCMECs medium (step 2.1.2) to stop the enzymatic digestion.
- Pipette gently to generate a uniform single-cell suspension.
- Collect the suspension and centrifuge at 300 × g for 3 min at 4 °C.
- Remove the supernatant and resuspend the cell pellet in 200 µL of HCMECs medium.
- Count the cells and adjust the concentration to 2 × 10⁶ cells/mL.
- Carefully introduce 10 µL of the HCMECs suspension into the vascular channel of the chip.
- Position the chip sideways for 30 min in the cell incubator to promote endothelial cell attachment along the channel wall.
- Seed an additional 10 µL of HCMECs suspension into the vascular channel to increase endothelial density in the vascular channel.
- Incubate the chip for an additional 30–60 min to allow HCMECs adhesion.
- Add 100 µL mixed culture medium to the chip inlet.
NOTE: The mixed medium consists of AC medium and HCMECs medium at a 1:1 ratio (v/v).
Day 3 - Seeding of U87-MG cells in the glioma channel. - Add 1 mL of 0.25% trypsin-EDTA to the culture dish and incubate at 37 °C for 1–2 min.
- Add 3 mL of U87-MG medium (from step 2.1.3) to terminate digestion.
- Pipette gently to obtain a homogeneous single-cell suspension.
- Transfer the cell suspension to a centrifuge tube and centrifuge at 300 × g for 3 min.
- Discard the supernatant and resuspend the cell pellet in 200 µL of U87-MG medium.
- Count the cell concentration and adjust the density to 2 × 10⁶ cells/mL.
- Introduce 10 µL of the U87-MG cell suspension into the glioma channel of the chip.
- Incubate the chip in a 37 °C with 5% CO2 for 30–60 min to allow cell attachment.
- Add 100 µL of U87-MG culture medium to the chip inlet.
- Maintain the microfluidic device in a 37 °C environment with 5% CO2 for an additional 48 h to allow endothelial tight junction formation.
3. Evaluation of the BBB integrity
- Permeability assay
- Prepare fluorescein isothiocynate-dextran (FITC-dextran) with molecular weights of 40 kDa in mixed culture medium (ACs medium: HCMEC medium = 1:1, v/v) at a final concentration of 10 µg/mL.
- Introduce 10 µL of the FITC-Dextran solution into the vascular channel.
- Place the microfluidic chip on the stage of an inverted fluorescence microscope to acquire fluorescence images of both the vascular channel and the adjacent brain channel at 20 min intervals to monitor dextran diffusion across the endothelial barrier.
- Quantify the permeability coefficient (Papp, cm/s) using the following formula:
Papp (cm/s)=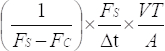
Where Papp is the apparent permeability coefficient (cm/s), FS is the fluorescence intensity at the initial time in the blood channel, FC is the fluorescence intensity in the brain channel at the end of the diffusion interval, Δt is the diffusion time (s), VT is the diffusion volume of FITC-dextran in the brain channel (cm3), and A is the endothelial surface area (cm2).
NOTE: A lower permeability coefficient indicates higher BBB integrity and tighter endothelial barrier formation. - Perform data analysis and parameter definitions.
NOTE: Fluorescence intensity values from both blood and brain channels were background-subtracted using measurements obtained from cell-free regions of the chip. ROIs were defined on both sides of the blood-brain interface based on the fluorescence diffusion length. The endothelial surface area (A) was calculated from the interface area between the vascular and brain channels (using a gap between two micropillars as a reference): 200 µm × 150 µm = 30,000 µm2 = 3 × 10⁻⁶ cm2. The FITC-dextran diffusion volume (VT) was derived from the diffusion penetration distance in the brain channel multiplied by A. Fluorescence images were acquired every 20 min (1200 s) over a 60-min period; the permeability coefficient was calculated using the 20-min interval data. Permeability values were calculated from three independent chips for each experimental group. All unit conversions were performed before expressing permeability as cm/s.
- Immunofluorescence analysis of ZO-1
- Wash the microfluidic channels three times with phosphate-buffered saline (PBS) to remove remaining culture medium.
- Fix the cells by introducing 4% paraformaldehyde (PFA) into the channels and incubating for 10 min at room temperature.
- Permeabilize the cells with 0.1% Triton X-100 in PBS for 15 min at room temperature.
- Block nonspecific antibody binding by incubating the channels with 2% bovine serum albumin (BSA) in PBS for 45 min at room temperature.
- Introduce the anti-ZO-1 primary antibody (1:200 dilution) into the channels and incubate at 4 °C overnight.
- Wash the channel thoroughly with PBS to remove unbound primary antibody.
- Incubate the chips with an Alexa Fluor 555-conjugated anti-rabbit secondary antibody (1:1000 dilution) for 45 min at room temperature in the dark.
- Counterstain the nuclei with 1 µg/mL 4’6-diamidino-2-phenylindole (DAPI) for 1 min at room temperature in the dark.
NOTE: DAPI is light sensitive and should be protected from light during staining. - Wash the channels three times with PBS.
- Image the microfluidic device using an inverted fluorescence microscope and a confocal laser scanning microscope to visualize ZO-1 localization along the endothelial cell junction.
4. Ultrasound-enhanced nanomicelles delivery across the BBB to GBM cells
- Ultrasound stimulation
- Carefully take the chip out of the culture dish and place it inside a biosafety cabinet.
- Apply ultrasound stimulation using a therapeutic ultrasound system equipped with a 1 MHz transducer (effective radiating area: 5 cm2).
- Apply a 3 mm thick medical-grade acoustic coupling pad between the ultrasound probe and the surface of the microfluidic chip to ensure efficient acoustic transmission.
- Position the ultrasound probe directly above the vascular channel region of the microfluidic device.
NOTE: Air bubbles between the transducer and the chip significantly reduce acoustic energy transmission and should be avoided. - Set the ultrasound parameters as follows: duty cycle: 60%; frequency: 1 MHz; intensity: 1 W/cm2; exposure duration: 30 s; pulse repetition frequency (PRF): 100 Hz. The detailed ultrasound parameters are provided in Supplementary Table 1.
- For the untreated control group, place the ultrasound transducer in the same position but ensure to keep inactive to serve as a sham control, ensuring identical handling procedures without acoustic exposure.
- After ultrasound exposure, remove the coupling pad and immediately return the chip to a sterile culture dish.
- Add fresh culture medium to the inlet ports of the chip.
- Incubate the device at 37 °C with 5% CO2 until further analysis.
- Evaluation of ultrasound-induced BBB modulation
- Perform ZO-1 immunofluorescence staining immediately after ultrasound treatment (0 h) and at 24 h post-treatment to assess changes in tight junction integrity.
- Follow the immunofluorescence staining procedure described in step 3.2.
- Compare the ZO-1 staining distribution along the z-axis to evaluate the effect of ultrasound stimulation on BBB tight junction integrity.
- Preparation and characterization of SFN@RB@SPM nanomicelles
- Prepare the SFN@RB@SPM nanomicelles according to the previously established protocol17. Briefly, stock solutions of the amphiphilic peptide (designated as SPM, 6 mg/mL), RB (0.6 mg/mL), and SFN (6 mM) were mixed at a volume ratio of 1:1:1.
- Place the mixture in a sonicator and sonicate at 28 kHz, 25 °C for 30 min.
- Dialyze the mixture (molecular weight cut-off: 1000 Da) for 48 h to remove free RB and SFN.
- Measure the size and zeta potential of the nanomicelles by dynamic light scattering (DLS). The characterization data are provided in Supplementary Figure 4.
- Evaluation of ultrasound-stimulated nanomicelles delivery and glioma cell accumulation
- Immediately following ultrasound exposure, introduce the nanomicelles-containing culture medium into the vascular channel of the microfluidic device.
- To evaluate nanomicelles transport across the BBB, place the microfluidic chip on the stage of an inverted fluorescence microscope and acquire fluorescence images of both the vascular channel and the adjacent brain channel at 20 min intervals over 60 min.
- Quantify the fluorescence images in the brain channel to evaluate ultrasound-enhanced nanomicelles permeability.
- To assess nanomicelles accumulation in glioma cells, incubate the device under standard culture conditions (37 °C, 5% CO2) for 3 h after ultrasound exposure, then image the glioma channel using a fluorescence microscope to evaluate intracellular nanomicelles uptake.
- Statistical analysis
- Express all quantitative data as mean±standard error of the mean (SEM).
- Perform each experiment with three independent biological replicates (n = 3 chips per experimental condition). For each biological replicate, at least three technical replicates (ROI per channel) were measured to ensure data reliability.
- Calculate the permeability coefficient (Papp, cm/s) from each independent chip served as the primary unit of analysis for all statistical comparisons.
NOTE: Comparisons between two groups were performed using an unpaired two-tailed Student’s t-test. Comparisons among three or more groups were analyzed using one-way analysis of variance (ANOVA) followed by Tukey’s post hoc test for multiple comparisons. For experiments involving two independent variables, two-way ANOVA followed by Tukey’s multiple comparisons test was performed. Statistical analyses were conducted using statistical and graphing software. A p-value of <0.05 was considered statistically significant.
Access restricted. Please log in or start a trial to view this content.
Results
To recapitulate the in vivo structure of the BBB, a tri-culture microfluidic chip was developed by incorporating HCMECs, primary ACs, and U87-MG cells (termed the “chip model”). As shown in Figure 1A,B, three parallel channels are arranged within the device: the vascular (left, blue), the Matrigel-filled brain (central, pink), and the tumor (right, green) channels, which are seeded with HCMECs, ACs, and U87-MG cells, respectively. The channels are separated by micro...
Access restricted. Please log in or start a trial to view this content.
Discussion
This protocol describes the establishment of a microfluidic BBB-GBM chip for evaluating ultrasound-mediated BBB modulation and nanomicelle delivery. Compared with conventional in vitro BBB models (e.g., Transwell), this microfluidic platform allows spatially defined co-culture of endothelial cells, ACs, and glioma cells, thereby enabling investigation of drug transport across a physiologically relevant BBB. Several critical steps in the protocol require careful optimization to ensure reliable barrier formation. ...
Access restricted. Please log in or start a trial to view this content.
Disclosures
During the preparation of this manuscript, the authors used ChatGPT (OpenAI) for language editing and improvement only. The authors have reviewed and edited all AI-assisted content and take full responsibility for the accuracy and integrity of the manuscript. No AI tools were used for data generation, analysis, or figure preparation.
Acknowledgements
We gratefully acknowledge funding from Zhejiang Provincial Natural Science Foundation (LQ24H160003), the Medical Scientific Research Foundation of Zhejiang Province (2024KY351), the Ningbo Natural Science Foundation (2023J365), the Yongjiang Talent Introduction Programme (Young Innovative Talent Project, 2021A-012-G), and the Bei’An Talent Programme of Jiangbei District, Ningbo (2023RC004).
Access restricted. Please log in or start a trial to view this content.
Materials
| Name | Company | Catalog Number | Comments |
|---|---|---|---|
| Alexa Fluor 555-conjugated anti-rabbit secondary antibody | Cell Signaling Technology, Inc. | 4413 | |
| anti-ZO-1 antibody | Thermo Fisher Scientific Co., Ltd. | 40-2200 | |
| Biopsy punch | Zhejiang YoungChip Technology Co., Ltd. | 10305130004 | |
| Bovine serum albumin | Absin Bioscience Inc. | 9048-46-8 | |
| Cell counter | Thermo Fisher Scientific Co., Ltd. | Countess TM3 | |
| Cell culture dish (100 mm) | Corning Inc. | 430167 | |
| Centrifuge | Beckman Coulter, Inc. | Avanti J-15R | |
| Chrome mask | Suzhou Chip Scientific Instrument Co.,Ltd. | ZX-GBYM | |
| Confocal Laser Scanning Microscope | Carl Zeiss AG | Zeiss LSM900 | |
| DAPI | Beyotime Biotech Inc. | C1002 | |
| Developer | Suzhou Chip Scientific Instrument Co., Ltd. | RCD-400 | |
| DMEM/F12 | ScienCell Research Laboratories | C3130-0500 | |
| ECM | ScienCell Research Laboratories | 1001 | |
| Ethanol | Ningbo Zhenhai Yongfeng Chemical Plant | 6923193900015 | |
| Fetal bovine serum | ScienCell Research Laboratories | C04001-500 | |
| Fiji (Fiji Is Just ImageJ) | Open-source project | N/A | |
| FITC-Dextran (40 kDa) | Thermo Fisher Scientific Co., Ltd. | GC19938 | |
| Glass slides | Citotest Scientific Co., Ltd. | 188105W | |
| Graphpad prism 9.5 | GraphPad Software, Inc. | N/A | |
| Human Cerebral microvascular endothelial cells (HCMECs) | BeNa Culture Collection | BNCC337717 | |
| Incubator | Esco Lifesciences Co., Ltd | CLM-170B-8-CN | |
| Inverted fluorescence microscope | Nikon Instruments Inc. | TS2-FL | |
| Isopropanol | Sinopharm Chemical Reagent Co., Ltd. | 80109218 | |
| Matrigel | Corning Inc. | 354234 | |
| MEM | Pricella Life Science & Technology Co., Ltd. | PM150410 | |
| Nitrogen | Ningbo Baifang Gas CO., Ltd. | N/A | |
| Oxygen | Ningbo Baifang Gas CO., Ltd. | N/A | |
| Paraformaldehyde (PFA, 4%) | Wuhan Servicebio Technology Co., Ltd. | G1101-500mL | |
| PBS | ScienCell Research Laboratories | C3580-0500 | |
| PDMS | Corning Inc. | 220777 | |
| Penicillin/streptomycin | Pricella Life Science & Technology Co., Ltd. | PB180120 | |
| Photolithography | Institute of Optics and Electronics,Chinese Academy of Sciences | URE-2000\AL | |
| Photolithography Hot Plate | Suzhou Wenhao Microfluidic Technology Co., Ltd. | WH-HP-02 | |
| Plasma Asher | TIANKECHUANGDA Co., Ltd. | PT-05-LF | |
| Primary astrocytes | N/A | N/A | Isolated from neonatal rat (Day1-3) brain |
| Silicon wafer | Zhejiang YoungChip Technology Co., Ltd. | 10204040001 | |
| Spin Coater | Suzhou Wenhao Microfluidic Technology Co., Ltd. | WH-SC-01 | |
| SU-8 | Kayaku Advanced Materials Inc. | 1030403002 | |
| Triton X-100 | Beijing Solarbio Science & Technology Co., Ltd. | 9002-93-1 | |
| Trypsin | ScienCell Research Laboratories | C3530-0100 | |
| U87-MG cells | Pricella Life Science & Technology Co., Ltd. | CL-0238 | |
| Ultrasound device | Shenzhen Dongdixin Technology Co., Ltd. | Sonic-Stimu Pro UT1041 | |
| Zen3.4(blue edition) | Carl Zeiss AG | N/A |
References
- Narsinh KH, Perez E, Haddad AF, Young JS, Savastano L, Villanueva-Meyer JE, et al. Strategies to improve drug delivery across the blood-brain barrier for glioblastoma. Curr Neurol Neurosci Rep. 2024;24(5):123-139.
- Xie Y, Yang F, He L, Huang H, Chao M, Cao H, et al. Single-cell dissection of the human blood-brain barrier and glioma blood-tumor barrier. Neuron. 2024;112(18):3089-105 e7.
- Scalise AA, Kakogiannos N, Zanardi F, Iannelli F, Giannotta M. The blood-brain and gut-vascular barriers: from the perspective of claudins. Tissue Barriers. 2021;9(3):1926190.
- Sivandzade F, Cucullo L. In-vitro blood-brain barrier modeling: A review of modern and fast-advancing technologies. J Cereb Blood Flow Metab. 2018;38(10):1667-1681.
- Shawahna R, Decleves X, Scherrmann JM. Hurdles with using in vitro models to predict human blood-brain barrier drug permeability: a special focus on transporters and metabolizing enzymes. Curr Drug Metab. 2013;14(1):120-136.
- Oddo A, Peng B, Tong Z, Wei Y, Tong WY, Thissen H, et al. Advances in Microfluidic Blood-Brain Barrier (BBB) Models. Trends Biotechnol. 2019;37(12):1295-1314.
- Hajal C, Offeddu GS, Shin Y, Zhang S, Morozova O, Hickman D, et al. Engineered human blood-brain barrier microfluidic model for vascular permeability analyses. Nat Protoc. 2022;17(1):95-128.
- Xu H, Li Z, Yu Y, Sizdahkhani S, Ho WS, Yin F, et al. A dynamic in vivo-like organotypic blood-brain barrier model to probe metastatic brain tumors. Sci Rep. 2016;6:36670.
- Park J, Wetzel I, Marriott I, Dreau D, D'Avanzo C, Kim DY, et al. A 3D human triculture system modeling neurodegeneration and neuroinflammation in Alzheimer's disease. Nat Neurosci. 2018;21(7):941-951.
- Park TE, Mustafaoglu N, Herland A, Hasselkus R, Mannix R, FitzGerald EA, et al. Hypoxia-enhanced Blood-Brain Barrier Chip recapitulates human barrier function and shuttling of drugs and antibodies. Nat Commun. 2019;10(1):2621.
- Peng B, Tong Z, Tong WY, Pasic PJ, Oddo A, Dai Y, et al. In situ surface modification of microfluidic blood-brain-barriers for improved screening of small molecules and nanoparticles. ACS Appl Mater Interfaces. 2020;12(51):56753-56766.
- Mainprize T, Lipsman N, Huang Y, Meng Y, Bethune A, Ironside S, et al. Blood-brain barrier opening in primary brain tumors with non-invasive MR-guided focused ultrasound: a clinical safety and feasibility study. Sci Rep. 2019;9(1):321.
- Adriani G, Ma D, Pavesi A, Kamm RD, Goh EL. A 3D neurovascular microfluidic model consisting of neurons, astrocytes and cerebral endothelial cells as a blood-brain barrier. Lab Chip. 2017;17(3):448-459.
- Silvani G, Scognamiglio C, Caprini D, Marino L, Chinappi M, Sinibaldi G, et al. Reversible cavitation-induced junctional opening in an artificial endothelial layer. Small. 2019;15(51):e1905375.
- Beekers I, Vegter M, Lattwein KR, Mastik F, Beurskens R, van der Steen AFW, et al. Opening of endothelial cell-cell contacts due to sonoporation. J Control Release. 2020;322:426-438.
- Qiao C, Luo S, Liu Z, Bu Y, Cai Y, Liu Z, et al. Tuning endothelial barrier permeability with ultrasound: a pulse-length-dependent interplay between bubble dynamics and cellular bioeffects. Ultrason Sonochem. 2026;129:107851.
- Li Y, Yang X, Wei Z, Niu H, Wu L, Chen C, et al. Sulforaphane wrapped in self-assembled nanomicelle enhances the effect of sonodynamic therapy on glioma. Pharmaceutics. 2024;17(1):34.
- Yuan W, Lv Y, Zeng M, Fu BM. Non-invasive measurement of solute permeability in cerebral microvessels of the rat. Microvasc Res. 2009;77(2):166-173.
- Lee SWL, Campisi M, Osaki T, Possenti L, Mattu C, Adriani G, et al. Modeling nanocarrier transport across a 3D in vitro human blood-brain-barrier microvasculature. Adv Healthc Mater. 2020;9(7):e1901486.
- Mehta RI, Carpenter JS, Mehta RI, Haut MW, Ranjan M, Najib U, et al. Blood-brain barrier opening with MRI-guided focused ultrasound elicits meningeal venous permeability in humans with early Alzheimer disease. Radiology. 2021;298(3):654-662.
- Cho H, Seo JH, Wong KH, Terasaki Y, Park J, Bong K, et al. Three-dimensional blood-brain barrier model for in vitro studies of neurovascular pathology. Sci Rep. 2015;5:15222.
- Campisi M, Shin Y, Osaki T, Hajal C, Chiono V, Kamm RD. 3D self-organized microvascular model of the human blood-brain barrier with endothelial cells, pericytes and astrocytes. Biomaterials. 2018;180:117-129.
- Wang YI, Abaci HE, Shuler ML. Microfluidic blood-brain barrier model provides in vivo-like barrier properties for drug permeability screening. Biotechnol Bioeng. 2017;114(1):184-194.
- Jiang L, Li S, Zheng J, Li Y, Huang H. Recent progress in microfluidic models of the blood-brain barrier. Micromachines (Basel). 2019;10(6):375.
- Bonkowski D, Katyshev V, Balabanov RD, Borisov A, Dore-Duffy P. The CNS microvascular pericyte: pericyte-astrocyte crosstalk in the regulation of tissue survival. Fluids Barriers CNS. 2011;8(1):8.
- Hurtado-Alvarado G, Cabanas-Morales AM, Gomez-Gonzalez B. Pericytes: brain-immune interface modulators. Front Integr Neurosci. 2014;7:80.
- Santa-Maria AR, Walter FR, Figueiredo R, Kincses A, Vigh JP, Heymans M, et al. Flow induces barrier and glycocalyx-related genes and negative surface charge in a lab-on-a-chip human blood-brain barrier model. J Cereb Blood Flow Metab. 2021;41(9):2201-2215.
- van der Helm MW, van der Meer AD, Eijkel JC, van den Berg A, Segerink LI. Microfluidic organ-on-chip technology for blood-brain barrier research. Tissue Barriers. 2016;4(1):e1142493.
- Alluri H, Peddaboina CS, Tharakan B. Evaluation of tight junction integrity in brain endothelial cells using confocal microscopy. Methods Mol Biol. 2024;2711:257-262.
- Nitta T, Hata M, Gotoh S, Seo Y, Sasaki H, Hashimoto N, et al. Size-selective loosening of the blood-brain barrier in claudin-5-deficient mice. J Cell Biol. 2003;161(3):653-660.
- Ben-Zvi A, Lacoste B, Kur E, Andreone BJ, Mayshar Y, Yan H, et al. Mfsd2a is critical for the formation and function of the blood-brain barrier. Nature. 2014;509(7501):507-511.
- Andreone BJ, Chow BW, Tata A, Lacoste B, Ben-Zvi A, Bullock K, et al. Blood-brain barrier permeability is regulated by lipid transport-dependent suppression of caveolae-mediated transcytosis. Neuron. 2017;94(3):581-594 e5.
Access restricted. Please log in or start a trial to view this content.
Reprints and Permissions
This article has been published
Video Coming Soon