This retrospective diagnostic-accuracy study evaluated MSK-US against MRI for hemophilic arthropathy in 150 patients, with one representative joint analyzed per patient. MSK-US demonstrated high sensitivity and performed best for synovial abnormalities, whereas MRI remained superior for detecting structural damage. Findings reflect a clinically selected cohort with a high prevalence of arthropathy.
Research Article
Retrospective Comparison of Musculoskeletal Ultrasound and Magnetic Resonance Imaging for Detecting Hemophilic Arthropathy
Opens in a new tab
In This Article
Summary
Loading...
$$\rightleftharpoonup{xx}$$
$$\longleftharp{xx}$$,
$$\longrightharp{xx}$$,
Abstract
Loading...
$$\rightleftharpoonup{xx}$$
$$\longleftharp{xx}$$,
$$\longrightharp{xx}$$,
Hemophilic arthropathy is a major cause of morbidity in patients with hemophilia, resulting from recurrent joint bleeding and progressive synovial and osteochondral damage. Although magnetic resonance imaging (MRI) is the reference standard for evaluating hemophilic joints, its routine use is limited by cost and accessibility. Musculoskeletal ultrasound (MSK-US) has emerged as a practical alternative; however, its diagnostic performance relative to MRI requires further evaluation. The objective of this study is to evaluate the diagnostic accuracy of MSK-US for detecting hemophilic arthropathy using MRI as the reference standard. This retrospective diagnostic accuracy study included 150 patients with hemophilia who underwent both MSK-US and MRI of the same joint within a three-month interval. Ultrasound positivity was defined as the presence of at least one abnormal feature (synovial hypertrophy, joint effusion, cartilage damage, or bone erosion). Sensitivity, specificity, positive predictive value (PPV), negative predictive value (NPV), likelihood ratios, and Cohen’s kappa were calculated. ROC analysis was performed using HEAD-US scores. MSK-US demonstrated a sensitivity of 91.1%, specificity of 78.9%, PPV of 92.7%, NPV of 75.0%, and overall accuracy of 88.0%. Agreement with MRI was good for synovial hypertrophy (κ = 0.72) and joint effusion (κ = 0.69), and moderate for cartilage damage (κ = 0.58) and bone erosion (κ = 0.55). ROC analysis showed good overall diagnostic performance (AUC = 0.86; 95% CI, 0.80–0.91). Diagnostic performance was highest for synovial abnormalities and lower for structural joint damage. MRI-confirmed arthropathy was present in 74.7% of patients, reflecting a selected cohort with a high prevalence of joint pathology. In this selected retrospective cohort, MSK-US demonstrated good diagnostic performance for detecting hemophilic arthropathy, particularly synovial abnormalities. MSK-US may serve as a complementary tool for clinical assessment, triage, and longitudinal monitoring, while MRI remains important for comprehensive evaluation of structural joint damage.
Introduction
Loading...
$$\rightleftharpoonup{xx}$$
$$\longleftharp{xx}$$,
$$\longrightharp{xx}$$,
Hemophilia is a hereditary bleeding disorder caused by a deficiency of clotting factor VIII or IX, leading to recurrent bleeding episodes, most commonly into joints. Repeated hemarthrosis initiates a cascade of synovial inflammation, hypertrophy, and progressive cartilage and bone destruction, ultimately resulting in hemophilic arthropathy, a major cause of chronic pain and disability in affected individuals1,2. Despite advances in prophylactic therapy and the introduction of newer non-factor therapies, joint disease remains prevalent, particularly among patients with prior bleeding exposure, delayed initiation of prophylaxis, or limited access to sustained treatment3,4,5. Early detection of joint involvement is therefore critical to guide timely intervention, optimize prophylactic strategies, and prevent irreversible structural damage.
Magnetic resonance imaging (MRI) is widely regarded as the reference standard for evaluating hemophilic arthropathy because of its excellent soft tissue contrast and ability to detect early pathological changes, including synovial proliferation, hemosiderin deposition, and osteochondral lesions6,7. MRI-based scoring systems, such as the International Prophylaxis Study Group (IPSG) scale, allow detailed assessment of disease severity. However, the routine use of MRI in clinical practice is constrained by high cost, limited accessibility, longer examination times, and the need for sedation in pediatric patients. These limitations restrict its use for frequent monitoring, which is often required in longitudinal hemophilia care.
Musculoskeletal ultrasound (MSK-US) has emerged as a practical alternative imaging modality due to its accessibility, cost-effectiveness, and ability to provide real-time, dynamic assessment of joints. Ultrasound is particularly effective in detecting synovial hypertrophy and joint effusion and can be performed at the point of care without radiation exposure8,9. The introduction of standardized approaches, such as the hemophilia early arthropathy detection with ultrasound (HEAD-US) scoring system, has improved the reproducibility and clinical applicability of ultrasound in this setting10, facilitating its integration into routine clinical workflows. It is important to distinguish formal diagnostic MSK-US from point-of-care ultrasound (POCUS). Diagnostic MSK-US involves comprehensive image acquisition and interpretation using standardized protocols, whereas POCUS is typically performed by the treating clinician to answer focused clinical questions. The present study evaluated formal diagnostic MSK-US examinations performed by experienced radiologists using a standardized imaging protocol11.
However, important limitations remain. Ultrasound is operator-dependent and has a restricted ability to visualize deep joint structures and intra-articular cartilage, particularly in complex joints. Previous studies comparing ultrasound with MRI have consistently demonstrated high sensitivity for synovial abnormalities but lower accuracy for cartilage damage and osteochondral lesions12,13. Furthermore, many existing studies are limited by relatively small sample sizes, heterogeneous methodologies, inclusion of multiple joints per patient with potential clustering effects, or focus on selected imaging features rather than providing a comprehensive evaluation of joint pathology across disease stages.
Although MSK-US has been increasingly incorporated into hemophilia care, important gaps remain regarding its performance under real-world clinical conditions. In particular, few studies have combined a standardized one-joint-per-patient design, feature-level diagnostic analysis, agreement assessment, and receiver operating characteristic (ROC)-based evaluation using HEAD-US scoring within a single cohort. Such an approach may provide a more clinically interpretable assessment of diagnostic performance while minimizing potential bias arising from multiple correlated joints from the same patient.
The intended clinical role of MSK-US also requires further clarification. While MRI remains the reference standard for comprehensive structural assessment, MSK-US is increasingly used for routine monitoring, follow-up of known arthropathy, and identification of patients who may benefit from further MRI evaluation. Understanding its diagnostic performance across both synovial and structural abnormalities is therefore important for defining its role within contemporary hemophilia care pathways.
In this context, the present study aims to evaluate the diagnostic performance of MSK-US in detecting hemophilic arthropathy in a relatively large, real-world cohort of patients, using MRI as the reference standard. By employing a one-joint-per-patient design and integrating feature-level diagnostic performance, interobserver agreement, and ROC-based HEAD-US analysis, this study seeks to address methodological limitations of previous investigations and better define the role of MSK-US as a complementary tool for routine monitoring, follow-up assessment, and triage to MRI when detailed structural evaluation is required.
Protocol
Loading...
$$\rightleftharpoonup{xx}$$
$$\longleftharp{xx}$$,
$$\longrightharp{xx}$$,
This study was conducted in accordance with the principles of the Declaration of Helsinki. Ethical approval was obtained from the Institutional Ethics Committee of Panzhihua Hospital of Integrated Traditional Chinese and Western Medicine (The Affiliated Hospital of Panzhihua University), Panzhihua, China (Approval No. 2024ZD-S-4). As this was a retrospective study based on anonymized clinical and imaging records, the requirement for written informed consent was waived by the ethics committee. All patient data were handled confidentially and anonymized prior to analysis.
Study design and setting
This retrospective cross-sectional diagnostic accuracy study was conducted at a tertiary care center with a dedicated hemophilia treatment unit. The study followed the standards for reporting diagnostic accuracy studies (STARD) guidelines. Data were obtained from hospital records and the radiology database after both the index test, MSK-US, and the reference standard (magnetic resonance imaging [MRI]) had been performed as part of routine clinical care between January 2020 and December 2025.
The primary diagnostic endpoint was the accuracy of MSK-US for detecting hemophilic arthropathy, using MRI as the reference standard. MRI examinations were requested by treating hematologists or orthopedic specialists when clinically indicated, including persistent joint pain, recurrent hemarthrosis, suspected progression of target-joint disease, discordance between clinical findings and previous imaging results, or the need for detailed structural assessment before treatment modification. MSK-US examinations were performed as part of routine joint evaluation and monitoring within the hemophilia care program.
Given the retrospective design, there is a potential risk of selection bias; this was minimized by including a consecutive series of eligible patients identified through predefined inclusion and exclusion criteria. However, because MRI was performed according to clinical indications rather than as a systematic screening procedure, the study population may have had a higher pre-test probability of joint pathology than the general hemophilia population. This potential referral bias was considered during the interpretation of the diagnostic accuracy findings and is addressed in the limitations section.
Participants
Eligibility criteria and selection
Patients with a confirmed diagnosis of hemophilia A or B who underwent both MSK-US and MRI of the same joint within a maximum interval of three months were eligible for inclusion. Potentially eligible participants were identified through electronic medical records and the radiology database at the study center. Both pediatric and adult patients were eligible for inclusion.
Patients were excluded if they had a history of prior joint surgery, coexisting inflammatory or degenerative joint diseases (such as rheumatoid arthritis or advanced osteoarthritis), or incomplete or poor-quality imaging studies. Patients who underwent major clinical interventions between MSK-US and MRI examinations, including joint surgery or initiation of new disease-modifying treatment, were also excluded to minimize potential bias arising from interval changes in joint status.
A consecutive series of eligible patients meeting these criteria during the study period was included to minimize selection bias and improve representativeness. Baseline demographic and clinical characteristics, including age, hemophilia subtype (A or B), disease severity, prophylaxis status, inhibitor status, and joint type examined, were recorded to characterize the study population and assess its representativeness.
Unit of analysis and joint selection
To avoid statistical dependence arising from multiple joints within the same individual, a single joint per patient was included in the primary analysis. The representative joint was defined as the joint that underwent both MSK-US and MRI within the specified interval and was clinically indicated for imaging (e.g., symptomatic or designated target joint as documented in clinical records).
In cases where more than one joint met these criteria, the joint with the most complete imaging dataset and highest clinical relevance was selected according to predefined rules. Although this approach minimizes clustering bias and prevents overestimation of diagnostic performance, it may underestimate the burden of multi-joint involvement in hemophilia. To address this limitation, joints from different anatomical sites were included, and subgroup analyses were performed according to joint type (knee, ankle, and elbow).
Index test (musculoskeletal ultrasound)
MSK-US examinations were performed using high-frequency linear transducers (7–15 MHz) following a standardized scanning protocol for hemophilic joints, including the knee, ankle, and elbow14. These examinations were performed as formal diagnostic MSK-US studies by experienced musculoskeletal radiologists rather than point-of-care ultrasound (POCUS) assessments. Each joint was systematically evaluated in longitudinal and transverse planes, covering anterior, medial, lateral, and posterior recesses where applicable.
The following ultrasound features were assessed:
Synovial hypertrophy: non-compressible hypoechoic intra-articular tissue, with or without Doppler signal.
Joint effusion: compressible anechoic or hypoechoic intra-articular fluid without a Doppler signal. Joint effusion was recorded as a binary variable (present/absent). Any intra-articular fluid collection exceeding the physiological amount expected for the examined joint was considered positive. Because ultrasound cannot reliably distinguish simple effusion from hemarthrosis, fluid collections were interpreted in conjunction with clinical and MRI findings.
Cartilage damage: thinning, irregularity, or loss of the anechoic cartilage layer.
Bone erosion: cortical discontinuity visible in two perpendicular planes.
Ultrasound findings were recorded as both binary variables (present/absent) and ordinal variables using the HEAD-US scoring system11. According to the internationally accepted HEAD-US methodology, synovial hypertrophy was graded from 0 to 2, cartilage damage from 0 to 4, and bone changes from 0 to 2, yielding a composite HEAD-US score ranging from 0 to 8. Higher scores reflected greater severity of hemophilic arthropathy. Joint effusion was recorded separately and was not included in the composite HEAD-US score. ROC analyses and threshold-based assessments were performed using the composite HEAD-US score.
Ultrasound examinations were performed by experienced radiologists with at least 5 years of expertise in musculoskeletal imaging. Image interpretation for diagnostic accuracy analysis was conducted by a primary reader who was blinded to MRI findings. To assess reproducibility, a random subset of 40 patients (26.7%) was independently re-evaluated by a second radiologist who was blinded to both the initial ultrasound interpretation and MRI results. Interobserver agreement analyses were performed using the independent pre-consensus interpretations of both readers. Discrepancies were subsequently resolved by consensus discussion to establish an adjudicated imaging classification for descriptive purposes. For the remaining cases, the primary reader’s interpretation was used in the final diagnostic accuracy analysis.
Detailed MSK-US acquisition protocol
All examinations were performed using high-frequency linear-array transducers (7–15 MHz) with patients positioned comfortably to permit full access to the target joint. Grayscale imaging was performed before Doppler assessment. Images were acquired in longitudinal and transverse planes, and abnormalities were confirmed in at least two orthogonal planes before being recorded.
Knee joint:
The patient was positioned supine with the knee maintained in slight flexion (20–30°) using a cushion for support. The suprapatellar recess was examined in both longitudinal and transverse planes to assess for synovial hypertrophy and joint effusion. The medial and lateral parapatellar recesses were then scanned in longitudinal and transverse orientations. The femoral trochlear cartilage was evaluated with the knee in maximal flexion, and the cortical bone surfaces were assessed for erosive changes. Representative grayscale images of the suprapatellar recess, cartilage surface, and any abnormal findings were obtained and saved for documentation.
Ankle joint:
The patient was positioned supine with the ankle maintained in a neutral position. The anterior tibiotalar recess was examined in both longitudinal and transverse planes. The medial and lateral joint recesses were assessed for the presence of synovial hypertrophy and joint effusion. Accessible articular cartilage and cortical bone surfaces were evaluated for structural abnormalities. Representative images of the anterior recess and any abnormal findings were obtained and saved for documentation.
Elbow joint:
The patient was positioned either seated or supine with the elbow flexed to approximately 90°. The anterior humeroradial and humeroulnar recesses were assessed in both longitudinal and transverse planes. The posterior olecranon recess was then examined for evidence of synovial hypertrophy and joint effusion. Accessible cartilage surfaces and cortical bone margins were evaluated for structural abnormalities. Representative images of the anterior and posterior recesses, as well as any abnormal findings, were obtained and saved for documentation.
Doppler acquisition protocol:
Power Doppler imaging was performed when synovial hypertrophy was identified on grayscale imaging. Doppler settings were standardized across examinations, including low wall-filter settings, pulse repetition frequency of approximately 500–750 Hz, and gain adjusted to the highest level below background noise. Doppler signals were considered positive only when reproducible intra-synovial flow was identified on consecutive image acquisitions.
Image quality requirements and scoring workflow
For each joint, image acquisition included both longitudinal and transverse views of all accessible recesses. Bone erosions were required to be visible in two perpendicular planes. Images affected by substantial motion, poor acoustic contact, or inadequate visualization of target structures were excluded.
The scoring workflow consisted of: (1) assessment of synovial hypertrophy; (2) assessment of joint effusion; (3) evaluation of cartilage integrity; (4) evaluation of cortical bone surfaces; and (5) assignment of the composite HEAD-US score according to established criteria.
Reader training and standardization
Prior to image evaluation, participating radiologists underwent structured standardization sessions that included review of representative cases, consensus discussions on imaging definitions, and calibration using reference images based on the internationally accepted HEAD-US scoring system. These sessions were conducted to ensure uniform application of imaging criteria and to reduce interobserver variability before formal image interpretation.
Doppler assessment standardization
When Doppler imaging was used to assess synovial vascularity, machine settings (including gain, pulse repetition frequency, and wall filter) were standardized across examinations according to institutional protocol. Doppler findings were interpreted in conjunction with grayscale imaging, and only consistent intra-synovial signals were considered positive. The Doppler signal was not used as a standalone criterion for defining disease.
Interobserver agreement (ultrasound)
Interobserver agreement was assessed in a randomly selected subset of 40 patients (26.7%), which was independently evaluated by a second radiologist blinded to both the primary ultrasound interpretation and MRI findings. Agreement was quantified using Cohen’s kappa (κ) for binary variables and weighted kappa for ordinal HEAD-US scores. Kappa values were interpreted as follows: <0.20 poor agreement, 0.21–0.40 fair agreement, 0.41–0.60 moderate agreement, 0.61–0.80 good agreement, and >0.80 excellent agreement according to the criteria proposed by Landis and Koch15.
Agreement statistics were calculated using the independent initial interpretations of the two readers before consensus review. Discrepant cases were subsequently reviewed jointly and resolved by consensus for adjudication purposes, but were not used in the calculation of kappa statistics.
Reference standard (MRI)
MRI examinations were performed using standard joint imaging protocols and served as the reference standard because of their superior ability to detect both early synovial changes and deep structural abnormalities. MRI examinations were performed using 1.5-T or 3.0-T scanners equipped with dedicated joint coils appropriate for the anatomical site examined. Standardized imaging protocols included T1-weighted, T2-weighted, proton-density (PD) fat-suppressed, and gradient-echo sequences for the detection of hemosiderin deposition. Images were acquired in sagittal, coronal, and axial planes with slice thicknesses of approximately 3–4 mm.
The following MRI findings were recorded:
Synovial proliferation: thickened synovial tissue demonstrating characteristic signal intensity and expansion of the synovial recesses.
Hemarthrosis: intra-articular fluid demonstrating signal characteristics consistent with blood products and/or hemosiderin deposition on gradient-echo sequences.
Osteochondral damage: cartilage loss, surface irregularity, subchondral cyst formation, bone erosion, or other osteochondral abnormalities consistent with hemophilic arthropathy.
All MRI examinations underwent quality review before interpretation to ensure adequate visualization of synovial, cartilaginous, and osseous structures. Synovial proliferation was assessed based on synovial thickening and expansion of joint recesses. Hemarthrosis was identified using characteristic signal intensities of blood products and hemosiderin deposition, particularly on gradient-echo sequences. Osteochondral damage was evaluated by assessing cartilage thinning or loss, surface irregularity, subchondral cyst formation, bone erosions, and other structural abnormalities consistent with hemophilic arthropathy.
Where applicable, findings were assessed using established scoring systems such as the International Prophylaxis Study Group (IPSG) MRI scale16. When available, lesion severity was additionally characterized using the IPSG scoring system. MRI images were interpreted by a primary experienced radiologist who was blinded to MSK-US findings.
Interobserver agreement (MRI)
To assess reproducibility, a random subset of 40 patients (26.7%) was independently evaluated by a second radiologist who was blinded to both the primary MRI interpretation and MSK-US findings. Interobserver agreement was quantified using Cohen’s kappa (κ). Kappa values were interpreted according to the criteria proposed by Landis and Koch (<0.20 poor, 0.21–0.40 fair, 0.41–0.60 moderate, 0.61–0.80 good, and >0.80 excellent agreement).
Agreement statistics were calculated using the independent initial interpretations of both readers before consensus review. Cases with discrepant interpretations were subsequently adjudicated by consensus; however, consensus readings were not used for the calculation of interobserver agreement statistics.
Definition of test positivity
For diagnostic accuracy analyses, three complementary ultrasound-based definitions were evaluated.
Primary binary MSK-US definition:
Ultrasound results were dichotomized as positive or negative. The primary definition of a positive ultrasound result was the presence of at least one characteristic feature of hemophilic arthropathy, including synovial hypertrophy, joint effusion, cartilage damage, or bone erosion. This definition was used for the primary diagnostic endpoint and for the calculation of sensitivity, specificity, positive predictive value, negative predictive value, likelihood ratios, and overall diagnostic accuracy.
HEAD-US–based definition
The composite HEAD-US score was analyzed separately for ROC and threshold analyses. Consistent with the standard HEAD-US methodology, the score incorporated synovial hypertrophy, cartilage damage, and bone changes but excluded joint effusion. HEAD-US scores ranged from 0 to 8, with higher scores indicating greater arthropathy severity. To evaluate the robustness of the findings and the trade-off between sensitivity and specificity, pre-specified secondary analyses were performed using more stringent criteria, including:
Presence of ≥2 abnormal ultrasound features
Higher HEAD-US score thresholds (e.g., ≥2 and ≥3)
Feature-level definitions
Individual ultrasound features were also analyzed separately to assess lesion-specific diagnostic performance relative to MRI. For lesion-level analyses, synovial hypertrophy detected by MSK-US was compared with synovial proliferation on MRI; joint effusion on MSK-US was compared with MRI-detected hemarthrosis or intra-articular fluid abnormalities; cartilage damage on MSK-US was compared with MRI-detected osteochondral cartilage abnormalities; and bone erosion on MSK-US was compared with MRI-detected osseous abnormalities. These comparisons were based on the closest corresponding pathological features identifiable by both imaging modalities. MRI was considered positive if one or more characteristic abnormalities (synovial proliferation, hemarthrosis, or osteochondral damage) were present and served as the reference standard for all diagnostic accuracy analyses.
Blinding
Radiologists interpreting MSK-US images were blinded to MRI findings and detailed clinical information, except for the known diagnosis of hemophilia. MRI readers were similarly blinded to MSK-US results. All image interpretations were performed independently to minimize observer bias.
Time interval between tests
The interval between MSK-US and MRI examinations was restricted to a maximum of 3months to reflect real-world clinical practice. To reduce the potential for bias due to disease progression during this interval: (i) The time interval between examinations was recorded and analyzed. (ii) Patients undergoing major clinical interventions (e.g., surgery or initiation of new disease-modifying therapy) during this period were excluded. (iii) A pre-specified sensitivity analysis was performed for patients with an interval of ≤30 days.
The mean interval between MSK-US and MRI examinations was subsequently reported in the Results section to allow assessment of the potential influence of temporal changes in joint status on diagnostic performance. The distribution of imaging intervals was evaluated descriptively to assess the potential influence of disease progression between examinations. In addition to the mean interval, the median interval and range were recorded. Clinical records were reviewed for documented bleeding episodes, initiation or modification of prophylactic regimens, and other major interventions occurring between MSK-US and MRI examinations. Patients undergoing major clinical interventions during this period were excluded from the study. Patients with documented interval events that could substantially alter joint status were reviewed individually, and those meeting exclusion criteria were not included in the final analysis.
Statistical analysis
Statistical analyses were performed using SPSS Statistics for Windows (version 26.0) and R software (version 4.3.1). The primary analysis evaluated the diagnostic accuracy of MSK-US for detecting hemophilic arthropathy, using MRI as the reference standard. Sensitivity, specificity, positive predictive value (PPV), negative predictive value (NPV), and positive and negative likelihood ratios (LR+ and LR–) were calculated from 2 × 2 contingency tables, with corresponding 95% confidence intervals (CI). In addition to overall diagnostic accuracy, feature-level sensitivity, specificity, and agreement analyses were performed for synovial hypertrophy, joint effusion, cartilage damage, and bone erosion.
Receiver operating characteristic (ROC) curves were generated using ordinal HEAD-US scores, and the area under the curve (AUC) was calculated to assess overall diagnostic performance. Optimal cut-off values were determined using the Youden index.
Agreement between MSK-US and MRI findings, as well as interobserver agreement, was assessed using Cohen’s kappa (κ) for binary variables and weighted kappa for ordinal variables. Kappa values were interpreted according to the criteria proposed by Landis and Koch: <0.20 poor agreement, 0.21–0.40 fair agreement, 0.41–0.60 moderate agreement, 0.61–0.80 good agreement, and >0.80 excellent agreement.
Handling of indeterminate and missing data
All included MSK-US and MRI examinations were of sufficient diagnostic quality for interpretation. No indeterminate imaging findings remained after initial review, and no cases required exclusion because of unresolved diagnostic uncertainty following adjudication. Indeterminate findings identified during image review were independently evaluated by a second radiologist. Any discrepancies were resolved by consensus discussion. No cases remained unresolved after adjudication. Patients with missing or incomplete data for either MSK-US or MRI were excluded before analysis, and no imputation of missing data was performed.
Subgroup and exploratory analyses
Pre-specified subgroup analyses were conducted according to joint type (knee, ankle, and elbow) and type of pathology (synovial abnormalities versus structural abnormalities). For joint-specific analyses, sensitivity, specificity, and overall diagnostic performance were calculated separately for knee, ankle, and elbow joints.
Exploratory analyses evaluated the relationship between disease severity, as reflected by HEAD-US scores, and diagnostic performance. Threshold analyses were performed using increasing HEAD-US cut-off values to assess the trade-off between sensitivity and specificity across different levels of disease severity.
Sample size
No formal prospective sample-size calculation was performed because of the retrospective study design. However, sample precision was evaluated post hoc. Among the 150 included patients, 112 were MRI-positive, and 38 were MRI-negative. Assuming an expected sensitivity of approximately 90% and specificity of approximately 80%, this sample size provided 95% confidence intervals with widths of approximately ±5%–8% for sensitivity estimates and ±10%–15% for specificity estimates. The wider confidence intervals for specificity reflect the smaller number of MRI-negative cases available for analysis. Consequently, sensitivity estimates are considered more precise than specificity estimates and should be interpreted accordingly.
Results
Loading...
$$\rightleftharpoonup{xx}$$
$$\longleftharp{xx}$$,
$$\longrightharp{xx}$$,
Participants
Flow of participants
A total of 182 patients were identified during the study period. Of these, 32 patients were excluded due to incomplete imaging data (n = 14), an interval greater than three months between MSK-US and MRI (n = 10), and prior joint surgery (n = 8). The final analysis included 150 patients, each contributing one representative joint, resulting in a total of 150 joints analyzed (Figure 1). Both pediatric and adult patients were represented in the final cohort.
Baseline characteristics
The baseline demographic and clinical characteristics of the study population are summarized in Table 1. The mean age was 24.8 ± 9.6 years (range: 6–52 years), and all patients were male. The cohort included both pediatric and adult patients. Hemophilia A was present in 118 patients (78.7%), and hemophilia B in 32 patients (21.3%).
The majority of patients had severe disease (61.3%), followed by moderate (25.3%) and mild (13.4%) hemophilia. Most patients were receiving prophylactic treatment (115/150, 76.7%), while 18 patients (12.0%) had detectable inhibitors.
A total of 150 joints were evaluated, including the knee (72/150, 48.0%), ankle (48/150, 32.0%), and elbow (30/150, 20.0%). The mean interval between MSK-US and MRI was 18.6 ± 9.2 days.
MRI identified hemophilic arthropathy in 112 of 150 patients (74.7%), reflecting a substantial burden of joint pathology within the study cohort.
Reference standard findings (MRI)
MRI identified hemophilic arthropathy in 112 of 150 patients (74.7%). Synovial proliferation and hemarthrosis were the most frequently observed MRI abnormalities, whereas osteochondral damage was identified predominantly in patients with more advanced arthropathy.
Diagnostic performance of ultrasound
Cross-tabulation of ultrasound and MRI findings
The cross-tabulation of MSK-US findings against MRI is presented in Table 2. MSK-US correctly identified 102 of 112 MRI-positive cases (true positives) and 30 of 38 MRI-negative cases (true negatives). Ten MRI-positive cases were classified as false negatives, whereas eight MRI-negative cases were classified as false positives.
Primary diagnostic accuracy metrics
Using MRI as the reference standard, MSK-US demonstrated a sensitivity of 91.1% (95% CI: 84.2–95.6) and a specificity of 78.9% (95% CI: 62.7–90.4). The positive predictive value (PPV) was 92.7% (95% CI: 86.2–96.8), and the negative predictive value (NPV) was 75.0% (95% CI: 59.7–86.8), with an overall accuracy of 88.0% (95% CI: 81.6–92.8) (Table 2).
The positive likelihood ratio (LR+) was 4.32, and the negative likelihood ratio (LR–) was 0.11, indicating that a positive MSK-US result was associated with a substantially increased probability of MRI-confirmed hemophilic arthropathy, whereas a negative MSK-US result considerably reduced the likelihood of disease.
Feature-level diagnostic performance
Feature-level diagnostic performance is summarized in Table 3. MSK-US demonstrated the highest sensitivity and agreement for synovial hypertrophy (sensitivity 88.9%, specificity 76.2%, κ = 0.72) and joint effusion (sensitivity 86.0%, specificity 72.1%, κ = 0.69). Diagnostic performance was lower for cartilage damage (sensitivity 78.8%, specificity 70.6%, κ = 0.58) and bone erosion (sensitivity 75.5%, specificity 73.1%, κ = 0.55). Similarly, the highest AUC values were observed for synovial hypertrophy (0.88; 95% CI, 0.82–0.93) and joint effusion (0.86; 95% CI, 0.80–0.91), whereas lower AUC values were observed for cartilage damage (0.79; 95% CI, 0.72–0.86) and bone erosion (0.77; 95% CI, 0.70–0.84). These findings indicate that MSK-US was more accurate for detecting synovial abnormalities than advanced structural joint damage.
Agreement analysis
Overall agreement between MSK-US and MRI was moderate-to-good (κ = 0.64) (Table 4). Agreement was highest for synovial hypertrophy (κ = 0.72) and joint effusion (κ = 0.69), while cartilage damage (κ = 0.58) and bone erosion (κ = 0.55) demonstrated moderate agreement. These agreement patterns are visually summarized in Figure 2. Figure 3 illustrates representative corresponding MSK-US and MRI findings of synovial hypertrophy, joint effusion, and osteochondral damage.
ROC analysis and HEAD-US performance
Receiver operating characteristic (ROC) analysis based on ordinal HEAD-US scores demonstrated good overall diagnostic performance, with an area under the curve (AUC) of 0.86 (95% CI: 0.80–0.91) (Figure 4).
The optimal HEAD-US threshold identified by the Youden index was ≥1, which provided the best balance between sensitivity and specificity for detecting MRI-confirmed hemophilic arthropathy. Feature-level ROC analysis showed the highest discriminative ability for synovial hypertrophy (AUC 0.88) and joint effusion (AUC 0.86), with lower performance for cartilage damage (AUC 0.79) and bone erosion (AUC 0.77).
Threshold-based diagnostic performance
Quantitative threshold analyses demonstrated a trade-off between sensitivity and specificity (Table 5).
Primary binary MSK-US definition (≥1 abnormal ultrasound feature, including synovial hypertrophy, joint effusion, cartilage damage, or bone erosion): sensitivity 91.1%, specificity 78.9%.
HEAD-US threshold analyses (excluding joint effusion) demonstrated the following diagnostic performance:
• HEAD-US ≥2: sensitivity 82.1%, specificity 88.2%
• HEAD-US ≥3: sensitivity 75.9%, specificity 92.1%
Using an alternative criterion of ≥2 abnormal ultrasound features, sensitivity decreased to 84.8%, while specificity increased to 86.8%.
As expected, increasing HEAD-US thresholds resulted in progressively lower sensitivity but higher specificity. Lower thresholds favored detection of early or milder disease, whereas higher thresholds improved diagnostic certainty by reducing false-positive findings.
These findings support the use of lower HEAD-US thresholds for early detection and monitoring, while higher thresholds may be more appropriate when greater diagnostic specificity is required.
Using an alternative criterion of ≥2 abnormal ultrasound features, sensitivity decreased to 84.8%, while specificity increased to 86.8% (Table 5).
Interobserver agreement
Interobserver agreement was assessed in a subset of 40 patients. For MSK-US, agreement was good for synovial hypertrophy (κ = 0.74) and joint effusion (κ = 0.71), and moderate for cartilage damage (κ = 0.61) and bone erosion (κ = 0.59). Weighted kappa for total HEAD-US scores demonstrated good agreement (κ = 0.68). For MRI, interobserver agreement for overall detection of hemophilic arthropathy was good (κ = 0.76).
Subgroup and exploratory analyses
Joint-specific analyses demonstrated high diagnostic performance across all anatomical sites. Sensitivity and specificity were 92.9% and 81.3% for the knee joint, 89.2% and 72.7% for the ankle joint, and 89.5% and 81.8% for the elbow joint, respectively. Although diagnostic performance was numerically highest for the knee joint, differences between joint types were not statistically significant. Threshold analyses demonstrated that increasing HEAD-US cut-off values resulted in lower sensitivity but higher specificity. Higher HEAD-US scores were associated with more advanced structural abnormalities and greater diagnostic certainty rather than improved sensitivity.
Exploratory age-stratified analysis
Exploratory subgroup analyses according to age category were not performed because the study was not powered to detect differences in diagnostic performance between pediatric and adult patients. The relatively small number of pediatric participants limited the precision of age-specific estimates.
Time interval sensitivity analysis
A sensitivity analysis restricted to patients with an ultrasound–MRI interval of ≤30 days demonstrated no significant change in diagnostic performance, indicating that the primary results were not substantially influenced by the time interval between imaging modalities. The median interval between MSK-US and MRI was 17 days (interquartile range: 11–25 days; range: 2–58 days). No documented major bleeding episodes requiring hospitalization, joint surgery, initiation of new disease-modifying therapy, or modification of prophylactic treatment occurred between imaging examinations among included patients.
Adverse events
No adverse events related to MSK-US or MRI were observed.
DATA AVAILABILITY
Deidentified data supporting the findings of this study are provided as Supplementary File 1. These materials include diagnostic contingency tables, feature-level imaging data, summary datasets used for diagnostic accuracy analyses, and statistical analysis outputs. All data were anonymized prior to analysis in accordance with institutional ethical requirements and applicable data-protection regulations.
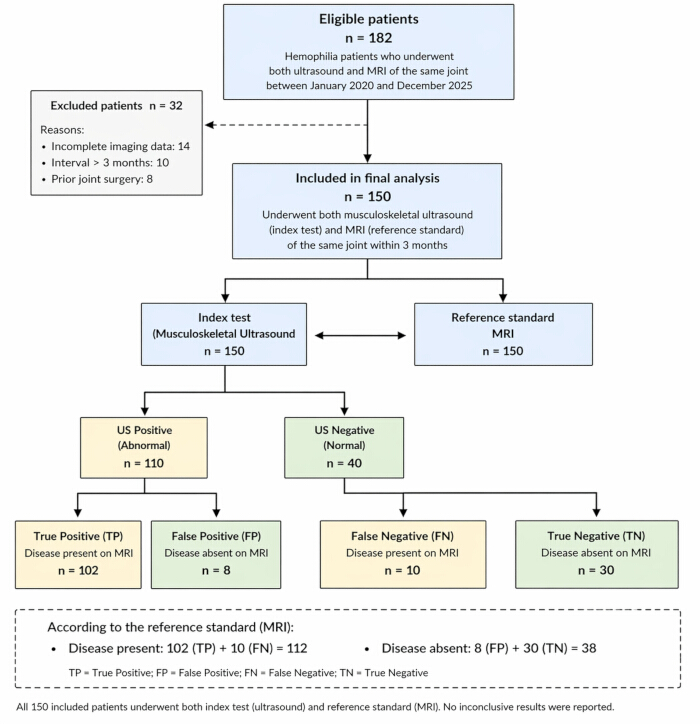
Figure 1: Flow diagram of patient selection according to STARD guidelines.
A total of 182 patients were screened for eligibility. After application of predefined inclusion and exclusion criteria, 150 patients who underwent both musculoskeletal ultrasound (MSK-US) and magnetic resonance imaging (MRI) of the same joint within three months were included in the final diagnostic accuracy analysis. Please click here to view a larger version of this figure.
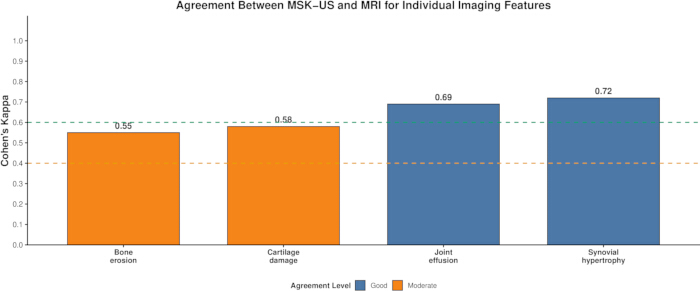
Figure 2: Agreement between musculoskeletal ultrasound (MSK-US) and magnetic resonance imaging (MRI) for individual imaging features in hemophilic arthropathy.
Bar plot showing Cohen’s kappa (κ) values for synovial hypertrophy, joint effusion, cartilage damage, and bone erosion. Ultrasound demonstrated good agreement with MRI for synovial hypertrophy (κ = 0.72) and joint effusion (κ = 0.69), and moderate agreement for cartilage damage (κ = 0.58) and bone erosion (κ = 0.55). Dashed horizontal lines indicate conventional thresholds for moderate agreement (κ = 0.40) and good agreement (κ = 0.60) according to Landis and Koch. Please click here to view a larger version of this figure.
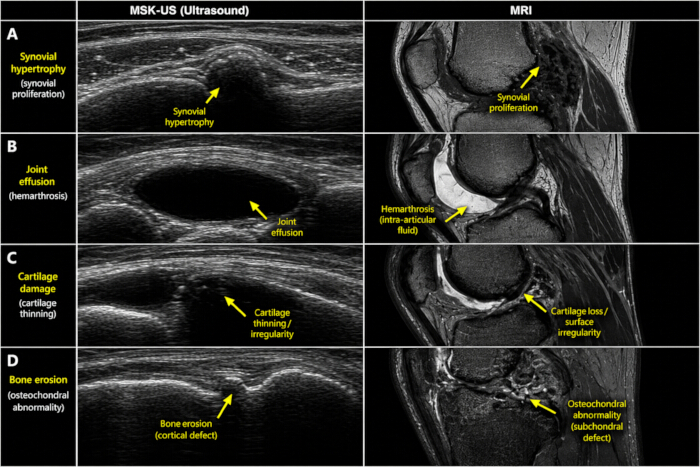
Figure 3: Representative musculoskeletal ultrasound (MSK-US) and magnetic resonance imaging (MRI) findings in hemophilic arthropathy. (A) Left: MSK-US image demonstrating synovial hypertrophy (arrow), characterized by hypoechoic thickened synovium within the joint recess. Right: Corresponding MRI image demonstrating synovial proliferation (arrow) with signal characteristics consistent with chronic synovial disease. (B) Left: MSK-US image demonstrating joint effusion (arrow), visualized as an anechoic intra-articular fluid collection. Right: Corresponding MRI image demonstrating hemarthrosis/intra-articular fluid (arrow). (C) Left: MSK-US image demonstrating cartilage damage (arrow), characterized by cartilage thinning and surface irregularity. Right: Corresponding MRI image demonstrating cartilage loss and articular surface irregularity (arrow). (D) Left: MSK-US image demonstrating bone erosion (arrow), identified as focal cortical discontinuity. Right: Corresponding MRI image demonstrating osteochondral abnormality (arrow) with associated structural joint damage. Arrows indicate the principal pathological findings evaluated in the diagnostic accuracy analysis. Please click here to view a larger version of this figure.
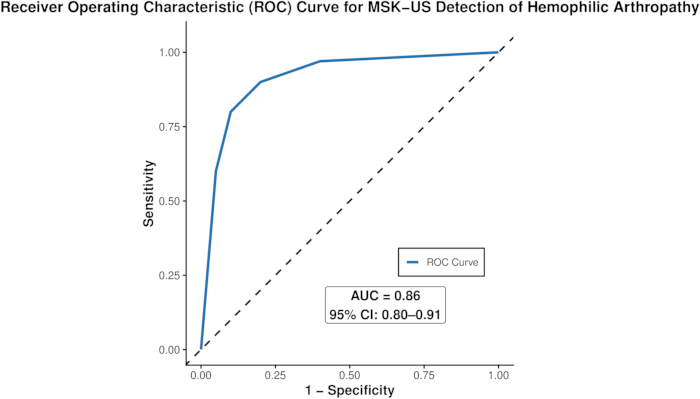
Figure 4: Receiver operating characteristic (ROC) curve for musculoskeletal ultrasound (MSK-US) detection of hemophilic arthropathy using magnetic resonance imaging (MRI) as the reference standard. ROC analysis was performed using ordinal HEAD-US scores. The area under the curve (AUC) was 0.86 (95% confidence interval [CI]: 0.80–0.91), indicating good overall diagnostic performance. The diagonal dashed line represents the line of no discrimination (AUC = 0.50). Please click here to view a larger version of this figure.
| Characteristic | Value | |
| Age, years (mean ± SD) | 24.8 ± 9.6 | |
| Age range, years | 6–52 | |
| Sex (male), n (%) | 150 (100.0) | |
| Type of hemophilia, n (%) | Hemophilia A | 118 (78.7) |
| Hemophilia B | 32 (21.3) | |
| Severity of hemophilia, n (%) | Severe | 92 (61.3) |
| Moderate | 38 (25.3) | |
| Mild | 20 (13.4) | |
| Treatment status, n (%) | On prophylaxis | 115 (76.7) |
| On-demand treatment | 35 (23.3) | |
| Inhibitor status, n (%) | Inhibitor positive | 18 (12.0) |
| Inhibitor negative | 132 (88.0) | |
| Joint evaluated, n (%) | Knee | 72 (48.0) |
| Ankle | 48 (32.0) | |
| Elbow | 30 (20.0) | |
| Interval between MSK-US and MRI (days), mean ± SD | 18.6 ± 9.2 | |
| Interval between MSK-US and MRI (days), median (IQR) | 17 (11–25) | |
| Interval between MSK-US and MRI (days), range | 2–58 | |
| MRI-confirmed hemophilic arthropathy, n (%) | 112 (74.7) | |
Table 1: Baseline demographic and clinical characteristics of the study population (n = 150). Data are presented as mean ± standard deviation, median (interquartile range), or number (percentage), as appropriate. The study cohort included both pediatric and adult patients (age range, 6–52 years). MRI-confirmed hemophilic arthropathy was defined as the presence of one or more characteristic abnormalities, including synovial proliferation, hemarthrosis, or osteochondral damage. Abbreviations: MSK-US, musculoskeletal ultrasound; MRI, magnetic resonance imaging; SD, standard deviation; IQR, interquartile range.
| 2×2 Contingency Table (Overall Detection of Hemophilic Arthropathy) | |||
| MRI Positive | MRI Negative | Total | |
| MSK-US Positive | 102 (TP) | 8 (FP) | 110 |
| MSK-US Negative | 10 (FN) | 30 (TN) | 40 |
| Total | 112 | 38 | 150 |
| Diagnostic accuracy measures | |
| Parameter | Value (95% CI) |
| Sensitivity | 91.1% (84.2–95.6) |
| Specificity | 78.9% (62.7–90.4) |
| Positive Predictive Value (PPV) | 92.7% (86.2–96.8) |
| Negative Predictive Value (NPV) | 75.0% (59.7–86.8) |
| Accuracy | 88.0% (81.6–92.8) |
| Positive Likelihood Ratio (LR+) | 4.33 (2.33–8.03) |
| Negative Likelihood Ratio (LR−) | 0.11 (0.06–0.21) |
Table 2: Diagnostic performance of musculoskeletal ultrasound compared with magnetic resonance imaging for detection of hemophilic arthropathy. A positive MSK-US examination was defined as the presence of at least one abnormal ultrasound feature, including synovial hypertrophy, joint effusion, cartilage damage, or bone erosion. MRI served as the reference standard for the diagnosis of hemophilic arthropathy. Values are presented with corresponding 95% confidence intervals. Abbreviations: MSK-US, musculoskeletal ultrasound; MRI, magnetic resonance imaging; TP, true positive; FP, false positive; FN, false negative; TN, true negative; PPV, positive predictive value; NPV, negative predictive value; LR+, positive likelihood ratio; LR−, negative likelihood ratio; CI, confidence interval.
| Ultrasound Feature | TP | FP | FN | TN | Sensitivity % (95% CI) | Specificity % (95% CI) | PPV % (95% CI) | NPV % (95% CI) | Kappa (κ) | AUC (95% CI) |
| Synovial hypertrophy | 96 | 10 | 12 | 32 | 88.9 (81.4–94.0) | 76.2 (60.5–87.9) | 90.6 (83.4–95.1) | 72.7 (57.2–84.2) | 0.72 | 0.88 (0.82–0.93) |
| Joint effusion | 92 | 12 | 15 | 31 | 86.0 (77.9–91.9) | 72.1 (56.3–84.7) | 88.5 (80.8–93.3) | 67.4 (52.5–79.5) | 0.69 | 0.86 (0.80–0.91) |
| Cartilage damage | 78 | 15 | 21 | 36 | 78.8 (69.5–86.0) | 70.6 (56.2–82.5) | 83.9 (74.8–90.1) | 63.2 (49.6–75.0) | 0.58 | 0.79 (0.72–0.86) |
| Bone erosion | 74 | 14 | 24 | 38 | 75.5 (65.8–83.4) | 73.1 (59.0–84.4) | 84.1 (74.9–90.4) | 61.3 (48.1–73.0) | 0.55 | 0.77 (0.70–0.84) |
Table 3: Feature-level diagnostic performance of musculoskeletal ultrasound compared with magnetic resonance imaging. Sensitivity, specificity, PPV, and NPV were calculated using MRI as the reference standard. Feature-level analyses compared synovial hypertrophy with MRI-detected synovial proliferation, joint effusion with MRI-detected hemarthrosis or intra-articular fluid abnormalities, cartilage damage with MRI-detected osteochondral cartilage abnormalities, and bone erosion with MRI-detected osseous abnormalities. Agreement was assessed using Cohen’s kappa (κ). AUC values were derived from receiver operating characteristic (ROC) analyses for individual imaging features. Abbreviations: MSK-US, musculoskeletal ultrasound; MRI, magnetic resonance imaging; TP, true positive; FP, false positive; FN, false negative; TN, true negative; PPV, positive predictive value; NPV, negative predictive value; AUC, area under the receiver operating characteristic curve; CI, confidence interval.
| Parameter | Kappa (κ) | Agreement Level |
| MSK-US synovial hypertrophy | 0.74 | Good |
| MSK-US joint effusion | 0.71 | Good |
| MSK-US cartilage damage | 0.61 | Good |
| MSK-US bone erosion | 0.59 | Moderate |
| Total HEAD-US score (weighted κ) | 0.68 | Good |
| MRI overall assessment | 0.76 | Good |
Table 4: Agreement and receiver operating characteristic (ROC) analysis of musculoskeletal ultrasound compared with magnetic resonance imaging. Interobserver agreement was assessed using independent pre-consensus interpretations from two blinded radiologists. Agreement was quantified using Cohen’s kappa (κ) for binary variables and weighted kappa for ordinal HEAD-US scores. Interpretation of κ values was based on the criteria proposed by Landis and Koch: <0.20 poor, 0.21–0.40 fair, 0.41–0.60 moderate, 0.61–0.80 good, and >0.80 excellent agreement.
| Diagnostic Definition | Sensitivity (%) | Specificity (%) |
| ≥1 abnormal ultrasound feature* | 91.1 | 78.9 |
| ≥2 abnormal ultrasound features | 84.8 | 86.8 |
| HEAD-US ≥2† | 82.1 | 88.2 |
| HEAD-US ≥3† | 75.9 | 92.1 |
Table 5: Threshold-based diagnostic performance of musculoskeletal ultrasound using alternative definitions of ultrasound positivity. *Primary binary MSK-US definition including synovial hypertrophy, joint effusion, cartilage damage, or bone erosion. †HEAD-US thresholds exclude joint effusion and are based on the composite HEAD-US score (range 0–8), incorporating synovial hypertrophy, cartilage damage, and bone changes only. Abbreviations: MSK-US, musculoskeletal ultrasound; HEAD-US, Hemophilia Early Arthropathy Detection with Ultrasound.
Supplementary File 1: Raw deidentified data supporting the findings of this study. Please click here to download this file.
Discussion
Loading...
$$\rightleftharpoonup{xx}$$
$$\longleftharp{xx}$$,
$$\longrightharp{xx}$$,
In this study, MSK-US demonstrated high sensitivity (91.1%) and good overall diagnostic performance (AUC = 0.86) for detecting hemophilic arthropathy using MRI as the reference standard. Feature-level analyses demonstrated the highest diagnostic performance for synovial hypertrophy and joint effusion, whereas sensitivity, specificity, and agreement were lower for cartilage damage and bone erosion. These findings are consistent with the known strengths of ultrasound in detecting synovial abnormalities and its more limited ability to characterize deeper structural joint damage. Accordingly, MSK-US appears particularly useful for routine joint assessment, longitudinal monitoring, and identification of patients who may benefit from further imaging evaluation. However, MRI remains essential for the comprehensive assessment of cartilage, subchondral bone, and osteochondral abnormalities. Because the study population consisted of patients who underwent clinically indicated MRI examinations, the relatively high prevalence of MRI-confirmed arthropathy (74.7%) may have contributed to the overestimation of diagnostic performance compared with that expected in an unselected hemophilia population. Therefore, the reported predictive values should be interpreted in the context of this selected cohort. These findings should also be considered within the broader clinical spectrum of hemophilia severity and phenotypes, as defined by international consensus criteria, which influence bleeding patterns, joint involvement, and long-term musculoskeletal outcomes17,18.
From a clinical standpoint, early identification of synovial hypertrophy is particularly important, as synovial inflammation is a key driver of recurrent hemarthrosis and progressive joint deterioration, mediated by processes including angiogenesis, synovial proliferation, and inflammatory cascades19,20,21. The strong performance of MSK-US for synovial abnormalities observed in this study suggests that it may facilitate earlier detection of joint involvement and support timely optimization of prophylactic therapy and clinical monitoring22,23. The introduction of newer prophylactic therapies, such as emicizumab, has substantially reduced bleeding frequency; however, subclinical joint changes may still occur, underscoring the continued need for sensitive imaging modalities for assessment of joint health5. In this context, MSK-US serves as a valuable adjunct for routine evaluation and longitudinal monitoring within comprehensive hemophilia care programs. However, the lower diagnostic performance observed for cartilage damage and bone erosion, together with the occurrence of false-negative examinations, indicates that a negative ultrasound finding does not reliably exclude structural joint disease. Accordingly, MRI remains important when persistent symptoms, recurrent bleeding episodes, functional deterioration, discordance between clinical and ultrasound findings, elevated HEAD-US scores, or suspected cartilage or osteochondral damage warrant more comprehensive structural assessment.
Importantly, the findings of this study also have implications for functional joint assessment tools such as the Hemophilia Joint Health Score (HJHS). While HJHS provides a standardized clinical evaluation of joint function, it may be less sensitive to early synovial and structural changes before functional impairment becomes clinically apparent. MSK-US, particularly through standardized scoring systems such as HEAD-US10, has the potential to complement HJHS by identifying imaging abnormalities that may not yet be reflected in clinical joint assessment. Therefore, integration of imaging and functional assessment may provide a more comprehensive evaluation of joint health and support monitoring of disease progression and treatment response in patients with hemophilia.
The diagnostic performance observed in this study is consistent with previously reported values. Earlier studies have reported ultrasound sensitivity ranging from 85% to 95% and specificity between 70% and 85% for detecting hemophilic joint changes12,13,14,24,25. The sensitivity of 91.1% and specificity of 78.9% observed in the cohort fall within these established ranges, supporting the overall consistency of our findings with the existing literature. However, direct comparisons should be interpreted with caution because this study population consisted of patients undergoing clinically indicated MRI examinations and therefore may not fully represent an unselected hemophilia population.
Systematic reviews and consensus recommendations have consistently shown that ultrasound performs well in detecting synovial hypertrophy and joint effusion but is less sensitive for cartilage and subchondral bone abnormalities11,26,27,28,29. Our feature-level analysis demonstrated a similar pattern, with higher sensitivity, agreement, and AUC values for synovial hypertrophy and joint effusion than for cartilage damage and bone erosion. These findings support the role of MSK-US as a useful tool for detecting inflammatory joint changes while highlighting the continued importance of MRI for comprehensive evaluation of structural joint damage.
Recent prospective studies have reported AUC values ranging from 0.80 to 0.88, comparable to the AUC of 0.86 observed in the present study11,27. Although point-of-care ultrasound (POCUS) is increasingly used in hemophilia care, the current investigation evaluated standardized diagnostic MSK-US examinations performed by experienced radiologists. Consequently, the reported diagnostic performance may not be directly generalizable to all POCUS settings. Overall, the findings here are consistent with contemporary evidence and support the use of MSK-US as a complementary imaging modality for routine assessment and monitoring of joint health in patients with hemophilia.
Beyond conventional diagnostic metrics, likelihood ratios offer clinically actionable insights. The positive likelihood ratio (LR+ ≈ 4.3) indicates that a positive MSK-US finding meaningfully increases the probability of hemophilic arthropathy, supporting its role in confirming suspected joint involvement. Conversely, the negative likelihood ratio (LR− ≈ 0.11) indicates that a negative MSK-US examination substantially reduces the likelihood of MRI-detected arthropathy. However, a negative ultrasound finding does not reliably exclude all forms of joint disease, particularly structural abnormalities such as cartilage damage and bone erosion. This is reflected by the negative predictive value of 75.0% and the occurrence of false-negative examinations within the study cohort. Therefore, negative MSK-US findings should be interpreted in conjunction with clinical assessment and patient symptoms.
These findings support a tiered, pragmatic imaging strategy within hemophilia care. MSK-US may serve as a first-line imaging modality for routine surveillance, diagnostic evaluation, and longitudinal monitoring, particularly in outpatient settings. MRI should be considered when persistent symptoms, recurrent bleeding episodes, functional deterioration, elevated HEAD-US scores, suspected cartilage or osteochondral damage, or discordance between clinical and ultrasound findings raise concern for structural joint abnormalities that may not be adequately characterized by MSK-US. MRI may also be appropriate when ultrasound findings are inconclusive or when detailed structural assessment is required to guide treatment decisions. Such an approach aligns with the goals of optimizing resource utilization while maintaining high-quality patient care. The findings of the present study support the complementary use of MSK-US and MRI rather than the replacement of one modality by the other.
The integration of MSK-US into routine clinical pathways also facilitates more frequent and dynamic monitoring of joint status, which is often impractical with MRI. This has important implications for clinical decision-making, including adjustment of prophylaxis regimens, identification of target joints, and evaluation of treatment response. In conjunction with clinical assessment tools such as the Hemophilia Joint Health Score (HJHS), MSK-US may contribute to a more comprehensive evaluation of joint health and support individualized management strategies. These considerations are particularly relevant in the context of evolving hemophilia care, including advances in prophylactic regimens, non-factor therapies, and individualized treatment approaches, which have substantially improved patient outcomes but necessitate sensitive tools for monitoring joint disease4,30,31. Nevertheless, the applicability of the present findings should be interpreted in the context of a cohort with a relatively high prevalence of MRI-confirmed arthropathy, and further prospective studies in broader hemophilia populations are warranted.
The evaluation of different diagnostic thresholds demonstrated the expected trade-off between sensitivity and specificity (Table 5). The primary binary MSK-US definition, based on the presence of at least one abnormal ultrasound feature (including joint effusion), achieved the highest sensitivity and was therefore most suitable for identifying possible joint involvement. Increasing the diagnostic threshold, either by requiring the presence of ≥2 abnormal ultrasound features or by applying higher HEAD-US score cut-offs (HEAD-US ≥ 2 and HEAD-US ≥ 3), improved specificity at the expense of sensitivity, reflecting greater diagnostic certainty and a lower likelihood of false-positive findings.
These findings have direct clinical relevance. Lower thresholds are appropriate for routine monitoring and early detection, whereas higher thresholds may be more suitable when diagnostic certainty is required, such as in decisions regarding treatment escalation, referral for MRI, or further clinical evaluation. Consistent with the feature-level analyses, lower thresholds are particularly valuable for identifying synovial abnormalities, whereas higher thresholds are more likely to reflect established structural joint damage. The HEAD-US scoring system provides a standardized and reproducible framework that facilitates consistent interpretation across centers and supports its broader implementation in hemophilia care.
Importantly, increasing HEAD-US thresholds was associated with higher specificity rather than improved sensitivity. This observation suggests that higher scores should be interpreted as indicators of more advanced arthropathy and greater diagnostic confidence, rather than enhanced case detection. Accordingly, elevated HEAD-US scores may help identify patients who would benefit from more comprehensive structural assessment with MRI, particularly when cartilage or osteochondral damage is suspected.
Nevertheless, threshold selection should be individualized according to clinical context, symptoms, and imaging objectives. Further prospective studies are warranted to establish clinically meaningful HEAD-US cut-offs linked to patient outcomes and functional measures such as the Hemophilia Joint Health Score (HJHS). Prospective studies integrating imaging and functional outcomes may help define optimal thresholds for risk stratification and longitudinal monitoring in contemporary hemophilia care.
This study has several strengths, including the use of MRI as a reference standard, a relatively large and well-characterized cohort, inclusion of both pediatric and adult patients, and the integration of both feature-level and quantitative (HEAD-US) diagnostic analyses, enhancing the robustness and clinical interpretability of the findings. The study also incorporated standardized diagnostic MSK-US examinations, blinded image interpretation, and assessment of interobserver agreement, further strengthening methodological rigor. These characteristics are especially valuable in settings where access to MRI is limited or where frequent monitoring is required.
However, several limitations should be acknowledged. First, the retrospective single-center design may limit generalizability. Second, MRI examinations were performed according to clinical indications rather than as part of a systematic screening protocol, resulting in a cohort with a relatively high prevalence of MRI-confirmed arthropathy (74.7%). Consequently, the diagnostic performance of MSK-US may have been overestimated compared with that observed in an unselected hemophilia population. Third, the reduced sensitivity for cartilage damage and bone erosion observed in this study highlights an important limitation. MSK-US demonstrated lower diagnostic performance for structural abnormalities than for synovial changes and may underestimate structural disease, particularly in early cartilage involvement or in deeper joint compartments. This limitation underscores the risk of under-detection if MSK-US is used in isolation, particularly in patients with more advanced or complex joint pathology. Additionally, although both pediatric and adult patients were included, the study was not powered for age-stratified diagnostic accuracy analyses; therefore, potential differences in MSK-US performance between age groups could not be reliably assessed. The smaller number of MRI-negative cases also resulted in lower precision for specificity estimates compared with sensitivity estimates. Although the mean interval between MSK-US and MRI was relatively short, interval changes in joint status cannot be completely excluded. Furthermore, exclusion of poor-quality imaging studies before analysis may have resulted in modest overestimation of diagnostic performance. Finally, the study population consisted exclusively of male patients, reflecting the epidemiology of hemophilia; therefore, the findings may not be fully generalizable to female carriers or individuals with atypical bleeding phenotypes.
Accordingly, MSK-US should be considered part of a multimodal assessment strategy, complementing clinical evaluation and MRI rather than replacing it. The choice of imaging modality should be guided by the clinical question, disease stage, and the need for detailed structural assessment.
Future prospective studies incorporating imaging, functional outcomes, and potentially emerging biomarkers may further refine risk stratification and monitoring strategies for hemophilic arthropathy.
In this selected retrospective cohort of patients with hemophilia undergoing both MSK-US and MRI, MSK-US demonstrated good overall diagnostic performance for detecting hemophilic arthropathy, with the highest accuracy observed for synovial abnormalities such as synovial hypertrophy and joint effusion. These findings support the use of MSK-US as a practical and accessible imaging modality for routine joint assessment, surveillance, and longitudinal monitoring.
However, MSK-US demonstrated lower diagnostic performance for cartilage damage and bone erosion, indicating that it may underestimate structural joint disease. Consequently, MRI remains necessary for comprehensive evaluation of cartilage, osteochondral, and other deep structural abnormalities, particularly in patients with persistent symptoms, elevated disease burden, inconclusive ultrasound findings, or discordance between clinical and imaging assessments. Overall, the findings support the complementary use of MSK-US and MRI within hemophilia care, with MSK-US serving as a first-line monitoring tool and MRI providing detailed structural assessment when clinically indicated.
Disclosures
Loading...
$$\rightleftharpoonup{xx}$$
$$\longleftharp{xx}$$,
$$\longrightharp{xx}$$,
The authors declare that they have no competing interests.
Materials
| Name | Company | Catalog Number | Comments |
|---|---|---|---|
| Electronic Medical Record (EMR) System | Hospital Information System (HIS) | Institutional software platform | Used for retrieval of demographic, clinical, and treatment data |
| High-frequency Linear Ultrasound Transducer | GE Healthcare (Chicago, IL, USA) | L6–15-D | Primary transducer used for musculoskeletal ultrasound examinations |
| Magnetic Resonance Imaging (MRI) Scanner | Siemens Healthineers (Erlangen, Germany) | MAGNETOM Aera, 1.5 T | Reference-standard imaging modality for assessment of hemophilic arthropathy |
| PACS Image Archive System | GE Healthcare (Chicago, IL, USA) | Centricity PACS | Used for storage and review of ultrasound and MRI examinations |
| Statistical Analysis Software | IBM Corp. (Armonk, NY, USA) | SPSS Statistics Version 26.0 | Used for diagnostic accuracy, ROC, and agreement analyses |
| Ultrasound Imaging System | GE Healthcare (Chicago, IL, USA) | LOGIQ E9 | Diagnostic musculoskeletal ultrasound system used for image acquisition |
Reprints and Permissions
Request permission to reuse the text or figures of this JoVE article
Request Permission