This study evaluates Qi-fu-yin (QFY) treatment in 5xFAD mice. The findings show that QFY administration is associated with enhanced learning and memory performance, reduced cerebral Aβ deposition and cellular senescence, and attenuated synaptic structural damage in the cerebral cortex.
Research Article
Effects of Qi-fu-yin on Improving Cognitive Impairment and Reducing Cellular Senescence in the Brains of 5xFAD Mice
* These authors contributed equally
In This Article
Summary
Abstract
Although the mechanism of Qi-fu-yin (QFY), a traditional Chinese medicine prescription, remains incompletely understood, it has shown therapeutic potential in Alzheimer's disease (AD). This study aimed to investigate the association between QFY treatment and cognitive impairment in 5xFAD mice. We used grip strength, gait, colony nesting, shuttle box, Morris water maze test, and ELISA to evaluate the levels of Amyloid-β protein 1-42 (Aβ1-42), Aβ1-40, Growth-associated protein 43 (GAP-43), Synaptophysin (SYN), and Postsynaptic density protein 95 (PSD-95) in the brains of 5xFAD mice. Luminex cytokine analysis was used to quantify Senescence-associated secretory phenotype (SASP) levels in the cortex. The amount of Senescence-associated β-galactosidase (SA-β-Gal), Aβ deposition, and dendritic spines in the animals' brains was measured by SA-β-Gal staining, immunohistochemistry, and Golgi-Cox staining, respectively. QFY treatment dramatically reduced cortical Aβ plaque burden and decreased p21 expression in 5xFAD mice, according to immunofluorescence tests. In 5xFAD mice, QFY therapy markedly enhanced learning and memory performance, alleviated aging, and increased the amounts of GAP-43, PSD-95, and SYN proteins in the mice's cortex. Following QFY treatment, there was a significant decrease in Aβ plaque and SA-β-Gal activity in the brain, as well as Aβ1-42 and Aβ1-42/Aβ1-40 levels in the hippocampus. The levels of IL-1α, IL-1β, IL-6, IL-17A, and IFN-γ were considerably reduced in the cortex of the 5xFAD mice. PCA and Pearson correlation analyses demonstrated a strong negative association between SASP cytokines and synaptic protein levels. These findings suggest an association between QFY treatment and improvements in age‑related cognitive decline and cellular senescence phenotypes in 5xFAD mice, alongside mitigated synaptic structural damage. These findings support further investigation of QFY as a potential therapeutic candidate for Alzheimer's disease.
Introduction
Alzheimer's disease (AD)1 is the most prevalent form of dementia, characterized by amyloid-β protein (Aβ), hyperphosphorylated tau proteins (P-Tau), synaptic loss, and chronic inflammation. Currently available medications for AD have a number of side effects and are unable to stop the disease's progression2,3,4,5.
Senescence, which manifests as organism-wide disruptions across cellular and interstitial microenvironments rather than localized organ-specific alterations, is a key risk factor in AD pathogenesis. This systemic dysregulation distinguishes AD progression from single tissue-pathology models by fundamentally changing homeostatic mechanisms across biological systems6,7. Although cellular senescence initially serves as a homeostatic regulatory mechanism, the accumulation of senescent cells eventually causes progressive tissue degradation and persistent inflammatory cascades, fundamentally disrupting physiological homeostasis8. The ensuing inflammation may harm synapses and impair cognitive function9,10.
Cellular senescence is a complex cellular stress response characterized by telomere shortening, permanent cell-cycle arrest, and altered secretory activity11. Additional hallmarks include enlarged, flattened cell morphology, positive senescence-associated β-galactosidase (SA-β-Gal) staining, lipofuscin accumulation, and secretion of SASP factors12. Memory formation is affected by the notable decline in the levels of proteins associated with synaptic plasticity of axons and dendrites, which occurs with cellular senescence13,14. Because synaptic plasticity is essential for learning and memory, disruptions in synaptic proteins contribute to cognitive impairment. These proteins include GAP-43, SYN, and PSD-95. Undoubtedly, synaptic function is affected by reductions in dendritic numbers and functional abnormalities in the brains of the elderly15.
QFY is a traditional Chinese medicine formula derived from Jing Yue Quan Shu. It is composed of Panax ginseng C.A.Mey (Araliaceae), Polygala tenuifolia Willd (Polygalaceae), Rehmannia glutinosa (Gaertn.) Libosch. ex Fisch. & C. A. Mey (Orobanchaceae), Angelica sinensis (Oliv.) Diels (Apiaceae), Glycyrrhiza uralensis Fisch. ex DC. (Fabaceae), Atractylodes macrocephala Koidz (Asteraceae), Ziziphus jujuba Mill. var. spinosa (Bunge) Hu ex H.F. Chou (Rhamnaceae). Research has demonstrated that QFY significantly ameliorates cognitive dysfunction in rats with diabetes-induced brain injury16. Our previous study found that QFY could improve cognitive learning and memory functions impairment in 5xFAD and APP/PS1 mice. In addition, QFY demonstrated high safety in non-clinical studies, and no obvious acute, subacute, or long-term toxic reactions were observed17,18,19. Analysis of the clinical therapeutic effect of QFY showed that AD patients experienced a significant increase in their capacity for activities of daily living and MMSE scores after QFY treatment20. Following three consecutive days of QFY administration in male Sprague-Dawley rats, ten prototype QFY-derived components, including butylidenephthalide, butylphthalide, 20(S)-ginsenoside Rh1, 20(R)-ginsenoside Rh1, and zingibroside R1, were detected in cerebrospinal fluid21,22. However, the therapeutic mechanism of QFY in AD is still unclear. In this study, we investigated the association between QFY treatment, cellular senescence, and AD-related pathological changes in 5xFAD mice.
Although previous studies have demonstrated the neuroprotective effects of QFY in AD models, the specific involvement of cellular senescence in mediating these effects remains unexplored. Moreover, whether QFY confers cognitive benefits through senescence‑associated synaptic preservation, rather than solely through amyloid‑β reduction, has not been addressed. The present study was therefore designed to investigate whether QFY treatment attenuates cellular senescence and whether this attenuation is associated with improved synaptic plasticity in 5xFAD mice.
Protocol
All animal experiments were approved by the Ethics Committee of Experimental Animal Welfare of Shandong University of Traditional Chinese Medicine (SDUTCM20221101001).
Drugs
QFY granule dry cream powder was prepared and tested by Lunan Pharmaceutical Houpu Research and Development Center. Donepezil and Memantine were purchased from Shanghai Yuanye Technology. Male 5xFAD mice with an initial body weight range of 19–27 g were used in this study. The QFY dosage was derived from the clinical human dose of 43 g/d, which corresponds to 16.297 g/d after adjusting for the QFY granule dry cream powder. The medium dose for the present experiment was calculated based on the clinical human dose (16.297 g/70 kg x 9.1 = 2.11861 g/kg/d). The high dose was set to twice the medium dose (4.24 g/kg/d), and the low dose to half the medium dose (1.06 g/kg/d). All drug solutions were administered at a volume of 0.1 mL per 10 g of body weight.
For the positive control, combined administration of donepezil and memantine hydrochloride was employed. The dosages were determined with reference to their current clinical application doses (10 mg/d and 20 mg/d, respectively) and previous data from our research group, resulting in a regimen of donepezil at 1.0 mg/kg/d plus memantine at 2.8 mg/kg/d, yielding a total combined dose of 3.8 mg/kg/d. The final concentration of the donepezil–memantine mixture was prepared as 0.38 mg/mL, calculated as 3.8 mg/kg divided by the administration volume of 0.1 mL per 10 g body weight.
QFY solutions at low, medium, and high doses were prepared as follows: 5.3 g, 10.6 g, and 21.2 g of QFY dry powder were each placed into separate 100 mL beakers, mixed with 30 mL of purified water with thorough stirring, transferred to graduated cylinders, and brought to a final volume of 50 mL with purified water, yielding final mass concentrations of 0.106 g/mL, 0.212 g/mL, and 0.424 g/mL, respectively. For the positive control, 5 mg of donepezil and 14 mg of memantine were dissolved in purified water and adjusted to a final volume of 50 mL. Animals in each group were given the corresponding drug solution once daily via oral gavage.
Animals
5xFAD transgenic mice [B6. Cg-Tg (APPSwFlLon, PSEN1* M146L* L286V)6799Vas/Mmjax] were bred in the laboratory. The animals were all maintained in an SPF environment at Shandong University of Traditional Chinese Medicine, with a temperature of 22–24 oC, a humidity of 50–60%, and a 12 h light-dark cycle. Food and water were provided to the animals at all times.
At 2.5 months of age, male 5xFAD mice were randomly allocated to five groups: untreated 5xFAD, donepezil plus memantine, low-dose QFY, medium-dose QFY, and high-dose QFY. Age-matched male wild-type (WT) littermates served as the WT control group. Treatments were administered once daily for 220 days. (Figure 1).
Behavioral tests
Grip strength test
The forelimb skeletal muscle strength of the mice was measured using a grip strength meter23. During the experiment, the testing device was positioned horizontally, ensuring the mouse remained parallel to the table surface. After the device was turned on, the mouse was gently placed on the grip plate. When the mouse had securely grasped the plate, its tail was pulled backward with equal force until the mouse released its grip. The maximum grip strength was documented. This measurement was repeated three times, and the average of these values was used to determine the mouse’s grip strength.
Gait test
Mice's gait regularity was measured using CatWalk XT. The experiment was divided into a training period and a test period24. One day earlier, the experimental mice were transferred to the experimental room to allow them to adapt to the new environment. During the training period, the mice were placed at the starting point and ran along the channel to the end point. Each mouse was trained three times a day. After 3 days of training (until each mouse could quickly pass through the channel), the mice were returned to the cage. The test period was the same as the training period, and the computer software would automatically analyze each movement trajectory. Green dots were displayed if the trajectory was qualified, orange dots were unqualified, and at least three green dots were qualified for each mouse, which were analyzed by CatWalkXT 10.0 software.
Shuttle box test
The shuttle box test was used to assess conditional active avoidance ability in mice25. The apparatus consisted of a shuttle box (18 cm x 18 cm) housed within a sound‑attenuating chamber. The experiment comprised a 4‑day learning period followed by a 1‑day test period. On each learning day, mice were allowed a 120‑s adaptation period in the shuttle box before training began. Each trial started with a 6‑s conditioned stimulus (70‑dB, 1000‑Hz tone combined with a 500‑lux light), followed by a 3‑s, 0.3‑mA foot shock delivered through the grid floor, and concluded with a 12 s inter‑trial interval. If the mouse crossed to the opposite compartment during the conditioned stimulus, the shock was omitted, and the response was recorded as active avoidance. If the mouse did not cross during the conditioned stimulus but crossed during the foot shock, it was recorded as a passive avoidance response. If the mouse failed to cross throughout the trial, it was recorded as an escape failure. Training was repeated for 4 consecutive days with 30 trials per day. During the test period (day 5), the foot shock was omitted while all other parameters remained the same as in the learning period. The number of active avoidance responses was recorded as the primary measure of learning and memory.
Morris water maze
The Morris water maze test was used to assess the spatial learning and memory abilities of experimental animals26. The experiment was carried out in a tank that had a diameter of 120 cm and a depth of 50 cm. The tank was filled with turbid white water, and the temperature was maintained at 21 °C. A platform with a diameter of 10 cm was installed 1 cm below the water surface in one of the quadrants. Visual clues were placed around the pool as spatial landmarks for the mice. The learning process was conducted over four consecutive days, with each day's session beginning in one of three quadrants. Start positions varied pseudo-randomly among the four cardinal points. In each trial, the procedure ended when the animal successfully reached the platform. A maximum trial duration of 60 s was established; if the animal failed to locate the platform within this timeframe, it was carefully guided to the platform. After reaching the platform, the animal was given a brief 10 s respite before being returned to its home cage. After the learning period ends, the test period begins 24 h later. Mice are placed from the opposite quadrant of the platform on Day 5. The escape latency of the test period, the movement time of the target quadrant, and the number of crossings of the original underwater platform area were recorded.
Colony nesting test
The daily activities of experimental animals were assessed using the colony nesting test27. The experiment lasted 24 h, with three animals per group. After the drug administration on the same day, new cages were set up and lined with 6 g soft paper for nesting, and photographs were taken at 6 h, 12 h, and 24 h. At the end of the experiment, the paper was scattered throughout the cage, and no bite was given. 1 point. The paper pieces were clustered to the side of the cage, but loosely, with no formed nests, no obvious tearing or folding for 2 points; The paper pieces gathered and folded into a formed but relatively flat nest without obvious tearing was 3 points; A deep nest with extensively shredded paper was assigned a score of 4. At the end of the experiment, the remaining untorn tissue (defined as paper fragments weighing >0.1 g that were not shredded or incorporated into the nest) was carefully collected, air‑dried, and weighed using an electronic balance (precision: 0.01 g).
Sampling and sample collection
We collected samples only from the WT, 5xFAD, and QFY (2.12 g/kg/d) groups. After CO2 asphyxiation, the heads were cut off, the right hemisphere was quickly opened to separate the hippocampus and cortex, rinsed with phosphate-buffered saline (PBS), and placed in 1.5 mL frozen tubes in liquid nitrogen. It was stored at -80 oC for biochemical tests. The left hemisphere was fixed by immersion in 4% paraformaldehyde for 24 h, dehydrated by immersion in absolute ethanol, embedded in paraffin wax, sectioned at 5 µm, and deparaffinized for immunohistochemical detection.
Enzyme-linked immunosorbent assay (ELISA)
ELISAs were performed to quantify target protein levels in brain tissues. Aβ1–40 and Aβ1–42 contents in hippocampal homogenates were measured using commercial kits, whereas cortical levels of GAP-43, PSD-95, and SYN were determined using kits sourced from Jiangsu Enzyme Immunoassay Industry. All procedures were carried out strictly in accordance with the manufacturers' protocols. Standard series were prepared by serial dilution following the kit instructions. The microplate layout included blank wells, standard wells, 5xFAD sample wells, QFY‑treated (2.12 g/kg/d) sample wells, and wild‑type wells. Prior to loading, all samples were diluted twofold with the provided diluent. Reagents were added with the pipette tip held perpendicular to the bottom of the well, then gently agitated to ensure thorough mixing.
After plate sealing, the initial incubation was conducted at 37 °C for 30 min. During this period, the wash buffer was prepared by diluting the concentrated stock with ultrapure water at a 1:29 ratio (1 mL concentrate to 29 mL water). Following incubation, the sealing film was removed, the liquid discarded, and the plate blotted dry. Each well was then filled with 200 µL of wash buffer, allowed to stand for 30 s, and emptied; the cycle was repeated 5 times. Enzyme‑labeled reagent (50 µL) was subsequently added to all wells except the blanks, and the plate was resealed and incubated again at 37 °C for 30 min, followed by an identical five‑cycle washing step.
For color development, 50 µL of chromogen solution A was added to each well, followed by 50 µL of chromogen solution B, with gentle mixing after each addition. The plate was incubated at 37 °C in the dark for 10 min. The enzymatic reaction was terminated by adding 50 µL of stop solution per well, which promptly converted the blue color to yellow. Absorbance (optical density) was measured at 450 nm using a microplate reader, with blank wells serving as the reference; all readings were obtained within 15 min after stopping the reaction.
Luminex
Cortical levels of SASP factors were measured using the Bio‑Plex Pro Mouse Cytokine 23‑plex Assay kit, with all procedures performed according to the manufacturer's instructions. Reagents were removed from 4 °C storage and allowed to equilibrate to room temperature for 30 min prior to use. Standard stocks were serially diluted to generate a seven‑point standard curve, plus one blank well, according to the kit protocol. Magnetic beads were premixed and diluted to the recommended working concentration; detection antibodies were prepared as working solutions; and the wash buffer concentrate was diluted to 1x with deionized water. PE‑streptavidin conjugate was also diluted to 1x using the supplied dilution buffer.
For the assay, 50 µL of bead suspension, standards, quality controls, and diluted tissue samples (5.6 µg/µL) were added sequentially to designated wells according to the plate layout. The plate was then sealed and incubated overnight at 4 °C with orbital shaking at 800 rpm. Following incubation, the beads were washed three times with 200 µL of wash buffer per well. Subsequently, 50 µL of the prepared detection antibody was added to each well, and the plate was incubated at room temperature for 1 h with shaking at 800 rpm. After another three wash cycles, 50 µL of PE‑streptavidin working solution was introduced, and the plate was incubated for an additional 30 min at room temperature under the same shaking conditions. A final wash step (three times with 200 µL wash buffer) was performed, after which 150 µL of wash buffer was added to each well, and the plate was shaken at room temperature for 2 min at 800 rpm before being read on the Bio‑Plex instrument.
SA-β-Gal staining and immunohistochemistry
SA-β-Gal staining was performed according to the Senescence β-Galactosidase Staining Kit. After SA-β-Gal staining, sections were subjected to antigen retrieval by heating in citrate buffer (pH 6.0). Endogenous peroxidase activity was blocked by incubating the sections in a peroxidase-blocking solution for 10 min at room temperature. The sections were then incubated with a rabbit monoclonal anti‑Aβ₁-₄₂ antibody (1:400) at 4 °C overnight. After washing, the sections were incubated with an anti‑rabbit/mouse IgG secondary antibody for 20 min at room temperature. Following further washing, immunoreactivity was visualized with DAB for 2 min. Finally, the sections were dehydrated, cleared, and mounted with neutral resin for microscopic examination.
Immunofluorescence
For immunofluorescence staining, paraffin sections were deparaffinized in xylene (3 x 15 min) and rehydrated through a graded ethanol series (100%, 95%, and 75%; 2 x 5 min each). Antigen retrieval was performed by immersing the sections in 1x sodium citrate buffer at 95 °C for 30 min, then gradually cooling to room temperature. After three rinses with phosphate-buffered saline with Tween 20 (PBST) (5 min each), sections were permeabilized and blocked with 10% normal goat serum containing 0.3% Triton X‑100 for 90 min at room temperature. Sections were then incubated with primary antibodies against p21/CIP1/CDKN1A (1:200) and Aβ₁‑₄₂ (1:400) at 37 °C for 2 h. Following four washes with PBST (5 min each), sections were incubated with species‑matched Alexa Fluor‑conjugated secondary antibodies (1:500) at 37 °C for 2 h in the dark. After additional washing (4 x 5 min in PBST), sections were mounted with DAPI‑containing antifade mounting medium and imaged using a fluorescence microscope.
Golgi-Cox staining
Golgi‑Cox staining was performed using a commercial kit according to the manufacturer’s instructions. Solutions A and B were mixed 24 h prior to the experiment. After mice were euthanized, brain tissues were rapidly removed, rinsed with PBS, and immersed in the mixture of Solutions A and B. Tissues were stored at room temperature in the dark for 6 h, after which the impregnation solution was replaced with fresh solution and incubation continued for an additional 2 weeks at room temperature in the dark (at least 2 mL of impregnation solution per brain tissue). Tissues were then transferred to Solution C and incubated for 24 h, then replaced with fresh Solution C and incubated for an additional 7 days at room temperature in the dark. Brain tissues were sectioned at 100 µm thickness using a vibratome. Sections were mounted onto gelatin‑coated slides and allowed to dry at room temperature for 3 days. Slides were rinsed twice with distilled water (5 min each), then immersed in a mixture of Solution D, Solution E, and distilled water (1:1:2 ratio) for 15 min. After two additional rinses with distilled water (5 min each), sections were dehydrated through graded ethanol solutions (50%, 75%, and 95%; 5 min each), followed by four rinses in absolute ethanol (4 min each) and three rinses in xylene (5 min each). Finally, sections were coverslipped with mounting medium. Images were captured with a microscope, and dendritic spine density was quantified using ImageJ.
Statistical analysis
All results were reported as mean ± SD. The data were analyzed and graphed using GraphPad Prism 8.1.0. The Student’s t-test was used to compare two groups. For comparisons involving multiple groups, a one-way ANOVA was used, with pairwise comparisons performed using Dunnett's test. Statistical significance was set at p < 0.05.
Multivariate and correlation analyses
Principal component analysis (PCA) was performed using GraphPad Prism 8.0.1 to visualize group-wise clustering of SASP factors (IL-1α, IL-1β, IL-6, IL-17A, IFN-γ, CCL3, CCL4, and CCL5) among the WT, 5xFAD, and QFY (2.12 g/kg/day) groups (n = 8 per group). The score plot was generated based on the first two principal components. No data transformation was applied prior to PCA. Pearson correlation analysis was conducted to evaluate linear relationships between SASP factors and synaptic proteins (PSD-95, GAP-43, and SYN), as well as Aβ₁₋₄₀, Aβ₁₋₄₂, and the Aβ₁₋₄₂/Aβ₁₋₄₀ ratio. The analysis was performed using GraphPad Prism, with a two-tailed significance threshold of p < 0.05. Correlation matrices and a heatmap were generated to visualize the strength and direction of associations.
Results
Administration of QFY enhances learning and memory in 5xFAD mice
After QFY administration, a shuttle box test was conducted to assess the conditional active avoidance response of mice (Figure 2A–C). The results showed the number of active avoidances on days 1-4 (Figure 2A, p < 0.05) and the area under the curve (AUC) of active avoidance (Figure 2B, p < 0.01) during the learning period, and the number of active avoidances (Figure 2C, p < 0.05) during the test period were significantly reduced in 5xFAD mice compared with WT mice. The administration of donepezil and memantine significantly increased the number of active avoidances on day 2 during the learning period in 5xFAD mice (Figure 2A, p < 0.05). The administration of QFY significantly increased the number of active avoidances on days 3 and 4 (Figure 2A, p < 0.05), and the AUC of active avoidance (Figure 2B, p < 0.01 in QFY high-dose group) during the learning period, and the number of active avoidances (Figure 2C, p < 0.05 in QFY low-dose group) during the test period. This data indicates that the ability to perform an active avoidance response was impaired in 5xFAD mice, whereas QFY administration improved it.
We used the Morris water maze to evaluate spatial learning and memory in mice. The results showed (Figure 2D–I) that the escape latency on the first day (Figure 2D, p < 0.05) and AUC of escape latency (Figure 2E, p < 0.01) during learning period, escape latency in testing period (Figure 2F, p < 0.05) were obviously increased in 5xFAD mice compared with WT mice, the number of platform crossings (Figure 2H, p < 0.05) was reduced significantly in 5xFAD mice compared with WT mice. The administration of donepezil and memantine significantly reduced the AUC of escape latency during the learning period (Figure 2E, p < 0.05) and during the testing period (Figure 2F, p < 0.01). The treatment of QFY significantly reduced the AUC of escape latency during the learning period (Figure 2E, p < 0.05 in QFY low-dose and high-dose groups, p < 0.01 in QFY medium-dose group) and escape latency (Figure 2F, p < 0.01 in three QFY groups) during the testing period, and also prolonged the time in the target quadrant (Figure 2G, p < 0.05 in low-dose QFY group), increased the number of crossings (Figure 2H, p < 0.05 in low-dose QFY), evidently. These results indicate spatial learning and memory deficits in 5xFAD mice and that QFY treatment ameliorated these deficits.
Administration of QFY alleviates aging in 5xFAD mice
After QFY administration, gait, grip strength, and colony nesting tests were used to evaluate mouse aging. The results (Figure 3A) showed that, compared with WT mice, run duration, run maximum variation, and the step sequence regularity index decreased significantly in 5xFAD mice (p < 0.05). Run average speed (Figure 3A, p < 0.05), right forelimb (RF) stand index (Figure 3A, p < 0.01), left hindlimb (LH) stand index (Figure 3A, p < 0.05), RF max contact (Figure 3A, p < 0.01), right hindlimb (RH) swing speed (Figure 3A, p < 0.05), LH swing speed (Figure 3A, p < 0.01) and duty cycle (FIGURE 3A, p < 0.05) in 5xFAD was significant increased. The treatment of donepezil and memantine increased RH, stand index left forelimb (LF) stand index (Figure 3A, p < 0.05) and decreased LH duty cycle (Figure 3A, p < 0.01), also reduced RH initial dual stance (Figure 3A, p < 0.05) and LH terminal dual stance (Figure 3A, p < 0.01) of 5xFAD mice. The administration of QFY reduced LH duty cycle (Figure 3A, p < 0.05 in QFY low- and p < 0.01 in medium-dose group), RH initial dual stance (Figure 3A, p < 0.05 in QFY low-dose and high-dose group, p < 0.01 in QFY medium-dose group) and LH terminal dual stance (Figure 3A, p < 0.05 in QFY low-dose group, p < 0.01, in QFY medium- and high-dose group), also increased the run duration (Figure 3A, p < 0.05 in QFY low-and medium-dose group), run maximum variation (Figure 3A, p < 0.05 in QFY low- and medium-dose group), step sequence regularity index (Figure 3A, p < 0.01 in QFY low- and medium-dose group), LF stand index (Figure 3A, p < 0.05 in QFY low-dose group) and LH stand index (Figure 3A, p < 0.05 in QFY low-dose group) of 5xFAD mice. These results indicate that 5xFAD mice exhibited an abnormal gait, which QFY treatment restored.
After QFY administration, a grip-strength test was conducted to assess forelimb strength. The experimental data (Figure 3B) show that the forelimb strength of the 5xFAD mice was significantly weaker than that of WT mice (p < 0.01). The administration of donepezil and memantine (Figure 3B, p < 0.01), QFY (Figure 3B, p < 0.01, in QFY low-dose and high-dose groups) significantly increased the grip strength of the 5xFAD mice. These studies suggest that forelimb strength in 5xFAD mice has been enhanced by QFY treatment.
The results of colony nesting test showed (Figure 3C–G) that the nesting score of the 5xFAD mice were significantly lower than the WT mice at 6 h (Figure 3C, p < 0.05), 12 h and 24 h after the start of colony nesting (Figure 3DE, p < 0.01), and the untorn tissue weight was significantly higher of 5xFAD mice (Figure 3F, p < 0.01). Administration with donepezil and memantine just decreases the untorn tissue weight (Figure 3F, p < 0.01). The treatment with QFY increased nesting scores at 12 h (Figure 3D; QFY p < 0.05 in the QFY medium-dose group) and 24 h (Figure 3E; QFY p < 0.05 in the QFY low- and medium-dose groups). Moreover, the untorn tissue weight was significantly lower in the QFY low- and medium-dose groups (Figure 3F, p < 0.01) and in the QFY high-dose group (Figure 3F, p < 0.05). These results indicated that QFY treatment enhanced daily activity in 5xFAD mice.
Treatment of QFY reduces the synaptic structure damage in the cerebral cortex of 5xFAD mice
After QFY treatment, the cerebral cortex of mice was collected to measure the protein levels of GAP-43, PSD-95, and SYN by ELISA. The results (Figure 4A–C) showed that the contents of GAP-43 (Figure 4A, p < 0.05), PSD-95 (Figure 4B, p < 0.01), and SYN (Figure 4C, p < 0.01) in the cerebral cortex of the 5xFAD mice were significantly lower than those in WT mice. The protein content of GAP-43 (Figure 4A, p < 0.05), PSD-95 (Figure 4B, p < 0.01), and SYN (Figure 4C, p < 0.01) significantly increased after the treatment of QFY. The results of Golgi-Cox staining (Figure 4D) showed that the length of dendrites in the cerebral cortex of the 5xFAD mice was shorter (Figure 4G, p < 0.05) than that of WT mice. The treatment with QFY tended to increase the length, number, and density of dendritic spines.
Treatment of QFY reduced Aβ deposition and cellular senescence in the brains of 5xFAD mice
Aβ deposition and cellular senescence play important roles in AD pathogenesis. We used a combination of SA-β-Gal staining and Aβ immunohistochemistry to assess co-localization between SA-β-Gal and Aβ plaques. The result showed there was a large amount of SA-β-Gal aggregation and Aβ plaque deposition in the cerebral cortex of 5xFAD mice (Figure 5A), while only a few SA-β-Gal aggregations and Aβ plaque depositions were found after QFY treatment (Figure 5A). In addition, there was co-localization of SA-β-Gal and Aβ plaque.
Immunofluorescence assays revealed that 5xFAD mice brains were heavily laden with both Aβ plaques and p21-positive cells (Figure 5B,C). Administration of QFY significantly curtailed cortical Aβ plaque and attenuated p21 expression in these animals (Figure 5B,C). The results of ELISA showed that compared with WT mice, the content of Aβ1-42 and the ratio of Aβ1-42/ AΒ1-40 was significantly increased in the hippocampus of 5xFAD mice (Figure 5D,F, p < 0.01), while the treatment of QFY reduced them obviously (Figure 5D, p < 0.01; Figure 5F, p < 0.05, respectively).
Senescent cells typically secrete large amounts of SASP factors. The results of Luminex analysis showed the contents of IL-1α (Figure 5G, p < 0.05), IL-1β (Figure 5H, p < 0.01), IL-17A (Figure 5J, p < 0.05), CCL3 (Figure 5K, p < 0.01), CCL4 (Figure 5L, p < 0.01), CCL5 (Figure 5M, p < 0.01) and IFN-γ (Figure 5N, p < 0.01) were significantly increased in cortex of 5xFAD mice. QFY treatment decreased the contents of IL-1α (Figure 5G, p < 0.05), IL-1β (Figure 5H, p < 0.05), IL-6 (Figure 5I, p < 0.05), IL-17A (Figure 5J, p < 0.05), and IFN-γ (Figure 5N, p < 0.01) in the cortex significantly.
These data indicate that cellular senescence appeared in the brain of 5xFAD mice, while the treatment of QFY reduced cellular senescence in 5xFAD mice.
Effects of QFY ameliorating cognitive impairment and reducing the aging of brain cells in 5xFAD mice correlated with synaptic damage
Principal component analysis (PCA) was performed to assess the overall SASP expression profiles (IL‑1α, IL‑1β, IL‑6, IL‑17A, CCL3, CCL4, CCL5, and IFN‑γ) among WT, 5xFAD, and QFY‑treated groups (Figure 6A). The first two principal components accounted for 44.11% and 23.46% of the total variance, respectively. As shown in the PCA score plot (Figure 6A), the WT group was clearly separated from the 5xFAD group. Notably, the QFY‑treated group showed an intermediate position, clustering more closely with the WT group than with the 5xFAD group, suggesting partial normalization of the SASP profile after QFY treatment. Statistical analysis of PC1 scores (Figure 6B) revealed that the 5xFAD group exhibited significantly higher PC1 values than the WT group. PC2 scores (Figure 6C) also showed significant differences between the 5xFAD and WT groups. Loading plot analysis (Figure 6D) indicated that IL‑1α, IL‑1β, and IFN‑γ were the major contributors to PC1, whereas IL‑6 and CCL3 contributed more substantially to PC2.
We performed Pearson correlation analyses between IL-1α, IL-1β, and IFN-γ and the contents of PSD-95, GAP-43, and SYN in the cortex, as well as the contents of Aβ1-40 and Aβ1-42 and the ratio of Aβ1-42/Aβ1-40 in the hippocampus, and developed heatmaps to visualize the interplay between synaptic-associated protein and SASP function. IL-1α, IL-1β, and IFN-γ levels positively correlated with the contents of Aβ1-40 and Aβ1-42 and the ratio of Aβ1-42/Aβ1-40 (Figure 6E, p < 0.05), and negatively correlated with the content of SYN protein. The levels of IL-1α and IFN-γ were negatively correlated with the content of GAP-43 protein, and IL-1β was negatively correlated with PSD-95 protein (Figure 6E, p < 0.05). These data suggest that IL-1α, IL-1β, and IFN-γ are major contributors to synaptic dysfunction.
Data Availability:
All raw data supporting the findings of this study have been deposited in Figshare and are accessible via the private reviewer link: https://doi.org/10.6084/m9.figshare.33208029.
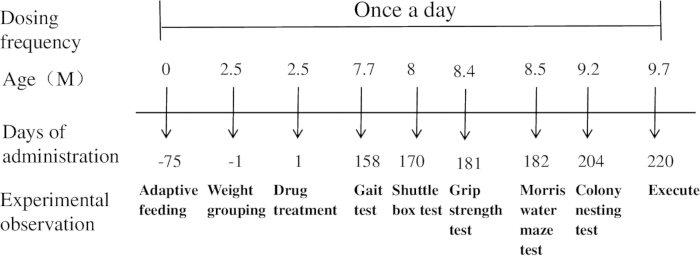
Figure 1: Schematic diagram of the experimental procedure. Please click here to view a larger version of this figure.
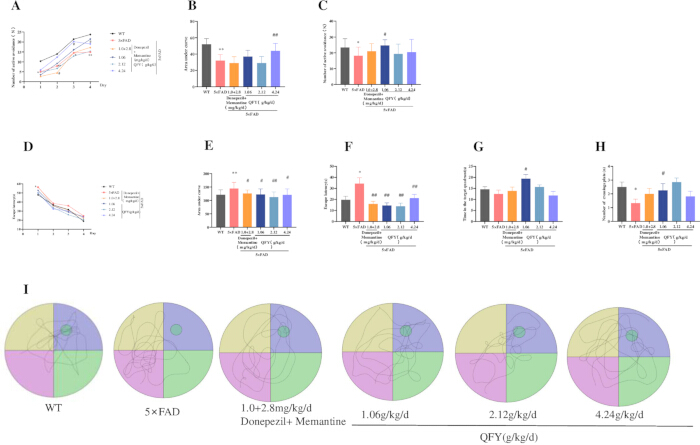
Figure 2: QFY administration improves learning and memory performance in 5xFAD mice. (A–C) Shuttle box test: (A) Number of active avoidance responses during the learning period. (B) Area under the curve (AUC) for active avoidance responses during the learning period. (C) Number of active avoidance responses during the test period. (D–I) Morris water maze test: (D) Escape latency during the learning period. (E) AUC for escape latency during the learning period. (F) Escape latency during the test period. (G) Time spent in the target quadrant. (H) Number of platform crossings. (I) Movement trajectories during the test period. Mean ± SD, n = 11–20 per group, with exact n indicated in each bar. * = p < 0.05, vs WT, Student`s t-test; # = p < 0.05, ## = p < 0.01, vs 5xFAD; One-way ANOVA followed by Dunnett's multiple comparisons test. Please click here to view a larger version of this figure.
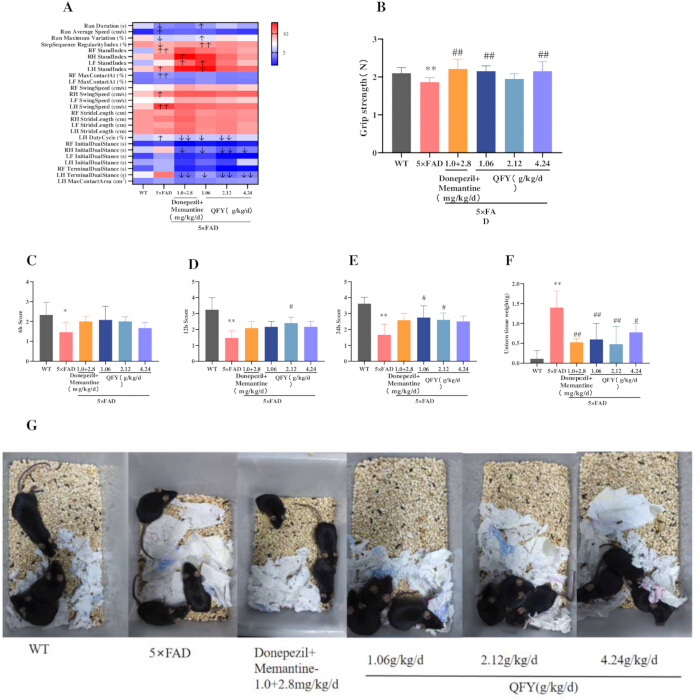
Figure 3: Effects of QFY administration on aging-associated functional measures in 5xFAD mice. (A) Gait heat map. The color scale is based on row‑wise Z‑score normalization, where red indicates values above the group mean, blue indicates values below the group mean, and white represents the mean level. (B) Grip strength test. (C–G) Colony nesting test: (C) Nesting score 6 h, (D) Nesting score at 12 h. (E) Nesting score at 24 h. (F) Untorn tissue weight. (G) Representative images of nests at 24 h. Mean ± SD, n = 3 per group, with exact n indicated in each bar. * = p < 0.05, ** = p < 0.01, vs WT, Student`s t-test; # = p < 0.05, ## = p < 0.01, vs 5x FAD, One-way ANOVA followed by Dunnett's multiple comparisons test. Please click here to view a larger version of this figure.
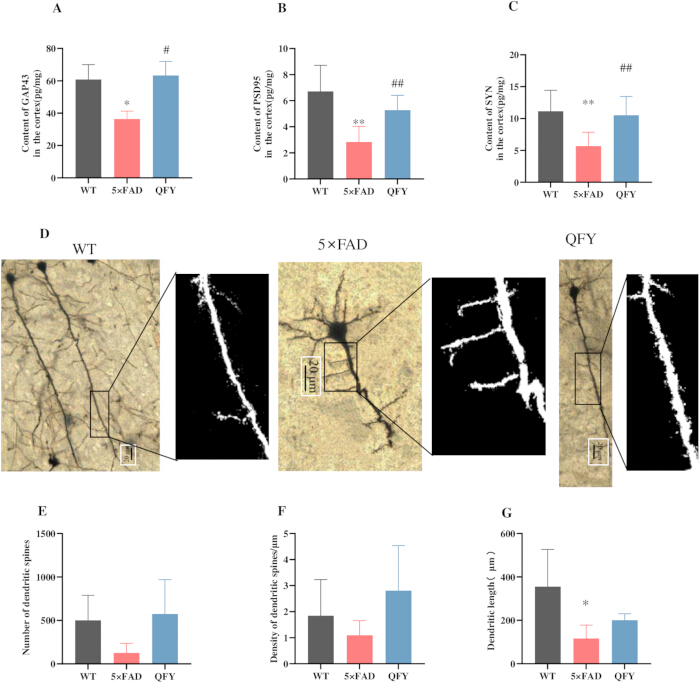
Figure 4: QFY attenuates synaptic structural alterations in the cerebral cortex of 5xFAD mice. (A) Content of GAP-43 in the cortex. (B) Content of PSD-95 in the cortex. (C) Content of SYN in the cortex. (D) Golgi-Cox staining. (E) Number of dendritic spines. (F) Density of dendritic spines. (G) Dendritic length. Mean ± SD, n = 3–14 per group, with exact n indicated in each bar. * = p < 0.05, ** = p < 0.01, vs WT, Student`s t-test; # = p < 0.05, ## = p < 0.01, vs 5xFAD, Student`s t-test. Please click here to view a larger version of this figure.
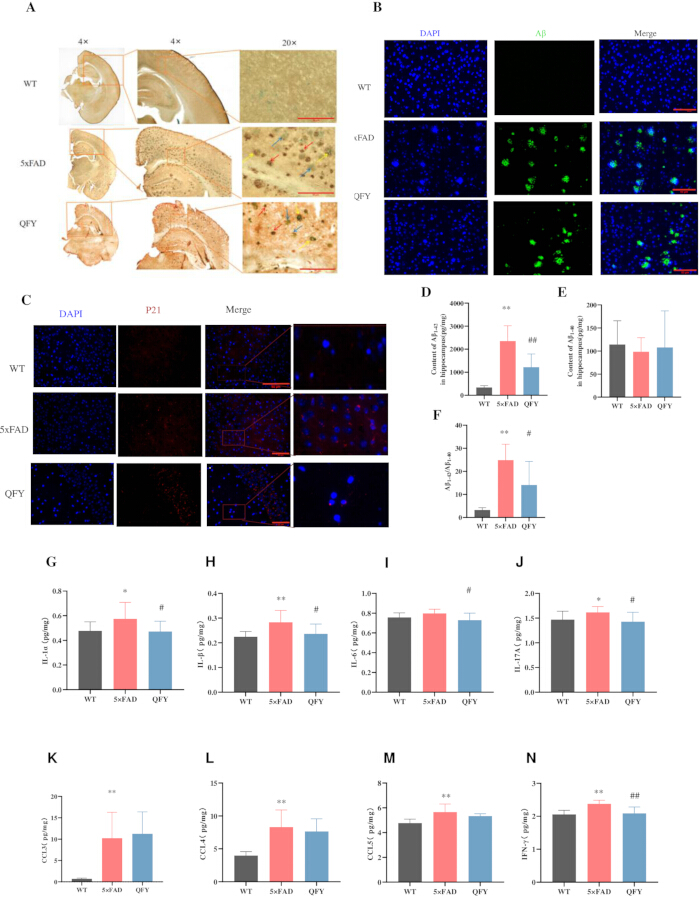
Figure 5: QFY reduced Aβ deposition and cell senescence in the brains of 5xFAD mice. (A) Combined SA-β-Gal staining and Aβ immunohistochemistry, SA-β-Gal (green, blue arrow), Aβ (brown, red arrow), SA-β-Gal + Aβ (yellow arrow), n = 3, Scale bar = 10 µm, 20x objective. (B) Immunofluorescence images showing Aβ in the cerebral cortex after treatment of QFY, n = 3, Scale bar = 50 µm, 40x objective. (C) Immunofluorescence images showing p21in the cerebral cortex after treatment of QFY. n = 1, Scale bar = 50 µm, 40x objective. (D–F) ELISA. (D) Content of Aβ1-42 in the hippocampus. (E) Content of Aβ1-40 in the hippocampus. (F) Aβ1-42/ Aβ1-40. (G–N) Luminex cytokine analysis. (G) Content of IL-1α in the cortex. (H) Content of IL-1β in the cortex. (I) Content of IL-6 in the cortex. (J) Content of IL-17A in the cortex. (K) Content of CCL3 in the cortex. (L) Content of CCL4 in the cortex. (M) Content of CCL5 in the cortex. (N) Content of IFN-γ in the cortex. Mean ± SD, n = 8–14 per group, with exact n indicated in each bar. * = p < 0.05, ** = p < 0.01, vs WT, Student’s t-test; # = p < 0.05 ## = p < 0.01, vs 5xFAD, Student’s t-test. Please click here to view a larger version of this figure.
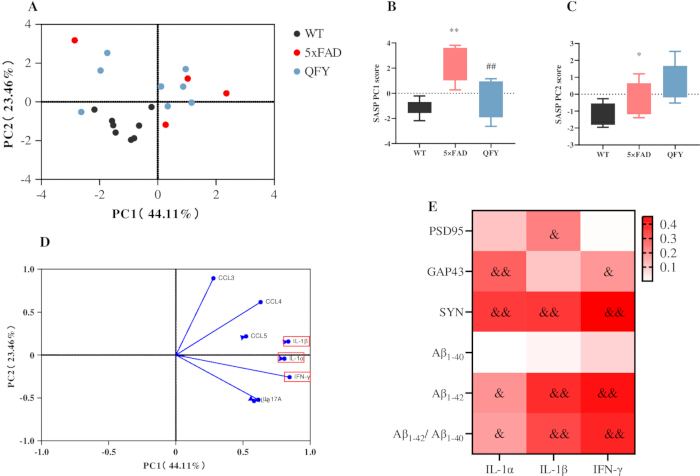
Figure 6: Principal component and correlation analyses of SASP factors, synaptic proteins, and Aβ levels in 5xFAD mice following QFY treatment. (A–D) Principal component analysis (PCA) of SASP factors. (A) PCA score plot. (B) PC1 scores. (C) PC2 scores. (D) PCA loading plot. (E) Heatmap generated from the correlation analysis between the SASP and PSD-95, GAP-43, SYN, Aβ1-40, Aβ1-42, and the ratio of Aβ1-42/Aβ1-40. Colors closer to red indicate higher R-values, while colors closer to white indicate lower R-values. Mean ± SD; n = 8 per group. * = p < 0.05, ** = p < 0.01,vs WT; ## = p < 0.01, vs 5xFAD, & = p < 0.05, && = p < 0.01, indicates a significant correlation. Pearson correlation analysis was used to assess associations between variables. Please click here to view a larger version of this figure.
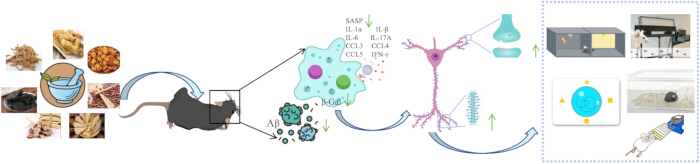
Figure 7: Proposed model of the effects of QFY on age-related cognitive decline and cellular senescence-associated phenotypes in 5xFAD mice. Please click here to view a larger version of this figure.
Discussion
Neural synaptic plasticity plays a key role in cognitive function. In the brains of AD patients, Aβ deposits spread across different regions, directly causing synaptic structural damage, loss of excitatory synapses, and cognitive decline28. GAP-43 (a presynaptic membrane protein)29, PSD-95 (a scaffold protein located in the postsynaptic membrane)30, and SYN (a phosphoprotein associated with synaptic vesicles)31 play an important role in synaptic structure plasticity and pathogenesis of AD32. The present study found that QFY treatment improved learning and memory, reduced Aβ plaque burden, and restored synaptic structure by increasing the number of dendritic spines and the protein levels of GAP-43, PSD-95, and SYN in the brains of 5xFAD mice.
Aging is a crucial risk factor in AD development and promotes Aβ production. The hallmark of aging includes decreased muscle strength, gait imbalance, and compromised basic activities of daily living33,34. The cellular senescence, characterized by SA-β-Gal, has been reported to be associated with aging and the onset of age-related diseases, such as AD11,35. Selective elimination of cellular senescence prolongs health lifespan and delays age-related diseases36. Removal of senescent cells by genetic or pharmacological approaches ameliorated Aβ deposition and improved learning and memory function in AD model mice37. Combination therapy with Dasatinib and Quercetin (D+Q) reduces oligodendrocyte progenitor cell senescence, alleviates neuroinflammation, reduces Aβ plaque and SA-β-Gal activity, prevents Aβ accumulation and cognitive impairment in APP/PS1 mice37. Memantine treatment significantly reduced SA-β-Gal activity in the brains of SAMP8 mice and improved spatial learning and memory; the same effect was observed with the combination of memantine and donepezil38. The present study found that QFY treatment improved gait, strengthened forelimb muscles, and improved abilities in basic activities of daily living, particularly by alleviating cellular senescence, as indicated by SA-β-Gal staining in the brains of 5xFAD mice.
AD patients and animal models both exhibit senescent astrocytes, microglia, endothelial cells, and neurons39,40. The secretion of SASP, which includes chemokines and inflammatory cytokines, is a distinctive feature of cellular senescence; excessive SASP secretion can lead to chronic inflammation, resulting in tissue damage and cellular senescence41. The continuous secretion of SASP, including IL-1α, IL-1β, IL-6, IL-8, IFN-γ, CCL2, CCL3, CCL4, CCL5, CXCL1, etc., promotes chronic inflammation, paracrine senescence of normal cells, changes in cellular metabolism and epigenetic regulation, and the continuous production of Aβ42,43,44,45. The levels of IL-1α, IL-1β, IL-6, IL-17A, and IFN-γ are significantly upregulated in the brains of AD patients and AD models46. Studies have shown that D+Q can inhibit the secretion of inflammatory factors, including IL-1α, IFN-γ, and reduce Aβ plaque and SA-β-Gal activity in APP/PS1 mice37. The study found that QFY reduced the expression of several SASP factors, including IL-1α, IL-1β, IL-6, IL-17A, and IFN-γ, thereby attenuating the senescent inflammatory phenotype.
p21 belongs to the CIP/KIP family of cyclin-dependent kinase inhibitors and acts as a proximal brake on cyclin-CDK2/4 complexes, thereby enforcing G1/G2 arrest when cellular stress, DNA damage, and aging occur. A sustained rise in p21 abundance is widely interpreted as entry into a stable senescent program47,48. Emerging data reveal that 5xFAD mice harbor an unusually high cerebral p21 burden, which is markedly attenuated upon D+Q co-treatment49. Consistent with this, the present study found that QFY administration significantly reduced cortical Aβ plaques and attenuated p21expression in these animals.
Collectively, these findings suggest an association between QFY treatment and improvements in age‑related cognitive decline and cellular senescence phenotypes in 5xFAD mice, alongside mitigated synaptic structural damage (Figure 7).
Several limitations of this study should be acknowledged. First, only male 5xFAD mice were used, and whether the observed effects are sex‑dependent remains to be determined. Secondly, although the present data demonstrate strong associations between attenuated senescence-related phenotypes and cognitive improvement, we did not conduct direct mechanistic intervention experiments to establish causality. Third, the translational relevance of the findings to human AD is limited by species differences and the lack of clinical pharmacokinetic data. Future studies incorporating female animals, senescence‑specific interventions, and well‑designed clinical trials are warranted to extend the findings.
Disclosures
The authors have no conflicts of interest to declare.
Acknowledgements
This work was supported by grants from the National Natural Science Foundation of China (82205078, 82374062), Shandong Provincial Natural Science Foundation (ZR2026MS1293, ZR2021QH157), Shandong Province Traditional Chinese Medicine Science and Technology Project (M20251730), Science and Technology Projects of Xizang Autonomous Region, China (XZ202601ZY0167), and Shandong Province Technology Innovation Guidance Program (Central Government-Guided Local Science and Technology Development Fund) (YDZX2023137), with the project titled 'Development and Industrialization Research of Tongli Enteric‑Coated Capsules as a Class 1 New Traditional Chinese Medicine.
Materials
| Name | Company | Catalog Number | Comments |
|---|---|---|---|
| Drugs | |||
| Donepezil | Shanghai Yuanye Technology | lot.J15HB188725 | |
| Memantine | Shanghai Yuanye Technology | lot. J21HB189391 | |
| Qi-fu-yin | Lunan Pharmaceutical Houpu Research and Development Center | lot. 2209001 | |
| Behavioral tests | |||
| CatWalk XT | Noldus | CatWalkXT 10.0 software | |
| Grip strength meter | Bileadbiosci | BLD-ZL-20 | |
| Morris water maze | Shanghai Xinruan Information Technology Co., Ltd | 120cm | |
| Shuttle box | Shanghai Xinruan Information Technology Co., Ltd | XR-XC404 | |
| Antibodies | |||
| Anti-Aβ1-42 antibody | Abcam | Cat# ab201061 | |
| Anti-p21/CIP1/CDKN1A antibody | Novus Biologicals | Cat# NBP3-15661 | |
| Assay Kits | |||
| Aβ1-40 ELISA kit | Thermo Fisher Scientific | Cat# KHB3482 | |
| Aβ1-42 ELISA kit | Thermo Fisher Scientific | Cat# KHB3442 | |
| Bio-Plex Pro Mouse Cytokine 23-plex Assay kit | R&D Systems | Cat# LXLBM23-1 | |
| GAP-43 ELISA kit | Jiangsu Enzyme Immunoassay Industry | Cat# MM-47506M1 | |
| Golgi-Cox staining kit | BeiJing Biolead Biology Sci & Tech Co | Cat# PK401 | |
| PSD-95 ELISA kit | Jiangsu Enzyme Immunoassay Industry | Cat# MM-45953M1 | |
| Senescence β-Galactosidase Staining kit | Beyotime | Cat# C0602 | |
| Synaptophysin (SYN) ELISA kit | Jiangsu Enzyme Immunoassay Industry | Cat# MM-46504M1 | |
| Chemicals & Reagents | |||
| Anti-rabbit and mouse IgG (secondary antibody) | Starter | Cat# S0C1001 | |
| DAB chromogen | Starter | Cat# S0C1001 | |
| Software | |||
| CatWalk XT | Noldus Information Technology | Version 10.0 | |
| ImageJ | National Institutes of Health (NIH) | Version 1.53 |
References
- Joe E, Ringman JM. Cognitive symptoms of Alzheimer's disease: clinical management and prevention. BMJ. 2019;367:l6217.
- Scheff SW, et al. Synaptic alterations in CA1 in mild Alzheimer disease and mild cognitive impairment. Neurology. 2007;68(18):1501-8.
- Muralidar S, et al. Role of tau protein in Alzheimer's disease: the prime pathological player. Int J Biol Macromol. 2020;163:1599-617.
- Hardy JA, Higgins GA. Alzheimer's disease: the amyloid cascade hypothesis. Science. 1992;256(5054):184-5.
- Calsolaro V, Edison P. Neuroinflammation in Alzheimer's disease: current evidence and future directions. Alzheimers Dement. 2016;12(6):719-32.
- Campisi J. Senescent cells, tumor suppression, and organismal aging: good citizens, bad neighbors. Cell. 2005;120(4):513-22.
- Yao R. An in-silico assessment suggests the potential effects of goji (fruit of Lycium barbarum L.) against aging-related diseases. Food Med Homol. 2025;2(2):9420036.
- Campisi J, d'Adda di Fagagna F. Cellular senescence: when bad things happen to good cells. Nat Rev Mol Cell Biol. 2007;8(9):729-40.
- Salminen A, Kaarniranta K, Kauppinen A. ER stress activates immunosuppressive network: implications for aging and Alzheimer's disease. J Mol Med (Berl). 2020;98(5):633-50.
- Mirabella F, et al. Prenatal interleukin 6 elevation increases glutamatergic synapse density and disrupts hippocampal connectivity in offspring. Immunity. 2021;54(11):2611-31.e8.
- Baker DJ, Petersen RC. Cellular senescence in brain aging and neurodegenerative diseases: evidence and perspectives. J Clin Invest. 2018;128(4):1208-16.
- Lucas V, Cavadas C, Aveleira CA, Hook V. Cellular senescence: from mechanisms to current biomarkers and senotherapies. Pharmacol Rev. 2023;75(4):675-713.
- Bloss EB, et al. Evidence for reduced experience-dependent dendritic spine plasticity in the aging prefrontal cortex. J Neurosci. 2011;31(21):7831-9.
- Ye XS, et al. The food and medicine homologous Chinese medicine from Leguminosae species: a comprehensive review on bioactive constituents with neuroprotective effects on nervous system. Food Med Homol. 2025;2(2):9420033.
- Dickstein DL, Weaver CM, Luebke JI, Hof PR. Dendritic spine changes associated with normal aging. Neuroscience. 2013;251:21-32.
- Wang SY, et al. Qifu-Yin attenuates AGEs-induced Alzheimer-like pathophysiological changes through the RAGE/NF-kappaB pathway. Chin J Nat Med. 2014;12(12):920-8.
- Yang X, et al. Qi-fu-yin attenuated cognitive disorders in 5xFAD mice of Alzheimer's disease animal model by regulating immunity. Front Neurol. 2023;14:1183764.
- Xiao QY, et al. Effects of Qi-Fu-Yin on aging of APP/PS1 transgenic mice by regulating the intestinal microbiome. Front Cell Infect Microbiol. 2023;12:1048513.
- Chen K, et al. Safety and toxicity of Qi-Fu Yin, a classical traditional Chinese medicine prescription: a nonclinical research. J Appl Toxicol. 2025;45(9):1811-38.
- Wang L, Qiao P, Yue L, Sun R. Is Qi Fu Yin effective in clinical treatment of dementia? A meta-analysis of 697 patients. Medicine (Baltimore). 2021;100(5):e24526.
- Li H, et al. Identification of chemical components of Qi-Fu-Yin and its prototype components and metabolites in rat plasma and cerebrospinal fluid via UPLC-Q-TOF-MS. Evid Based Complement Alternat Med. 2021;2021:1995766.
- Lei X, et al. Integrating network pharmacology and component analysis to study the potential mechanisms of Qi-Fu-Yin Decoction in treating Alzheimer's disease. Drug Des Devel Ther. 2023;17:2841-58. doi:10.2147/DDDT.S402624.
- Takeshita H, et al. Modified forelimb grip strength test detects aging-associated physiological decline in skeletal muscle function in male mice. Sci Rep. 2017;7:42323.
- Caggiano V, et al. Midbrain circuits that set locomotor speed and gait selection. Nature. 2018;553(7689):455-60.
- Ehret B, et al. Population-level coding of avoidance learning in medial prefrontal cortex. Nat Neurosci. 2024;27(9):1805-15.
- Curdt N, et al. Search strategy analysis of Tg4-42 Alzheimer mice in the Morris water maze reveals early spatial navigation deficits. Sci Rep. 2022;12:5451.
- Deacon RMJ. Assessing nest building in mice. Nat Protoc. 2006;1(3):1117-9.
- Tu S, Okamoto SI, Lipton SA, Xu H. Oligomeric Aβ-induced synaptic dysfunction in Alzheimer's disease. Mol Neurodegener. 2014;9:48.
- Benowitz LI, Routtenberg A. GAP-43: an intrinsic determinant of neuronal development and plasticity. Trends Neurosci. 1997;20(2):84-91.
- Dore K, et al. PSD-95 protects synapses from β-amyloid. Cell Rep. 2021;35(9):109194.
- Kokotos AC, et al. Synaptophysin sustains presynaptic performance by preserving vesicular synaptobrevin-II levels. J Neurochem. 2019;151(1):28-37.
- Martin SB, et al. Synaptophysin and Synaptojanin-1 in Down syndrome are differentially affected by Alzheimer's disease. J Alzheimers Dis. 2014;42(3):767-75.
- Namioka N, et al. Oxidative stress and inflammation are associated with physical frailty in patients with Alzheimer's disease. Geriatr Gerontol Int. 2016;17(6):913-8.
- Kojima G, Liljas A, Iliffe S, Walters K. Prevalence of frailty in mild to moderate Alzheimer's disease: a systematic review and meta-analysis. Curr Alzheimer Res. 2017;14(12):1256-63.
- Dimri GP, et al. A biomarker that identifies senescent human cells in culture and in aging skin in vivo. Proc Natl Acad Sci U S A. 1995;92(20):9363-7.
- Baker DJ, et al. Naturally occurring p16Ink4a-positive cells shorten healthy lifespan. Nature. 2016;530(7589):184-9.
- Zhang P, et al. Senolytic therapy alleviates Abeta-associated oligodendrocyte progenitor cell senescence and cognitive deficits in an Alzheimer's disease model. Nat Neurosci. 2019;22(5):719-28.
- Ota H, Ogawa S, Ouchi Y, Akishita M. Protective effects of NMDA receptor antagonist, memantine, against senescence of PC12 cells: a possible role of nNOS and combined effects with donepezil. Exp Gerontol. 2015;72:109-16.
- Herdy JR, et al. Increased post-mitotic senescence in aged human neurons is a pathological feature of Alzheimer's disease. Cell Stem Cell. 2022;29(12):1637-52.e6.
- Hu Y, et al. Replicative senescence dictates the emergence of disease-associated microglia and contributes to Abeta pathology. Cell Rep. 2021;35(10):109228.
- Tchkonia T, et al. Cellular senescence and the senescent secretory phenotype: therapeutic opportunities. J Clin Invest. 2013;123(3):966-72.
- Guerrero A, De Strooper B, Arancibia-Cárcamo IL. Cellular senescence at the crossroads of inflammation and Alzheimer's disease. Trends Neurosci. 2021;44(9):714-27.
- Acosta JC, et al. A complex secretory program orchestrated by the inflammasome controls paracrine senescence. Nat Cell Biol. 2013;15(8):978-90.
- Wang B, Han J, Elisseeff JH, Demaria M. The senescence-associated secretory phenotype and its physiological and pathological implications. Nat Rev Mol Cell Biol. 2024;25(12):958-78.
- Gaikwad S, Senapati S, Haque MA, Kayed R. Senescence, brain inflammation, and oligomeric tau drive cognitive decline in Alzheimer's disease: evidence from clinical and preclinical studies. Alzheimers Dement. 2024;20(1):709-27.
- Si Z, Sun L, Wang X. Evidence and perspectives of cell senescence in neurodegenerative diseases. Biomed Pharmacother. 2021;137:111327.
- Chen X, et al. Senescence-like changes induced by expression of p21Waf1/Cip1 in NIH3T3 cell line. Cell Res. 2002;12(3-4):229-33.
- Engeland K. Cell cycle regulation: p53-p21-RB signaling. Cell Death Differ. 2022;29(5):946-60.
- Choi I, et al. Autophagy enables microglia to engage amyloid plaques and prevents microglial senescence. Nat Cell Biol. 2023;25(7):963-74.