This research presents a screen-based survey-to-partial least squares structural equation modeling (PLS-SEM) protocol for testing mediation and moderation, conducting common-method diagnostics, interpreting simple slopes, and assessing predictive relevance in AI-embedded workplace research.
A subscription to JoVE is required to view this content. Sign in or start your free trial.
Research Article
Job Stress and Individual Creativity: A Screen-Based Partial Least Squares Structural Equation Modeling Protocol for AI-Enabled Workplaces
In This Article
Summary
Abstract
The increasing use of artificial intelligence (AI) in organizations is reshaping employees’ job demands, leadership perceptions, and opportunities for creativity. Drawing on the Job Demands–Resources (JD–R) model and Social Learning Theory, this study examines whether employees’ perceptions of ethical leadership mediate the relationship between job stress and individual creativity, and whether organizational AI embeddedness amplifies this relationship. Using partial least squares structural equation modeling (PLS-SEM) with 5,000 bootstrap resamples, the findings show that job stress negatively influences ethical leadership perception, while ethical leadership perception positively affects creativity. Job stress was not directly related to creativity; instead, ethical leadership perception served as a significant indirect pathway. In addition, organizational AI embeddedness strengthened the relationship between perceptions of ethical leadership and creativity. These findings suggest that creativity in AI-enabled workplaces is shaped less by technology itself and more by organizational psychological mechanisms. Organizations seeking to enhance creativity during digital transformation should therefore manage job stress and foster ethical leadership environments, rather than focusing solely on AI implementation. This protocol uses the empirical model as a worked example for demonstrating a reproducible survey-to-PLS-SEM workflow.
Introduction
Artificial intelligence (AI) has transformed how employees do their work, understand the nature of their job requirements, and identify opportunities for creativity, as organizations begin to adopt AI for decision support, automation, and coordination1,2,3,4. AI-enabled capabilities can increase the scope of what information is accessible, and support experimentation, but in and of themselves fail to encourage people to behave creatively5,6. Instead, employees’ creative behavior is contingent on their perceptions of the legitimacy of experimentation, fairness of treatment for making mistakes, and supportiveness of their leaders7,8. This protocol defines creativity as a perception-based process in organizational psychology rather than a technology-based product, while allowing the process from recruitment to inference to be repeatable and transparent9. The procedure does not film or observe participants in a lab, but the phenomenon of interest is still behavior, as employees do respond to job stress, make sense of social information, and develop creative responses to an AI-infused work situation. Behavioral scope is therefore addressed through measurable workplace behavior and interpretive constructs related to creativity, leadership perception, and AI-related contextual response rather than physical behavior6,10.
AI-embedded workplaces are defined as work settings in which employees perceive AI as a recurring part of work coordination, decision support, evaluation, and problem-solving rather than as an occasional optional tool. This construct is narrower than broad digital transformation, different from AI adoption as introduction, different from AI maturity as implementation stage, and different from AI capability as technical competence. Because employees may not know the objective extent of AI use across all functions, the construct is treated as perceived organizational AI embeddedness, which is appropriate for a perception-based model of ethical leadership perception and individual creativity1,4,11,12.
This protocol addresses three mutually reinforcing gaps. First, less is known about what constitutes ethical leadership in AI-embedded workplace settings and how ethical leadership perceptions relate to job stress as it pertains to creativity. This relationship is important because the effects of job stress on creativity vary once contextualized and interpreted13,14. Second, while research on creativity in AI-embedded workplaces has often considered AI as a tool or measure of AI adoption, there is less evidence of how organization-wide AI embeddedness shapes behavioral responses to leader cues or interpretations of AI-related uncertainty4,11,12. Third, studies using survey-based data in organizational psychology often condense everything from recruitment and screening to construct measurement, data preparation, and subsequent Partial Least Squares Structural Equation Modeling (PLS-SEM) mediation and moderation analyses into short descriptions, even though measurement validity, discriminant validity, collinearity, and predictive relevance are all important to consider15,16,17,18. The authors make that workflow visible in this procedure by reducing 342 survey starts to 310 usable cases, separating construct blocks, testing full collinearity with VIF and a 3.3 cutoff, testing direct, indirect, and interaction effects with 5,000 bootstrapped resamples, and finally including PLSpredict as a predictive-relevance screen15,16,18,19.
The primary contribution is therefore methodological. The Job Stress-Ethical Leadership-Creativity model is retained as the worked example, but the main contribution is to make normally hidden analytic decisions visible: eligibility screening, item-code retention, construct separation, measurement validation, collinearity and common-method diagnostics, bootstrapping, effect decomposition, simple-slope interpretation, and PLSpredict assessment15,18,19. Following the Job Demands-Resources model20,21, job stress is a demand that consumes the cognitive and emotional resources needed to engage creatively, therefore affecting creativity9. Employees focus their discretionary effort on generating novel and unique solutions through cognitive flexibility, experimentation, and new work methods. They have less time to generate ideas when they face long deadlines in a turbulent work environment, and tend to focus on error prevention and task completion13,14. Not all stress is detrimental to creativity, and certain levels of challenge may promote idea generation among individuals who are granted autonomy in the task and are provided with social support in the workplace13,22. In contrast, sustained pressure could lead to a negative relationship.
Accordingly, the authors hypothesize that job stress is negatively associated with individual creativity (H1). Job stress may also influence the way certain employees view their social surroundings. During periods of flux and stress, employees may develop heightened sensitivity to signals of fairness, support, and responsiveness8. A delayed response from management or inconsistent decision-making, from this angle, could be read as poor coordination in one context and as neglect in another. The key is that when people are under stress, they tend to place more emphasis on what leaders signal to them, and, as such, in situations without visible fairness and support, they are more likely to form negative interpretations8,10. Next, the authors hypothesize that job stress is negatively associated with employees’ perceptions of ethical leadership (H2). Ethical leadership perception is how employees see their leader as fair, honest, open, and having good moral values10,23,24. From a social-learning theory perspective, ethical leadership perception indicates whether employees will use their voice, take risks by trying new things, or experiment7. Employees will be more likely to provide input on new ways of working and try new ideas when they perceive their leader as ethical. Fair and trustworthy leaders will create more opportunities for employees to engage in discretionary creative behaviors6,7,10.
Accordingly, the authors hypothesize that employees’ perceptions of ethical leadership are positively associated with individual creativity (H3). The model also introduces an indirect pathway in which ethical leadership perception mediates the effect of job stress on individual creativity. Stress-related influences on creativity appear inconsistent and imply that the relationship is not a straightforward one14,22. Two employees may be exposed to the same level of stress, but one may continue to perceive the leader as ethical and the workplace as safe enough to share ideas. The other employee may stop sharing ideas when they perceive the leader as unethical or feel treated unfairly6,7. This pathway indicates the influence of social interpretation and suggests that focusing solely on the direct effect of job stress on creative output may be insufficient.
Authors also hypothesize that employees’ perceptions of ethical leadership mediate the relationship between job stress and individual creativity (H4). Organizational AI embeddedness is associated with workplace settings in which AI is used to mediate, evaluate, and support employees’ work1,25,26. AI-embedded organizational environments expand employees’ access to information, reduce the time needed to accomplish some work, and provide greater scope for recombining ideas. At the same time, they may raise questions about who or what will be held accountable, what types of assessments will occur, and what forms of experimentation are acceptable27. In situations like these, employees are likely to attend more to ethical leadership cues when judging whether AI-enabled experimentation, AI error tolerance, and AI-assisted idea generation are legitimate and safe11,30,31. Thus, the authors predict that organizational AI embeddedness will increase the relevance of perceptions of ethical leadership to individual creativity.
Accordingly, the authors hypothesize that organizational AI embeddedness moderates the relationship between employees’ perceptions of ethical leadership and individual creativity, such that the positive relationship is stronger when organizational AI embeddedness is high (H5). This protocol is designed for behavioral researchers studying self-reported workplace behavior and its social interpretation when direct observation is impractical or ethically unwarranted. The manuscript contributes in three ways. First, it departs from traditional understandings of creativity in AI-enabled workplaces as a manifestation of technological outputs and technical-scientific knowledge, and presents that process as underpinned by perception as an organizational psychology process6,9. Second, it extends this argument by demonstrating that perceptions of ethical leadership mediate the relationship between job stress and individual creativity, and that the relationship between perceptions of ethical leadership and creativity is moderated by organizational AI embeddedness4,10,14. Third, a screen-based survey and PLS-SEM procedure are introduced to evaluate mediation and moderation processes15,18,19. Its advantage is making hidden decisions visible, including employment screening, construct separation, validity and collinearity checks, bootstrapping, effect decomposition, moderation interpretation, PLSpredict analysis, and cautious interpretation of cross-sectional relationships.
Access restricted. Please log in or start a trial to view this content.
Protocol
The research process followed all ethical protocols for research with human participants. All participant information was collected anonymously via online survey technology and digital informed-consent procedures. No information identifying any participant was collected, and no video of any participant was recorded. All participants were presented with a digital informed-consent screen prior to reaching the survey. The screen explained the study's academic purpose, that participation was voluntary, that responses would be kept confidential, and that the data would be used for research purposes only. Participants who did not actively acknowledge informed consent were removed from the survey before any study item was presented. Ethical approval or exemption information should be reported in the ethics statement in accordance with the submitting institution’s requirements. This protocol’s visual element is intended to present these steps as a screen-based video demonstration of recruitment, consent, screening, de-identified data processing, SmartPLS model creation, bootstrapping, effect decomposition, and PLSpredict evaluation, rather than as an additional workflow figure. The sequence of tables mimics the sequence of steps in the video demonstration. Table 1 identifies the sample retained after recruitment, consent, screening, and quality checks. The basis for measuring the construct blocks is presented in Table 2. Tables 3–5 report measurement quality, discriminant validity, and collinearity diagnostics. Table 6 reports the outputs of the hypothesis testing. Table 7 displays the decomposition of direct and indirect effects. Table 8 is the PLSpredict checkpoint. Tables 1–8, therefore, represent the trail of the output from survey entry to statistical inference for the screen-based workflow15,18. All the platforms/tools used in this study are listed in the Table of Materials.
Research model
In the worked example, ethical leadership perception mediates the effects of job stress on individual creativity, and organizational AI embeddedness moderates the effect of ethical leadership perception on individual creativity. Figure 1 presents the conceptual model, in which H4 refers to the impact of ethical leadership perception as an indirect pathway, and H5 to the moderation of ethical leadership perception by organizational AI embeddedness. The aim of the model is not to depict a causal model, but to depict a screen-based mediation and moderation workflow.
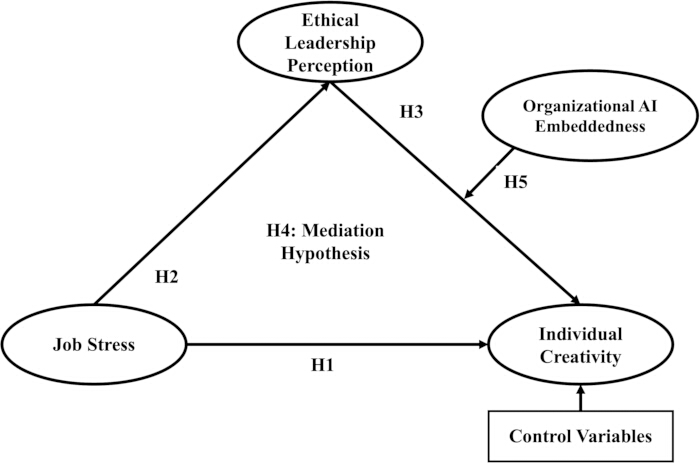
Figure 1: Conceptual model. The diagram presents job stress (JS) as the predictor, ethical leadership perception (EL) as the mediator, individual creativity (IC) as the outcome, and organizational AI embeddedness (OA) as the moderator of the EL–IC relationship. Solid arrows denote the hypothesized direct paths, the mediated pathway is JS > EL > IC, and the interaction term represents EL × OA > IC. Please click here to view a larger version of this figure.
Research data
An internet-based participant-recruitment system and an internet-based survey system are used to collect anonymous survey responses from full-time employees in the target workplace population. Filters should be set before launch, and a survey-based screening item should be used to confirm eligibility prior to the display of the construct blocks. Responses of non-consenting participants, ineligible respondents, and responses that fail quality-control checks are excluded prior to analysis. In the worked example, the authors were left with 310 valid completed surveys from an initial 342 starts after employment-status screening and quality-control checks. Table 1 presents the demographic information for the final valid sample.
Table 1: Descriptive characteristics of the sample (n = 310). The table summarizes the retained respondents by demographic and employment characteristics after consent, eligibility screening, and quality-control exclusions; n denotes sample size. Please click here to download this Table.
Measures
A seven-point Likert scale is used for all items (1 = strongly disagree; 7 = strongly agree). The survey includes measurement blocks for job stress, ethical leadership perception, individual creativity, and organizational AI embeddedness. Retain item codes when designing and exporting the survey to ensure that each measured indicator can be mapped to its corresponding latent variable during model specification. The full set of measurement items and sources is provided in Table 2.
Table 2: Measurement items and sources. This table provides the questionnaire items, construct assignments, and scale sources. Abbreviations: JS = job stress; EL = ethical leadership perception; IC = individual creativity; OA = organizational AI embeddedness. Please click here to download this Table.
Before importing data into the PLS-SEM software, researchers should export the completed dataset in .csv format. Names, email addresses, IP addresses, and other direct identifiers should be removed from the export to prevent unintended disclosure of participant information. The exported file should be inspected for missing values, failed screening responses, straight-lining, failed attention checks, and variable-name errors. Only the cleaned indicator variables and control variables required by the model should be retained. The initial survey starts, final valid sample, reliability ranges, AVE range, structural VIF range, and bootstrap resampling setting should be recorded for later reporting.
PLS-SEM analytic workflow
To analyze the hypotheses, the researchers should employ PLS-SEM. In SmartPLS 4.1, a new project is to be created by importing the cleaned .csv file. The latent constructs should be placed on the model canvas, and the retained indicators should be assigned to JS, EL, IC, and OA. These direct paths can be drawn on the model canvas; the indirect path can be specified as JS > EL > IC, and the product-indicator interaction term can be created as OA × EL > IC as well. Researchers should execute the PLS algorithm before they assess the structural paths. In SmartPLS, go to Calculate > PLS Algorithm and take note of the estimation settings, including the path-weighting scheme, maximum number of iterations, and the stop criterion if provided. Once the PLS algorithm has been executed, scholars should evaluate Cronbach's alpha, composite reliability, AVE, outer loadings, Fornell-Larcker, HTMT ratio, and VIF values17,18,19. The outputs for assessing the reliability, validity, and collinearity are reported in Tables 3–5. Authors are advised to perform a full collinearity test to check for potential common-method bias. Structural VIF values should be viewed as a diagnostic indicator of potential same-source bias, not as an indicator that same-source bias has been removed.
The protocol distinguishes outer model VIFs from structural/full collinearity VIFs. If an outer VIF exceeds 3.3 but remains below 5.0, the value should be recognized as a potential indicator-level collinearity concern rather than treated as a common-method bias diagnostic. Full collinearity VIFs are interpreted separately as a same-source diagnostic screen, not as proof that common method bias has been eliminated15,18,19. Measurement quality and collinearity diagnostics should be done prior to interpreting path coefficients, indirect effects, and interaction terms. To calculate direct paths, specific indirect effects, and the moderation effect, researchers must perform the bootstrapping procedure with 5,000 resamples. With 5,000 subsamples, perform a two-tailed test at α = 0.05, and leave the sign-change and confidence-interval options as in the project. Table 6 presents the path coefficient, the specific indirect effect, and the interaction results. After testing the hypotheses, the sections for the specific indirect effects and total effects in the output should be reviewed to assess the direct JS > IC relationship relative to the indirect path through EL and to capture the effect decomposition in Table 7. This procedure avoids interpreting the non-significant direct stress–creativity path in isolation from the significant perception-based indirect path. It is recommended that researchers run PLSpredict for the endogenous constructs and report Q2predict, RMSE, and MAE statistics as a bounded predictive-relevance assessment. Present results for Q2predict, RMSE, and MAE for the endogenous constructs EL and IC, along with those for the linear-model benchmark, if provided, in Table 8. These results are to be interpreted as bounded predictive-relevance evidence rather than full forecasting evidence18.
The protocol is intentionally focused rather than statistically ornate. Researchers who later compare countries, occupations, or managerial levels can add measurement-invariance testing, multi-group analysis, segmentation, or importance-performance mapping after the baseline mediation and moderation workflow is established. Statistically significant indirect or interaction paths should not be interpreted as causal effects when the data are cross-sectional. They should be presented as theory-consistent associations unless longitudinal, experimental, or multi-source evidence is available. This caution is repeated in the Results and Discussion so that the mediation and moderation paths are presented as theory-consistent associations rather than causal effects15,18. If exact menu labels differ across SmartPLS versions, researchers should use the equivalent menu path and record the software version, algorithm settings, and resampling settings in the Table of Materials or in a reproducibility note.
Access restricted. Please log in or start a trial to view this content.
Results
Assessing the measurement model
The measurement model was subsequently used to assess construct reliability and validity. Reliability, convergent validity, item loadings, and collinearity diagnostics are presented in Table 3. Cronbach's alpha values ranging from 0.877 to 0.932 exceed the cutoff of 0.70. The estimates of composite reliability were acceptable, with CR (ρ_a) ranging from 0.880 to 0.959 and CR (ρ_c) ranging from 0.911 to 0.945. The AVE was substantially above the ...
Access restricted. Please log in or start a trial to view this content.
Discussion
The protocol presents a transferable survey-based method for understanding how psychological demands, leadership perceptions, and AI-connected contextual conditions affect employee outcomes in digitally transformed work contexts1,2,4. Its main contribution is not a filmed manipulation, but a traceable analytic workflow for online recruitment, consent, and screening, measuring constructs of interest, preparing data, specifying a ...
Access restricted. Please log in or start a trial to view this content.
Disclosures
The authors declare no competing interests. During manuscript preparation and revision, an AI language model was used for language editing and structural refinement. The authors reviewed, edited, and approved the final manuscript and take full responsibility for its content.
Acknowledgements
This work was supported by research funding from ASSIST University. The authors thank the survey participants for their time and contributions to this study.
Access restricted. Please log in or start a trial to view this content.
Materials
| Name | Company | Catalog Number | Comments |
|---|---|---|---|
| ChatGPT (AI Language Model) | OpenAI | N/A | Used only for language editing, grammar checking, and structural refinement during manuscript preparation. The tool was not used for data collection, statistical analysis, or interpretation of the empirical results. The authors reviewed, edited, and approved the final manuscript and take full responsibility for its content. URL: https://chatgpt.com/ |
| Prolific (Online Participant Recruitment Platform) | Prolific Academic Ltd. | N/A | Online platform used to recruit survey participants for the worked example. Participants were screened using predefined eligibility criteria, including full-time employment and relevance to the target workplace population. URL: https://www.prolific.com/ |
| Qualtrics (Online Survey Platform) | Qualtrics, LLC | N/A | Web-based survey platform used for questionnaire design, digital informed consent, screening, construct-block presentation, response-data collection, and de-identified dataset export. Measurement items were administered using a 7-point Likert-type scale ranging from 1 = strongly disagree to 7 = strongly agree. URL: https://www.qualtrics.com/ |
| SmartPLS 4.1 (PLS-SEM Software) | SmartPLS GmbH | Version 4.1 | Used for partial least squares structural equation modeling (PLS-SEM), including model specification, PLS algorithm estimation, measurement-model assessment, collinearity diagnostics, bootstrapping with 5,000 resamples, specific indirect-effect testing, interaction-term estimation, effect decomposition, and PLSpredict assessment. URL: https://smartpls.com/ |