The protocol details how to design and assemble blood vessels in vitro with tortuous or aneurysm segments, using either an extrusion printer or hand application of pasteurized sacrificial ink, and how to assay for hemodynamic flow and endothelial cell responses.
Method Article
3D-Printed Sacrificial Ink Platform for High-Resolution Imaging of Endothelial Cell Function in Tortuous Vessels and Aneurysms
In This Article
Summary
Abstract
Vascular tortuosity and aneurysms pose significant health risks across a variety of human tissues and blood vessel types. These alterations in vessel shape cause anomalies in blood flow dynamics, which significantly impact endothelial function. Animal models of these vascular disease states have been illustrative in some cases, but are both expensive to establish and limited to the animal species’ physiology. In response to this, in vitro 3D organ-on-a-chip (OOC) models have become a powerful toolset for assessing vascular function and endothelial responses in human cells. While each of the OOC models has its strengths, an accessible system is needed for studying vessel permeability, a key indicator of vascular function in curved vessels and aneurysms under physiological shear rate and pressure. Here, the presented methodology enables the study of human endothelial cell responses to flow anomalies in an economical curved-vessel model system using an entry-level bioprinter that produces vessels that are compatible with physiological fluid flow rates, permeability studies, high-resolution light microscopy, and extracellular matrix support with physiological stiffness.
Introduction
Blood vessel morphology is an important indicator of vascular function, as vessel tortuosity and aneurysms are key hallmarks of various diseases and health risks. Vascular tortuosity can be congenital, as in syndromes such as Marfan1, Turner2, and Loeys-Dietz3, or develop later in life as a hallmark of several diseases, including hypertension, diabetes, cancer, and possibly atherosclerosis4,5,6. Aneurysms of arterial tissues, including carotid7, coronary8, femoral9, aortic10, and cerebral11 arteries, are associated with morbidity and health risks due to spontaneous dissection or rupture. In addition to causing flow irregularities and associated endothelial inflammation, vascular tortuosity and aneurysms can indicate underlying tissue dysfunction and inflammation. For example, in newborns and children, arterial tortuosity syndrome is clinically predictive of childhood stroke12, persistent pulmonary hypertension, and aortic dissection4,13. In adults, retinal vasculitis presents with tortuous retinal vessels that become less pronounced as the underlying inflammation resolves14. How tortuosity is sensed and translated into aberrant signals that drive disease progression remains an active area of study. Endothelial cells lining blood vessels are thought to act as primary sensors in this process. Disturbed or slow flow induced by vascular tortuosity or aneurysms alters shear stress, eliciting endothelial changes in inflammatory signaling15 and barrier function16. Endothelial cells are highly sensitive to fluid flow through mechanisms involving primary cilia17, mechanosensitive adhesion proteins18,19, and ion channels20,21, which drive signaling that can activate leakage, inflammation, and endothelial reprogramming22,23,24. Methods for studying endothelial responses to tortuous vascular geometry are therefore important for the development of vascular therapies.
Endothelial functions in vascular disease states have been modeled using in vivo animal models, organ-on-a-chip (OOC) systems, and bioprinting approaches. Mouse models enable control of known disease-gene expression and incorporate the complexity of tissue architecture and physiology, including mural and immune cell involvement. Mouse models of atherosclerosis25, Marfan syndrome26, and various aneurysms27,28,29provide insights into pathologies associated with vascular dysfunction. Despite these advantages, direct observation, experimental manipulation, and quantification of endothelial cells are difficult to achieve, aside from bulk methods such as RNA sequencing. Furthermore, animal models present ethical and cost considerations and are limited by species-specific physiology.
Several in vitro OOC approaches have been developed to study human endothelial responses to laminar and disturbed flow30,31,32in both 2D33,34 and 3D35,36,37systems. The extensive OOC literature38 has largely been driven by biomedical engineering, with design features addressing specific biomedical questions. Many vascular OOC models use polydimethylsiloxane (PDMS) supports to control vessel architecture38. These models provide high-resolution control of complex geometries and enable modeling of organ-vascular interactions, including those involving the liver39, brain40, and lung41. However, limitations remain. The low permeability of PDMS and similar polymers to macromolecules can restrict studies of vascular barrier function. In addition, most cured PDMS has a stiffness of approximately 0.8–10 MPa42, although alternative formulations can achieve more physiological ranges of 8–200 kPa43. Estimates of vascular basement membrane stiffness range from ~350 Pa44 to ~70 kPa45, depending on vessel type and measurement methodology, with most healthy vascular basement membranes in the 2–3 kPa range46. Because vascular diseases such as atherosclerosis and hypertension are partly associated with increased extracellular matrix (ECM) stiffness47,48,49,50,51, and endothelial cells respond to ECM stiffness, controlling stiffness within physiological ranges is important in in vitro models. More recent OOC approaches use physiological substrates that permit complex geometries52,53, incorporate multiple cell types to recapitulate organ function39,54,55,56,57, or immune-vascular interactions58, model patient-specific vascular structures59,60, and support preclinical drug development61,62. In many microvascular models involving interactions with other cell types, endothelial cells spontaneously form vessels with relatively uncontrolled geometries63. Conversely, OOC systems that permit defined vessel geometries under controlled flow often require substantial engineering infrastructure, materials, and expertise53,64. Robust methods accessible to nonexperts are therefore needed to facilitate studies of vascular cell behavior under physiologically relevant conditions.
Bioprinting platforms compatible with physiological ECM hydrogels provide versatile in vitro models for studying endothelial function across vascular geometries65. These approaches use either directed deposition of endothelial cell-containing gels in the shape of a blood vessel66 or sacrificial ink to generate open tubular lumens embedded in ECM that can subsequently be dissolved, leaving a lumen that can be seeded with endothelial cells54. Biologically compatible ECM substrates, including gelatin, collagen, and fibrin, can be tuned to stiffnesses that approximate those of the vascular basement membrane (1–3 kPa67) and permit vascular permeability assays similar to those used in vivo. Although these approaches do not achieve the same shape and size resolution as PDMS fabrication, curved, branched, and stenotic vessels can be generated52,66,68. Such platforms are therefore well-suited for modeling vascular geometries, including tortuous and aneurysmal vessels.
The method presented here uses a 3D printing approach based on pneumatic extrusion, three-dimensional micron-scale positioning, temperature control of the print bed and ink-containing print head, and a sacrificial ink previously developed for renal-vascular interactions on a chip67,69. Sacrificial ink is printed in the desired vascular geometry and immediately embedded in the ECM. A temperature shift subsequently removes the ink, leaving an open ECM lumen that is seeded with human endothelial cells. The base ECM consists of gelatin and fibrin, enabling rapid gelation and thrombin-mediated fibrin polymerization while providing mechanical stiffness appropriate for many vascular basement membranes. Additional ECM components, including laminin or fibronectin, can be incorporated to better mimic vascular basement membrane composition70,71,72and promote endothelial adhesion. The system is assembled in reusable Rose chambers73 containing metal supports, silicone rubber gaskets, and high-resolution microscope coverslips, permitting connection to a fluid pump through Luer-lock needles. Alternatively, the top and bottom plates can be fabricated by 3D printing using polylactic acid or carbon-fiber-reinforced material. The assembled system tolerates pressures generated by physiological fluid flow rates. A pasteurization procedure also improves the sterility of sacrificial ink without altering its physical properties. In addition, a needle-template and bioink approach permits fabrication of straight vessels containing an aneurysm without a bioprinter. The resulting endothelialized tortuous or aneurysmal vessels can be examined under physiological flow using high-resolution light microscopy for approximately one week, enabling investigation of acute endothelial responses to altered vascular geometry.
A major advantage of this system is its compatibility with light microscopy. In vitro vessels generated using this protocol are amenable to several imaging modalities and are particularly suited to spinning-disk or laser-scanning confocal fluorescence microscopy. Spatial and temporal resolution, sensitivity, and objective lens working distance must be considered when selecting imaging conditions. For most vessels generated using this system, the objective lens must have sufficient working distance to reach approximately 100–300 µm from the coverslip and image through the vessel midpoint. High-numerical-aperture objective lenses are required for high-resolution imaging of endothelial structures, including organelles and cell adhesions, and for live imaging requiring high temporal resolution, such as tracking fiducial beads under flow. Some assays that require less efficient photon capture, such as fluorescence-based endothelial barrier measurements, can be performed using lower-numerical-aperture objectives, such as 10–20× air objective lenses.
The protocol describes the generation of tortuous and aneurysmal vessels composed of human endothelial cells in an in vitro system that supports physiological fluid flow and high-resolution microscopy. The workflow includes vessel design, chamber fabrication, sacrificial ink preparation and 3D printing, ECM preparation and ink removal, endothelial cell seeding and culture under flow, vascular leak assessment, flow mapping, and immunofluorescence staining (Figure 1).
Protocol
1. Design the vessel
- Select a vessel segment that fits within the microscope-compatible chamber. For a Rose chamber, maintain no more than 1.6cm between the inlet and outlet reservoirs.
- Import the contrast CT angiography (Figure 2A), magnetic resonance angiography, or fluoroscopic angiography image into ImageJ/FIJI or another image-analysis program.
- Use the point measurement tool to define the XY coordinates along the axial center of the vessel. Export the coordinates to a spreadsheet program (Figure 2B).
NOTE: CT angiography-derived STL files can be imported directly into most printer software; however, polygon-based printing may require multiple passes and produce braided vessels (Supplemental Figure 1). Use direct G-code for single-pass printing. For this reason, the coordinate mapping and design in G-code is preferred. See example G-code in Supplemental Files. - Modify the XY coordinates in the spreadsheet to position the vessel's center at the graphical origin. Import the chamber boundary, if necessary, to confirm that the final print fits within the chamber.
- Use the vessel XY coordinates to design the vessel in the first print layer (Figure 2C). Set the first-layer height, including the vessel and contiguous inlet and outlet reservoirs, to 200µm.
- Create inlet and outlet reservoirs that permit convenient needle insertion. Use diamond-shaped reservoirs when appropriate to direct fluid efficiently toward the vessel inlet, minimizing entry turbulence (Figure 2).
- Include the reservoirs in the first layer of printing so they remain contiguous with the vessel. Add 5–9 layers above the base layer to provide sufficient volume for placing the inlet and outlet needles. For the G-code design, the following details are important:
- Set the print head and print bed, when temperature control is available, to 37°C using the printer software or appropriate G-code commands at the beginning of the print file.
- Specify the print head or extruder in the G-code when multiple print heads are available. Configure the G-code to use absolute coordinates and extrusion distances.
- Adjust the layer height based on needle size and shape, ink flow pressure, and printhead speed. Use a 200µm layer height for each reservoir layer above the first layer for the examples described here.
- Use a backpressure of 14–17psi and a print-head speed of 6mm/s (G-code: F360) for the reservoirs. Increase the print-head speed to 15mm/s (G-code: F900) for the vessel.
- Test each new vessel design on a glass slide without a chamber before printing the final vessel.
2. Prepare the sacrificial ink
- Add 2.1g of polyethylene oxide (PEO) to 60mL of cold sterile water to prepare a 3.5% w/v solution in a sterile covered container containing a sterile stir bar. Stir at 4°C for at least 48h, and periodically confirm that all powder has dissolved.
NOTE: Store the PEO solution in an airtight container at 4°C for up to 1 month. - Add 17.5g of Pluronic F-127 to 50mL of cold sterile water to prepare a 35% solution in a sterile covered container containing a sterile stir bar. Stir at 4°C for at least 48h and periodically confirm complete incorporation of the powder.
- Combine 11.4mL of cold 3.5% PEO with 28.6mL of cold 35% Pluronic F-127 in a sterile 50mL conical tube. Mix for at least 24h at 4°C on a rotary mixer.
- Place the tube upright at 4°C overnight to allow bubbles to rise out of the solution.
- Place the conical tube containing the ink in a water bath and incubate at 63°C for 3h. Leave the cap slightly open during heating to permit expanding air to escape.
- Remove the tube from the water bath and allow it to cool gradually to room temperature. Tighten the cap after the solution has cooled.
- Place the pasteurized ink on ice for 2, gently agitating occasionally without introducing bubbles.
- Remove the syringe plunger, cap the needle port, and fill the syringe to 60%–70% of its capacity. Insert the plunger, invert the syringe, remove the needle-port cap, and expel all trapped air.
NOTE: Store filled syringes at room temperature for up to 1 month.
3. Fabricate the Rose chamber and prepare the plumbing
- Fabricate the top and bottom clamp plates from aluminum or 3D-print the plates using the supplied CAD/STL files (Figure 2). Include a sufficiently large beveled bottom port for high-numerical-aperture objective lens access and a support border for screws that securely compress the coverslips against the gasket.
NOTE: Aluminum provides better heat transfer during heated-stage microscopy. 3D-printed PLA or carbon-fiber-reinforced parts are suitable for prototyping but may provide poorer heat transfer and may warp during repeated heating. - Cut the silicone sheet to match the 38mm × 51mm clamp plates. Create the central viewing window using an 18mm hole punch.
- Drill holes appropriate for the selected screw diameter. Rinse the completed gasket extensively with water to remove residual silicone debris.
- Autoclave the metal clamp plates, screws, nuts, and silicone gaskets in a closed aluminum-foil pouch using a 20min dry cycle.
- Immerse 3D-printed plates in 70% ethanol for 1min. Dry the plates in a sterile field.
- Prepare 10–30cm lengths of tubing fitted with Luer-lock connectors and inline tubing clamps, appropriate peristaltic-pump tubing, a three-way stopcock, a pulse dampener, and a two-port media reservoir (Figure 3).
- Sterilize heat-compatible tubing and reservoir components by autoclaving. Sterilize components that cannot be autoclaved using ethanol exposure.
4. Prepare the extracellular matrix reagents
- Add 12.5mL of warm PBS at 37°C to 1g of human plasma fibrinogen to prepare an 80mg/mL stock solution. Incubate at 37°C and gently agitate occasionally without vortexing.
- Allow 1–2h for the fibrinogen to dissolve, forming a hazy solution. Aliquot the solution into sterile tubes and store at −20°C for up to 3 months.
- Add 22.5g of gelatin to 135mL of sterile PBS in a sterile bottle containing a magnetic stir bar. Stir for 16h at 70°C, periodically agitating the bottle to ensure complete dissolution.
- Adjust the gelatin solution to pH 7.5 using 1M NaOH. Vacuum-filter the solution while hot, aliquot it, and store at 4°C for up to 6 months.
NOTE: Allow gelatin to bloom for at least 16h before filtration. Maintain the solution and filtration apparatus at 37°C during vacuum filtration to minimize filter clogging. - Dissolve human plasma thrombin in sterile PBS to 1,000 U/mL. Mix gently, aliquot, and store at −20 °C for up to 1 year.
- Dissolve 300mg of transglutaminase in 5 mL of PBS and incubate at 37°C for 1 h with occasional mixing. Sterile-filter the solution into a fresh tube and maintain it at room temperature.
NOTE: Prepare the transglutaminase solution fresh each day. Store powdered transglutaminase desiccated at 4°C. - Dissolve calcium chloride in water to prepare a 1M solution. Sterile-filter the solution and store at room temperature for up to 1 year.
5. Prepare and activate the coverslips
- Dip clean coverslips in ethanol, then carefully pass them over a Bunsen burner flame to evaporate the ethanol.
CAUTION: Ethanol is flammable. Keep bulk ethanol away from the open flame and perform flame sterilization using appropriate laboratory fire-safety procedures. - Place the coverslips in a stainless-steel rack without cracking or chipping the glass.
- Immerse the coverslips in 0.5% (3-aminopropyl) trimethoxysilane diluted in water for 30–60 min at room temperature. Apply gentle agitation during incubation.
CAUTION: Handle (3-aminopropyl) trimethoxysilane using appropriate chemical protective equipment and engineering controls. - Wash the coverslips through six changes of water with gentle agitation. Prevent the coverslips from becoming dislodged while transferring the rack.
- Remove the rack from the water, blot away excess water, and dry at 50°C for 30min.
- Allow the coverslips to cool to room temperature while preparing 0.5% glutaraldehyde in PBS.
CAUTION: Glutaraldehyde is toxic and irritating. Prepare and handle the solution in an appropriate chemical fume hood while wearing suitable personal protective equipment. - Incubate the coverslips in 0.5% glutaraldehyde for 60 min with gentle agitation to minimize bubble accumulation and promote uniform activation.
- Rinse the coverslips through three changes of sterile water and allow them to air-dry at room temperature.
NOTE: Store activated coverslips under vacuum desiccation for up to 2 months.
6. Coat the coverslips with the extracellular matrix base layer
- Warm 1× PBS, gelatin stock, and fibrinogen stock to 37°C for 30–60min.
- Line a sterile 15cm Petri dish with clean parafilm, spray the surface with 70% ethanol, drain the excess, and allow the surface to air-dry in a biosafety cabinet.
- Add 1.68 mL of warm PBS, 2.5mL of gelatin stock, 12.5µL of 1M CaCl₂, 625µL of fibrinogen stock, and 167µL of transglutaminase solution sequentially to a 15mL conical tube.
- Place the ECM mixture in a 37°C water bath for 30 min.
- Prepare one 1.7mL tube containing 5µL of thrombin stock for each coverslip.
- Add 400µL of the ECM preparation to the thrombin tube and mix by pipetting once while minimizing bubble formation.
- Immediately dispense 200µL of the mixture onto the sterile parafilm and place one activated coverslip onto the drop using forceps. Press gently to obtain complete coverage.
NOTE: Complete this step within approximately 20s after combining the ECM mixture with thrombin. - Cover the Petri dish and incubate the coated coverslips for 10min at room temperature, followed by 2h at 37°C in a humidified incubator.
- Gently peel each coverslip from the parafilm by bending the parafilm away from the coverslip.
- Place freshly coated coverslips gel-side up in a clean Petri dish in a humidified incubator and use within 1 day.
- Alternatively, incubate coated coverslips overnight in a non-humidified incubator and use within 2 days.
7. Bioprint the sacrificial ink and encapsulate it in ECM
- Perform test prints before printing the vessel to confirm that the ink and printing parameters produce the desired vessel dimensions. Load the print file into the printer software.
NOTE: A 32 G tapered dispensing needle with the 25% Pluronic F127/1% PEO ink reliably produces vessel diameters down to approximately 150µm under the conditions described here. Optimize print-head speed and backpressure using simple line prints on glass. - Assemble the bottom clamp plate, ECM-coated bottom coverslip, silicone gasket, top clamp plate without a top coverslip, and two screws. Place the assembly in a covered 100 mm Petri dish and maintain it at 37 °C until use on the same day.
- Attach the printing needle to the ink syringe and install the syringe in the pneumatic extrusion printer. Prewarm the print stage, print head, and an adjacent heating plate to 37 °C.
- Prepare the ECM matrix as described in Section 6 and maintain it in a 37 °C water bath. Prepare 1.5 mL of matrix per Rose chamber in 5 mL batches.
- Place 5 µL of thrombin stock into a sterile 1.7 or 2 mL tube for each chamber. Keep additional activated, uncoated coverslips available in the biosafety cabinet.
- Place the chamber containing the ECM-coated coverslip on the printer stage and center it at the XY origin. Lower the needle until it contacts the ECM or glass surface at the center of the chamber window, and define this position as the XYZ origin.
- Raise the needle and apply maximum pressure to completely fill it with ink and expel any visible bubbles. Wipe the needle tip with a sterile laboratory tissue.
- Print the vessel and reservoir geometry using the uploaded G-code file. Immediately raise the needle and remove the chamber after printing.
- Examine the printed vessel for bubbles and discontinuities. Discard and reprint any structure containing either defect.
- Place the chamber on the 37 °C heating plate, remove the screws and top clamp plate, and mix 1 mL of prepared ECM matrix with the thrombin aliquot by pipetting once.
- Transfer the activated ECM mixture into the vessel chamber without introducing bubbles and immediately place an activated coverslip face down over the ECM. Replace the top clamp plate and tighten the screws until snug without overtightening.
- Place the completed chamber in a covered 100 mm Petri dish and incubate at 37 °C for 2 h.
8. Generate an aneurysm using a wire template
- Insert 21-gauge needles through the opposite sides of the silicone gasket and align them.
- Sonicate a 0.0190-inch-diameter 304 stainless-steel medical mandrel wire in PBS containing 1% BSA in a 15 mL conical tube. Remove the wire and allow it to air-dry in a sterile Petri dish inside a biosafety cabinet.
- Pass the BSA-coated wire through both needles in the gasket (Figure 2). Bend one protruding end slightly to facilitate subsequent rotation.
- Autoclave the gasket, needle, wire, and clamp-plate assembly in a foil pouch.
- Position the needle/gasket assembly over an activated, ECM-coated coverslip.
- Attach a 21 G needle to a syringe containing pasteurized Pluronic/PEO ink.
- Dispense a small drop of sacrificial ink onto the side of the wire at the center of the chamber. Apply a small drop of ink at each needle-wire junction to create a seal.
- Prepare the ECM mixture and assemble the chamber as described in Sections 7.10–7.12.
- After the ECM has gelled, gently rotate the bent end of the wire to release it from the ECM and sacrificial ink. Slowly withdraw the wire from the device.
- Fill the inlet needle with PBS using a 200 µL pipette and allow the PBS to drain through the lumen. Repeat once and proceed to Section 9.
9. Flush the sacrificial ink from the vessel chamber
- Connect tubing to a reservoir containing cold (4 °C) PBS supplemented with antibiotics, incorporate a three-way stopcock, and terminate the tubing with a male Luer-lock fitting and sterile 23 G needle.
- Fill the supply tubing with cold PBS using the stopcock syringe until PBS exits the needle bore. Clamp the tubing.
- Fill a second length of tubing with PBS and terminate it with a 23-G needle. Clamp the tubing and remove the filling syringe.
- Insert the supply needle through the gasket into the inlet reservoir and the drainage needle into the outlet reservoir. Confirm correct placement using an inverted microscope or stereomicroscope.
- Transfer the assembly to 4 °C and position the supply reservoir 30 cm above the inlet. Position the outlet 5–10 cm below the vessel outlet needle over a waste container.
- Release the clamps and flush at least 250 mL of cold PBS through the chamber. Inspect the system for leaks and bubbles during flushing.
10. Coat and pretreat the vessel lumen with additional ECM components
- Dilute fibronectin to 20 µg/mL, laminin to 10 µg/mL, or basement membrane matrix to a 1:30 dilution in 3 mL of PBS.
- Add freshly prepared transglutaminase to the diluted ECM reagent.
- Leave the tubing immediately proximal to the vessel connected to the inlet and outlet.
- Slowly inject the ECM/transglutaminase solution through the vessel using a 1 mL syringe. Repeat until all 3 mL has passed through the vessel.
- Clamp the connectors, cap the inlet and outlet with sterile Luer caps, and incubate at 37 °C for 1 h to overnight.
- Flush the vessel with 100 mL of complete endothelial medium containing penicillin/streptomycin. Clamp the tubing connectors and cap the outlets.
NOTE: Store the medium-filled vessel at 4 °C for up to 1 week. Ensure that no bubbles remain in the lumen.
11. Cellularize the vessel
- Incubate the chamber containing the ECM vessel template at 37 °C for 2 h. Warm complete endothelial medium containing penicillin/streptomycin to 37 °C.
- Trypsinize endothelial cells from one 10-cm culture dish or one T75 flask, and neutralize the trypsin with complete medium. Transfer the suspension to a 15 mL conical tube and remove an aliquot for cell counting.
- Centrifuge the cells at 1,000 × g for 5 min. Resuspend the pellet to prepare 150 µL of cell suspension at 5 × 10⁶ cells/mL.
- Connect the outlet tubing to a sterile waste reservoir and keep the tubing clamp closed.
- Disconnect the inlet tubing and remove residual medium from the inlet needle hub. Hold the vessel vertically and pipette the cell suspension into the needle hub.
- Release the outlet clamp to allow the cell suspension to enter the vessel. Reclamp the outlet after the entire suspension enters the lumen.
- Add warm, complete medium to the inlet needle hub, then close it with a sterile Luer cap. Disconnect and cap the outlet.
- Incubate the chamber right-side up at 37 °C for 3 h.
- Repeat Sections 11.5–11.8 and incubate the chamber upside down at 37 °C for 3 h.
- Gently flush the vessel with 1 mL of complete medium and incubate at 37 °C for 3 h.
- Confirm endothelial attachment by microscopy, gently rinse away remaining unattached cells with fresh medium, and incubate at 37 °C for 12–24 h.
12. Culture the vessel under flow
- Warm 200 mL of complete medium for 1 h and degas it under vacuum using a sterile filter unit. Rewarm the medium in a humidified CO₂ incubator.
- In a sterile biosafety cabinet, connect the media reservoir outlet and three-way stopcock, pump tubing, pulse dampener, optional bubble trap, inlet tubing, vessel chamber, outlet tubing, and return tubing to the media reservoir in sequence (Figure 3).
- Prime the entire flow circuit with medium and confirm that no bubbles or air pockets remain.
NOTE: Fill the connector and needle hubs with liquid before reconnection. Air bubbles entering a cellularized vessel can cause endothelial cell loss because of abrupt shear forces. - Transfer the assembly to a 37 °C incubator and initiate a flow rate of 1 dyn/cm2 in the vessel. Maintain this flow for 12 h.
- Increase the flow to produce 12–16 dyn/cm2 and maintain it for 18–24 h before performing downstream assays. To calculate the flow rate required for your vessel, determine the printed vessel length and mean diameter. Using an online calculator, use the determined parameters and input a circular cross-section, media with 10% serum, and negligible tubing resistance (the tubing is a much larger diameter than the printed vessel).
NOTE: Use the vessel as soon as possible after flow conditioning. Culture beyond 1 week may result in gaps between endothelial cells, potentially associated with cell loss or ECM modification by endothelial proteases.
13. Perform the vascular leak assay
- Add Alexa 647-labeled BSA or 10 kDa Alexa 647 dextran to 35 mL of complete medium to obtain a final concentration of 5 mg/mL. Warm the solution to 37 °C.
- Preincubate the vessel with the test agent, such as 250 ng/mL TNFα, for 1–2 h and include the same agent in the assay medium.
- Establish a 37 °C water bath and position the pump near the microscope. Start the microscope, acquisition software, and stage-heating system, and equilibrate the stage to 37 °C for 30 min before imaging.
- Stop flow in the incubator, disconnect the culture-medium reservoir, and transfer the chamber and associated tubing to the prewarmed microscope stage.
- Connect the pump to approximately 20 cm of tubing fitted with a glass micropipette containing unlabeled medium. Insert the micropipette tubing into the fluorescent reporter medium and place the outlet tubing in a collection vessel.
- Set the pump to deliver a flow rate corresponding to 0.2 mL/min, and do not initiate flow until imaging is ready.
- Focus on the vessel midline using phase-contrast imaging and switch to the 647 fluorescence channel. Initiate flow at the rate established in Section 13.6 and acquire images every 1–5 min according to the expected response time.
- Generate kymographs from the acquired images and fit a linear slope to thresholded intensity values. Report leakage as the distance in µm traveled by the reporter from the outer vessel surface per min.
14. Map fluid flow
- Vortex the 10 µm fluorescent beads for 1 min, then sonicate them in a bath sonicator for 1 min. Dilute the beads to 1.8 × 10⁵beads/mL in 10 mL of complete medium.
- Configure the flow system on the microscope stage as described in Section 13 for the vascular leak assay. Include an outflow collection vessel and set the flow rate to 0.2 mL/min.
- Focus on the central plane of the vessel using an objective with an appropriate working distance. Acquire images at the maximum practical frequency permitted by exposure time, detector sensitivity, excitation intensity, and light-collection efficiency.
- Analyze the time-lapse image sequence using particle image velocimetry software.
15. Fix and immunostain the endothelialized vessel
- Prepare 40 mL of 4% paraformaldehyde in PBS containing 10 mM CaCl₂ and 10 mM MgCl₂.
CAUTION: Paraformaldehyde is toxic. Prepare and handle paraformaldehyde-containing solutions in an appropriate chemical fume hood while wearing suitable personal protective equipment. - Stop the flow, clamp the inlet tubing, disconnect it from the pump, and connect it to the draw tube used for the vascular leak assay. Insert the draw tube into the fixative and allow 35 mL to pass through the vessel by gravity.
- Clamp the tubing and incubate the vessel in fixative at room temperature for 30 min.
- Flush the vessel by gravity with 25 mL of permeabilization buffer containing 0.4% Triton, 20 mM PIPES at pH 6.1, 138 mM NaCl, 5 mM KCl, 2 mM MgCl₂, 2 mM EGTA, and 5.5 mM glucose. Clamp the tubing and incubate for 10 min at room temperature.
- Flush the vessel with blocking buffer containing 1% BSA, 0.05% Tween 20, 20 mM Tris at pH 7.4, 140 mM NaCl, and 5 mM KCl. Incubate for 2 h at room temperature or overnight at 4 °C.
- Dilute the selected primary antibody 1:50–1:500 in 100–500 µL of blocking buffer. Remove the inlet tubing and introduce the antibody solution using the procedure described in Section 11 for cell seeding.
- Incubate the vessel overnight at 4 °C.
- Reconnect the inlet tubing and flush the vessel with 20 mL of PBS.
- Dilute the appropriate secondary antibodies 1:200–1:1,000 in blocking buffer and, when required, add fluorescent phalloidin at 1:250. Introduce the solution using the procedure described in Section 15.6 and incubate for 2 h at room temperature.
- Flush the vessel with 40 mL of PBS, close the tubing clamps, and cap the tubing.
NOTE: Store the stained vessel at 4 °C and image within 2 weeks. - Stain F-actin with fluorescent phalloidin, the Golgi apparatus with anti-GM130, and nuclei with DAPI.
- Analyze phalloidin images using FibrilTool74 to determine the average orientation of F-actin stress fibers.
- Determine the axis between the centers of mass of each nucleus and the Golgi apparatus. Analyze and plot the resulting orientations in numerical computing software as previously described75.
Results
The use of sacrificial ink to print various tubular tissues has been well established by several groups, notably the Lewis laboratory, which has fabricated kidney tubules along with blood vessels67,76. Similar approaches have been used to print alveolar structures77 and vascularized tumors78. Here, these approaches were adapted to generate vascular geometries for investigating endothelial responses under physiological fluid flow (Figure 2). Vessel geometries were converted from a vascular image into a coordinate map and subsequently into G-code to define the printing path (Figure 2A–C). The resulting approach enabled the fabrication of vessel templates for studying how endothelial function and cytoskeletal organization are altered by tortuous vessels and aneurysms (Figure 2D–G). A 3D-printable Rose chamber design was also incorporated to eliminate the need for access to machinist services (Figure 2H). An example G-code file for vessel printing is provided in Supplementary File 1, and the corresponding Rose chamber and stage-mount CAD files are provided in Supplementary File 2 and Supplementary File 3, respectively. STL-based printing can require multiple print-head passes, resulting in braided vessel geometries with separated lumens (Supplemental Figure 1). The resulting platform was designed to be accessible to vascular cell biologists with minimal bioengineering expertise while supporting physiological pressure and flow rates and providing access to high-resolution microscopy (Figure 2I).
Following vessel fabrication and cellularization, the vessel device was incorporated into a closed-loop perfusion system to enable controlled media circulation (Figure 3). The system consisted of a peristaltic pump, a three-way stopcock connected to a priming syringe, a bubble trap, a pulse dampener, the vessel device, and a media reservoir arranged sequentially within the flow circuit (Figure 3A). This configuration allowed media to circulate continuously through the engineered vessel while incorporating components for system priming, bubble removal, and dampening of pulsations generated by the peristaltic pump. The assembled system could be operated with the vessel device positioned within the experimental setup, as shown in Figure 3B, providing a practical configuration for subsequent perfusion of cellularized vessels under controlled flow conditions.
One modification to the previously described sacrificial ink approaches was pasteurization of the ink before printing. This modification was necessary because applying published ink-preparation protocols resulted in mold-contaminated cultures. As with other Pluronic-based inks used for this application, the 25% Pluronic F127/1% PEO ink remains liquid at low temperatures and transitions to a packed micellar gel as the temperature increases. This formulation has a transition temperature of 15°C, which is convenient for templating structures at incubator temperatures and removing the ink at 4°C. Similar to pure Pluronic, this material also displays substantial shear thinning at the printing temperature (Figure 4A). However, even at low temperatures, the ink is too viscous for filter sterilization using standard tissue-culture filters and vacuum. Although the ink can be sterilized by pasteurization at 70°C or higher for 20s, these temperatures irreversibly alter the ink and reduce its viscosity at the printing temperature (data not shown). Lower-temperature, longer-duration pasteurization at 63°C for >1 h reduces contamination by fungi and other microorganisms without altering the ink's complex viscosity at printing-suitable temperatures. Rheological characterization using a rheometer equipped with a 25 mm cone-and-plate geometry showed that raw and pasteurized ink had similar viscosities across a range of deformation speeds at printing temperatures (Figure 4B), demonstrating that pasteurization does not compromise printability. Pasteurized ink also enables longer-term vessel culture without the need for antimycotic drugs, which can alter endothelial function.
Once the vessel is cellularized, confluent endothelial cells should coat the entire vessel, as shown in Figure 5, with the maximum-intensity projection in Figure 5A and the cross-section in Figure 5B. Media flow can then be increased to physiological shear rates, which can be estimated for approximately circular vessels using the Hagen-Poiseuille equation79. In practice, the flow rate required to achieve a desired shear stress can be estimated by accounting for medium viscosity and microfluidic resistance. In a typical 2D culture in vitro, media flow at 12 dyn/cm2induces most endothelial cell types to orient along the flow axis. This response can be visualized by fluorescent phalloidin staining of F-actin (Figure 5D,E) or by analysis of the Golgi-nuclear axis (Figure 5D,F), both of which show anisotropic orientation consistent with endothelial polarization, as previously described18. Although shear stresses exceeding 40 dyn/cm2 occur in vivo, such conditions were not modeled here.
A major consequence of altered vessel geometry is altered fluid flow, to which endothelial cells respond through several signaling pathways80,81. Several methods are available to monitor blood-flow velocity, including 4D Doppler ultrasound82, 4D flow magnetic resonance imaging83, and laser speckle imaging84. Although these techniques offer important in vivo advantages, resolving local flow differences across a single vessel can be challenging. The high numerical aperture imaging capability of this platform enables direct fluorescent particle tracking (Figure 6B) and high-spatial-resolution mapping of flow anomalies induced by vessel curvature using particle image velocimetry (Figure 6C). For example, slower flow is observed along the inner curvature of the vessel than along the outer curvature (Figure 6C), which may contribute to altered endothelial responses85.
Once a confluent vessel is established, patency and barrier function can be assessed by perfusing fluorescently labeled macromolecules, such as dextrans or proteins, through the lumen. Patent vessels lined with HUVECs resist the passage of fluorescently labeled dextrans (Figure 6D,F). In contrast, exposure to barrier-disrupting stimuli such as TNFα increases vessel leakage (Figure 6H, J). Local leakage rates can be visualized using kymograph analysis (Figure 6E,G,I,K). Because the kymograph represents distance on the X-axis and time on the Y-axis, relative leakage rates can be compared by quantifying the slopes of lines fitted to segmented fluorescence intensities (Figure 6E,G,I,K). These analyses enable evaluation of how local vessel geometry influences endothelial barrier function in response to defined stimuli.
A key advantage of this platform is improved microscopic access relative to what is possible in vivo. The system also facilitates immunohistochemical analysis of endothelial molecular organization, particularly the actin cytoskeleton. Endothelial cells are very thin and are surrounded by smooth muscle cells in vivo, which can complicate the localization of cytoskeletal structures specifically within the endothelium. This platform enables straightforward staining and imaging of adhesion molecules and filamentous actin in endothelial cells (Figure 5) and supports multicomponent analyses that are difficult in vivo, including assessment of endothelial polarization and division under physiological flow (Figure 5D–F). Combining these assays on a single platform enables direct examination of relationships among vessel geometry, altered flow, barrier function, endothelial molecular organization, and intercellular adhesion.
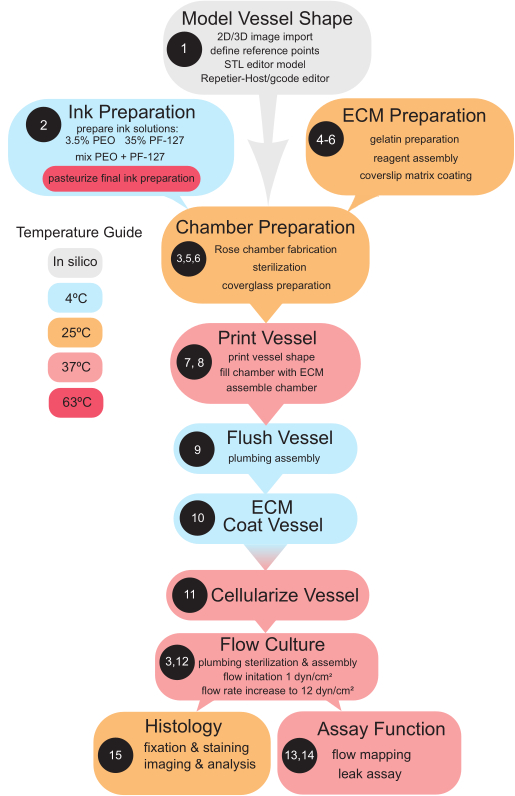
Figure 1: Workflow for printing and using 3D blood vessels on a chip. Flowchart of the protocols for generating and using 3D blood vessels on a chip. Black circles indicate the corresponding protocol numbers. Box colors indicate the temperature at which each protocol is performed or the sample is incubated. The workflow includes vessel-shape modeling, ink preparation, extracellular matrix (ECM) preparation, chamber preparation, vessel printing, vessel flushing and coating, cellularization, flow culture, functional assays, and histological analysis. Please click here to view a larger version of this figure.
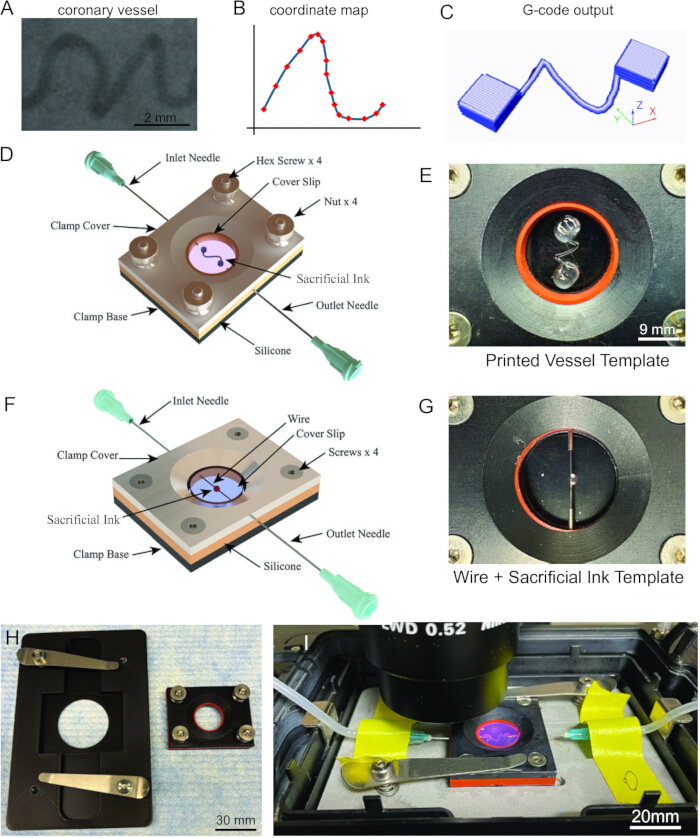
Figure 2: Vessel printing and chamber design. Vessels can be designed from in vivo vascular images to reproduce patient-specific vascular geometries. (A) Small coronary vessel imaged by contrast-enhanced computed tomography (CT), reproduced with permission from Parekh et al.86 Scale bar = 2 mm. (B) Coordinate map of fiducial points from a portion of the vessel shown in panel A, generated by point recording in FIJI. (C) G-code output generated from the coordinate map using printer-control software. X-, Y-, and Z-coordinates are indicated in the lower right. (D) Schematic of a Rose chamber containing a bioprinted vessel. The design with top thumb nuts is compatible with the 3D-printed polylactic acid (PLA) chamber. (E) Rose chamber containing a vessel and reservoirs printed with sacrificial bioink on an ECM-coated coverslip. Scale bar = 9 mm. (F) Schematic of a Rose chamber configured for the aneurysm model. A wire threaded through the inlet and outlet needles serves as the vessel template, and sacrificial bioink deposited on the wire serves as the aneurysm template. (G) Rose chamber containing the wire and sacrificial bioink template on an ECM-coated coverslip. (H) 3D-printed PLA microscope stage adapter (left) and Rose chamber (right), providing alternatives to machined aluminum components. Metal clamps on the stage adapter are secured to the adapter plate. Scale bar = 30 mm. (I) Printed and flushed vessel in an aluminum Rose chamber mounted on a microscope stage with inlet and outlet needles and tubing attached. Scale bar = 20 mm. Abbreviations: CT = computed tomography; ECM = extracellular matrix; PLA = polylactic acid. Please click here to view a larger version of this figure.
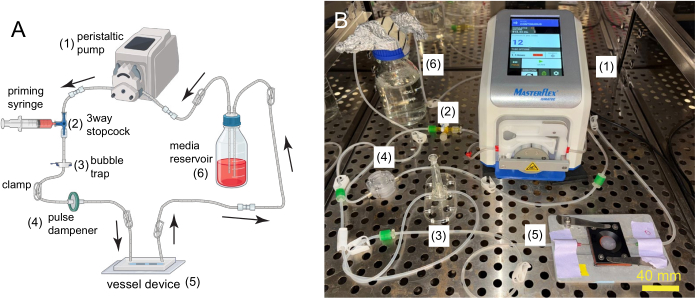
Figure 3: Fluid-flow system for a cellularized vessel in a Rose chamber. (A) Schematic of the tubing configuration used to establish fluid flow through a Rose chamber containing a cellularized vessel. Arrows indicate the direction of flow. Numbered components are (1) peristaltic pump, (2) three-way stopcock with priming syringe, (3) bubble trap, (4) pulse dampener, (5) vessel device, and (6) medium reservoir. All components that contact the culture medium are sterilized before use. (B) Fluid-flow system containing a cellularized vessel in a Rose chamber inside a tissue culture incubator. Numbers correspond to the components shown in panel A. Inlet and outlet needles are secured with tape for stability. Scale bar = 40 mm. Please click here to view a larger version of this figure.
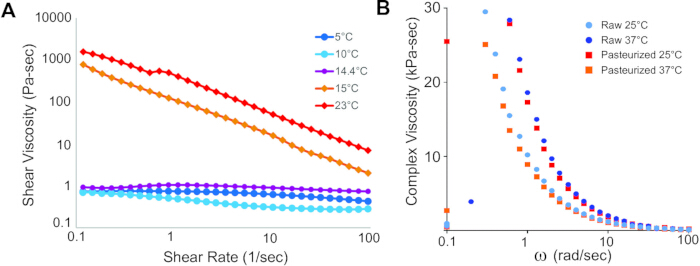
Figure 4: Rheological characterization of the sacrificial bioink. (A) Shear viscosity of unpasteurized 25% Pluronic F127/1% polyethylene oxide (PEO) ink as a function of shear rate at 5 °C, 10 °C, 14.4 °C, 15 °C, and 23 °C. (B) Complex viscosity as a function of angular frequency for unpasteurized and pasteurized Pluronic F127/PEO ink at 25 °C and 37 °C. Abbreviation: PEO = polyethylene oxide. Please click here to view a larger version of this figure.
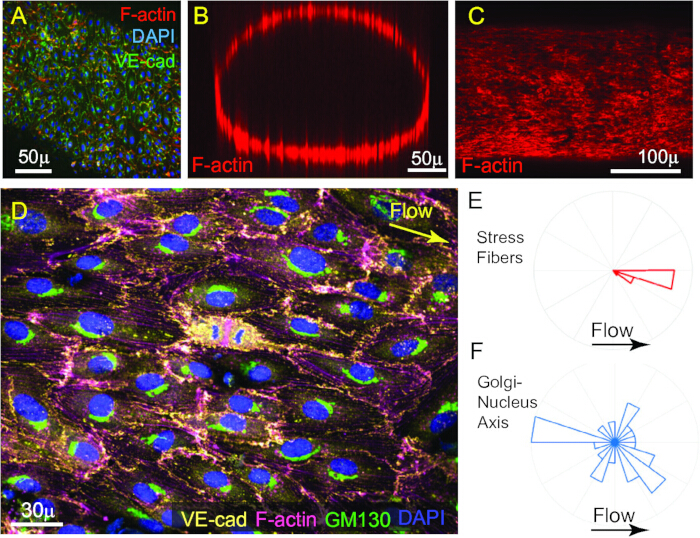
Figure 5: Imaging and quantitative analysis of fixed and stained endothelialized vessels. (A) Maximum-intensity projection of spinning-disk confocal fluorescence images of a fully cellularized vessel after initial seeding and culture under low shear stress (1 dyn/cm2). The vessel was stained for VE-cadherin (green), F-actin (red), and DNA with DAPI (blue). Scale bar = 50 µm. (B) Reconstructed xz cross-section of a z-stack of spinning-disk confocal fluorescence images of a fully cellularized vessel stained with fluorescent phalloidin to label F-actin (red). Scale bar = 50 µm. (C) Maximum-intensity projection of a z-stack of spinning-disk confocal fluorescence images of a fully cellularized vessel after 24 h of flow at 12 dyn/cm2. F-actin was labeled with fluorescent phalloidin (red). Scale bar = 100 µm. (D) Spinning-disk confocal fluorescence image of a vessel region after 24 h of culture under a shear stress of 16 dyn/cm2. The vessel was stained for VE-cadherin (yellow), F-actin (magenta), the Golgi marker GM130 (green), and DNA with DAPI (blue). The arrow indicates the direction of flow. Scale bar = 30 µm. (E) Representative quantification of mean stress-fiber orientation from the F-actin channel in panel D using FibrilTool74. A grid of 45 regions, each with an area of 1,600 µm2, was analyzed, and mean fiber orientations are displayed as a radial histogram relative to the direction of flow. (F) Representative quantification of the nucleus-Golgi axis from panel D as a measure of endothelial cell polarization. Vectors from the center of each nucleus to the center of the corresponding Golgi apparatus are plotted as a radial histogram relative to the direction of flow; n = 75 vectors. Abbreviation: DAPI = 4′,6-diamidino-2-phenylindole. Please click here to view a larger version of this figure.
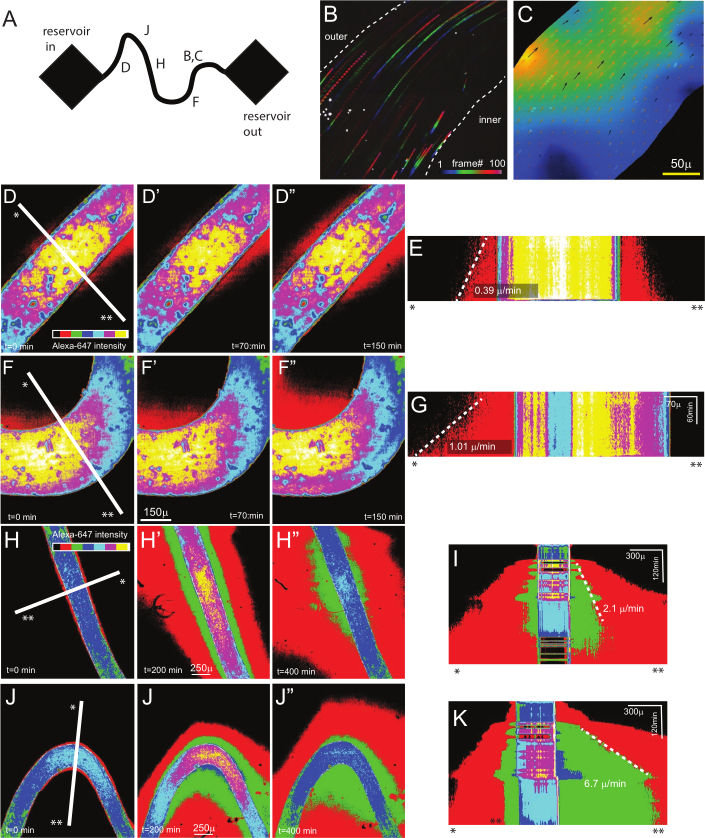
Figure 6: Analysis of fluid flow and vascular leakage. (A) Schematic of the vessel geometry used for the analyses in panels B–K. Letters indicate the approximate vessel regions corresponding to the respective panels. (B) Color-encoded temporal projection of a time-lapse spinning-disk confocal fluorescence image sequence showing fluorescent beads moving under flow through a curved vessel region. Color indicates frame number from 1 to 100; the outer and inner curvatures are indicated. (C) Particle image velocimetry (PIV) analysis showing relative flow velocity across the curved vessel region. Colors represent relative velocity, and arrows indicate flow direction and magnitude. Scale bar = 50 µm. (D–G) Representative vascular barrier assay of an untreated vessel perfused with Alexa 647-labeled 10 kDa dextran. (D,D′,D″) Images of a straight vessel region acquired at 0, 70, and 150 min, respectively. The white line indicates the region used for the kymograph in panel E. (E) Kymograph of the straight region in panel D showing a leakage rate of 0.39 µm/min, which is the slope of the dashed line. (F,F′,F″) Images of the curved vessel region acquired at 0, 70, and 150 min. The white line indicates the region used for the kymograph in panel G. Scale bar = 150 µm. (G) Kymograph of the curved region in panel F showing a leakage rate of 1.01 µm/min, which is the slope of the dashed line. (H–K) Representative vascular barrier assay after preincubation with 250 ng/mL of tumor necrosis factor alpha (TNFα). (H,H′,H″) Images of a straight vessel region acquired at 0, 200, and 400 min, respectively. The white line indicates the region used for the kymograph in panel I. Scale bar = 250 µm. (I) Kymograph analysis of the straight vessel region in panel H shows a leakage rate of 2.1 µm/min, which is the slope of the dashed line. (J,J′,J″) Images of the curved vessel region acquired at 0, 200, and 400 min. The white line indicates the region used for the kymograph in panel K. Scale bar = 250 µm. (K) Kymograph analysis of the curved vessel region in panel J shows a leakage rate of 6.7 µm/min, which is the slope of the dashed line. Asterisks in panels D–K identify the corresponding ends of the lines used to generate the kymographs. Abbreviations: PIV = particle image velocimetry; TNFα = tumor necrosis factor alpha. Please click here to view a larger version of this figure.
Supplemental Figure 1: Vessel printing using STL-based printer programming. (A) Differential interference contrast image of a printed vessel generated using STL-based printer programming, which directs the printer head to make two passes, producing a braided vessel structure. Scale bar = 250 µm. (B) 3D rendering of the flushed braided vessel filled with Alexa 647-labeled bovine serum albumin (BSA). A gap is visible between the lumens of the two braided strands. Scale bar = 100 µm. Abbreviations: BSA = bovine serum albumin; STL = standard tessellation language. Please click here to download this file.
Supplementary File 1: G-code for vessel printing. Please click here to download this file.
Supplementary File 2: CAD drawing of the Rose chamber. Please click here to download this file.
Supplementary File 3: CAD drawing of the stage-mount adapter. Please click here to download this file.
Discussion
A robust system is described for modeling vascular geometries associated with disturbed flow, including tortuous vessels, aneurysms, and branch points. The method supports high-resolution imaging, flow mapping, and assessment of vascular barrier function within a platform accessible to cell biologists with limited bioengineering experience. Although the primary approach requires a bioprinter, commercially available extrusion-based printers range from open-source systems to more advanced platforms with multiple print heads. Key printer capabilities include control of the print head and ink temperature, precise pressure regulation, and print-bed temperature. In addition to bioprinted tortuous and branched vessels, the method also includes an aneurysm model that can be generated without a bioprinter. Together, these approaches facilitate the investigation of endothelial cell function in tortuous vessels using microscopy methods commonly available in cell biology laboratories.
Numerous in vitro model systems are available for studying vascular function87,88, each with distinct strengths and limitations. The system described here, adapted from previous work54,67,69, is particularly well-suited to investigating the effects of vascular tortuosity on endothelial function because it permits direct modeling of patient-derived vessel geometries and systematic variation of vascular curvature within a single device. Other approaches have modeled patient coronary vessels using photopolymerizable gelatin methacrylate to generate scaled-down vessel structures under physiological flow60. Such systems offer accurate vessel modeling, flow analysis, and the potential incorporation of tunica media layers. However, their overall size and glass support requirements can limit high-resolution imaging and localized leak assays. Conversely, smaller systems based on the self-assembly of iPSC-derived endothelial cells enable high-resolution imaging and can incorporate both endothelial and vascular smooth muscle cells89. These models, however, provide less control over vessel geometry, and establishing high flow and shear rates can be challenging. The present system, therefore, represents a practical intermediate approach that combines defined vessel geometry with high-resolution imaging of vascular tortuosity.
A major advantage of this platform is the ability to generate vessels containing both curved and straight regions, enabling direct comparison of local vessel geometry within the same sample while other experimental variables remain constant, as shown in Figure 6. Another advantage is the ability to use patient-derived vessel images obtained via angiography or contrast-enhanced CT. The primary limitation for reproducing patient vessels is size. Vessels smaller than 150µm in diameter are difficult to print reproducibly, whereas vessel segments extending beyond several centimeters require larger mounting chambers. Vessel segments should also remain relatively flat in the third dimension so that they can be printed onto the base matrix layer and maintained within the working distance of the objective lens during microscopic imaging.
In future work, the system described here could be further modified to model diseases such as atherosclerosis, in which vessel geometry may contribute to pathophysiology. Genetically modified endothelial cells or additional cell types, including smooth muscle cells and immune cells, could be incorporated to increase physiological complexity. Incorporating smooth muscle cells beneath the endothelial layer, as demonstrated in simpler systems, could provide additional insight into smooth muscle-endothelial interactions in vascular tortuosity and disease90. Additional modifications could include tumor cells to investigate intravasation68,91, and the influence of tortuosity on this process. The platform could also be used to examine how disturbed flow alters inflammatory responses92,93and potentially contributes to vascular complications associated with infections such as COVID-1994. Given the broad involvement of the vasculature in human health and disease, accessible systems such as this may facilitate further investigation of endothelial function across diverse disease contexts.
Disclosures
The content is solely the responsibility of the authors and does not necessarily represent the official views of the National Institutes of Health. The authors declare no competing financial interests.
Acknowledgements
The authors wish to thank members of the Jennifer Lewis lab at Harvard University for their advice in some early exploration of this work, and members of the Waterman Lab for feedback and advice.
Materials
| Name | Company | Catalog Number | Comments |
|---|---|---|---|
| (3-Aminopropyl)trimethoxysilane (APTMS), 97% | Sigma-Aldrich | 281778 | Used for silanization and activation of glass coverslips before ECM attachment. |
| 1mL sterile syringe | Fisher Scientific | 14-823-434 | Used for reagent delivery, vessel coating, and fluid handling. |
| 1xPhosphate-buffered saline (PBS) | Thermo Fisher Scientific | J61196.AP | Used for reagent preparation, washing, and vessel flushing. |
| 10mL sterile syringe | Fisher Scientific | 14-955-459 | Used for reagent preparation and fluid transfer. |
| 15mL conical tubes with cap | Fisher Scientific | 05-538-59A | Used for reagent preparation, cell handling, and solution storage. |
| 150mm polystyrene Petri dish | Fisher Scientific | FB0875714 | Used as a sterile working or incubation container. |
| 21G needle | Fisher Scientific | 14-817-227 | Used for vessel-template preparation and chamber access. |
| 23G needle | Fisher Scientific | 14-817-237 | Used for vessel inlet and outlet connections during flushing and perfusion. |
| 27G clear tapered dispensing needle | Nordson | 7018417 | Used for sacrificial ink extrusion and visualization of air bubbles during printing. |
| 3mL sterile syringe | Fisher Scientific | 14-955-459 | Used for fluid transfer and reagent delivery. Confirm catalog number because the supplied number is also listed for the 10 mL syringe. |
| 304 stainless-steel medical mandrel wire, 0.0190 in diameter | Component Supply | GWX-0190-36 | Used as the removable template for the straight lumen in the wire-based aneurysm model. |
| 50mL conical tubes with cap | Fisher Scientific | 05-526B | Used for preparation, mixing, pasteurization, and storage of reagents. |
| Alexa 488 anti-mouse secondary antibody | Thermo Fisher Scientific | A32723TR | Fluorescent secondary antibody used for immunostaining. |
| Alexa 555 anti-rabbit secondary antibody | Thermo Fisher Scientific | A-21428 | Fluorescent secondary antibody used for immunostaining. |
| Alexa 647-labeled bovine serum albumin | Thermo Fisher Scientific | A34785 | Fluorescent macromolecular tracer used for vascular barrier/leakage assays. |
| Alexa 647-labeled dextran, 10 kDa | Thermo Fisher Scientific | D22914 | Fluorescent tracer used to assess endothelial barrier function and vascular leakage. |
| Alexa 647-phalloidin | Thermo Fisher Scientific | A22287 | Used to fluorescently label F-actin for cytoskeletal imaging and orientation analysis. |
| Albumin, bovine serum, Fraction V, fatty acid-free | Sigma-Aldrich | 126575-10GM | Used for blocking and preparation of protein-containing solutions. |
| Antibiotic-Antimycotic, 100x | Thermo Fisher Scientific | 15240062 | Optional antimicrobial supplement for ECM and culture medium. |
| Anti-GM130 antibody, clone 4A3 | Sigma-Aldrich | MABT1363 | Primary antibody used to label the Golgi apparatus for endothelial polarity analysis. |
| Anti-VE-cadherin rabbit monoclonal antibody, D87F2 | Abcam | 65707 | Primary antibody used to visualize endothelial cell-cell junctions. |
| Calcium chloride | Sigma-Aldrich | C7902 | Used in ECM preparation and fixation buffers. Verify whether the intended reagent is anhydrous or hydrated calcium chloride. |
| Connector kit | World Precision Instruments | 504954 | Luer-to-tubing connectors used to assemble the microfluidic perfusion circuit. |
| Coverglass staining rack | Electron Microscopy Sciences | 72240 | Used to hold coverslips during cleaning, silanization, activation, and washing. |
| D-(+)-Glucose | Sigma-Aldrich | G7021-100G | Component of the permeabilization buffer used during immunostaining. |
| DAPI | Thermo Fisher Scientific | 62248 | Fluorescent nuclear stain used for cell imaging and polarity analysis. |
| Digital hot plate | Fisher Scientific | 11-475-028 | Used to maintain the vessel chamber and reagents at approximately 37 °C during assembly. |
| EGTA tetrasodium salt | Sigma-Aldrich | E8145-10G | Chelating agent used in the permeabilization buffer. |
| Female barbed Luer connector for 1/16 in ID tubing | Scientific Commodities Inc. | BB330A | Used to connect tubing within the microfluidic circuit. |
| Female Luer with 1/16 in ID barb, CrystalVu QC | Fisher Scientific | 01-000-123 | Used for tubing and vessel-chamber connections. |
| Fibrinogen | Sigma-Aldrich | F8630 | ECM component used with gelatin and thrombin to form the vessel-supporting hydrogel. Verify source: manuscript describes human plasma fibrinogen, whereas the supplied table states bovine plasma. |
| Fluid pulse damper | Darwin Microfluidics | SE-D1606-3NB-PC-31 | Used to reduce pulsatile fluctuations generated by the peristaltic pump. |
| Food-industry high-temperature silicone rubber strip | McMaster-Carr | 8417K51 | Used to fabricate the gasket for the Rose chamber. |
| Gelatin from porcine skin, gel strength 300, Type A | Sigma-Aldrich | G2500 | Major ECM component used to form the hydrogel surrounding the vessel lumen. |
| Glass coverslip, No. 1.5 | VWR | EN-MAS-25X25-1-5-CS | High-resolution microscopy substrate and chamber surface. |
| Glutaraldehyde, 25% | Electron Microscopy Sciences | 16220 | Diluted for coverslip activation before ECM attachment. |
| Growth Kit-BBE | ATCC | PCS-100-040 | Supplement kit used with vascular cell basal medium for endothelial cell culture. |
| Growth Kit-VEGF | ATCC | PCS-100-041 | Endothelial growth supplement used with vascular cell basal medium when required. |
| Human plasma fibronectin | Sigma-Aldrich | FC010 | Optional luminal ECM coating used to promote endothelial attachment. |
| Inline tubing clamp | Sigma-Aldrich | Z503371-1PAK | Used to stop and regulate flow through tubing during chamber manipulation and incubation. |
| Ismatec Reglo Digital peristaltic pump | Masterflex | 78018-12 | Used to generate controlled fluid flow through cellularized vessels. |
| Laminin | Sigma-Aldrich | L2020-1MG | Optional luminal ECM coating for modification of endothelial adhesion and polarization. |
| Luer-to-tubing coupler assortment kit | World Precision Instruments | 504954 | Used to connect tubing, syringes, and chamber inlet/outlet components. Duplicate of connector-kit catalog number; retain one entry if identical. |
| Magnesium chloride hexahydrate | Sigma-Aldrich | M2393-100G | Component of fixation and permeabilization buffers. |
| Male barbed slip Luer connector for 1/16 in ID tubing | Scientific Commodities Inc. | BB329A | Used for microfluidic tubing connections. |
| Male Luer fitting, 1/16 in ID | World Precision Instruments | 13160-100 | Used to connect tubing to syringes and chamber components. |
| Matrigel | Sigma-Aldrich | CLS356234-1EA | Optional luminal ECM coating used for endothelial attachment. |
| Media bottle caps | Fisher Scientific | 05-719-310 | Two-port caps used to construct sterile culture-medium reservoirs for the flow circuit. |
| Nalgene Pharma-Grade silicone tubing, 1/16 in ID | Thermo Fisher Scientific | 8600-0020 | Flexible tubing used in the microfluidic perfusion and flushing circuits. |
| Parafilm | Electron Microscopy Sciences | 70990-125 | Used as a nonadherent surface during polymerization of ECM coatings on coverslips. |
| PBS, 10x, pH 7.4 | Thermo Fisher Scientific | 70011044 | Concentrated buffer used to prepare working PBS solutions. |
| Penicillin/Streptomycin | Thermo Fisher Scientific | 15140122 | Antibiotic supplement used in endothelial culture medium and flushing solutions. |
| PIPES | Sigma-Aldrich | P1851-25G | Buffering component of the permeabilization solution. |
| Pluronic F-127 | Sigma-Aldrich | P2443 | Thermoresponsive component of the sacrificial printing ink. |
| Polycarbonate three-way stopcock with male Luer | Fisher Scientific | NC9593742 | Used for priming, switching, and controlling fluid paths in the perfusion circuit. |
| Polyethylene oxide (PEO) | Sigma-Aldrich | 372781 | Polymer component of the sacrificial ink formulation. |
| Rotary mixer | Fisher Scientific | 88861050 | Used to mix PEO/Pluronic sacrificial ink at 4 °C. |
| Slide-unit staining dish | MSE Supplies | DWK90020 | Used for coverslip washing, staining, or reagent incubation. |
| Square cover glass, No. 2, 25mm x 25mm | Sigma-Aldrich | CLS285525-1000EA | Chamber coverslip; thicker No. 2 glass provides increased resistance to breakage and is compatible with suitable air or water objectives. |
| Stainless-steel blunt dispensing needle, 21 G, 1 in | Component Supply | NE-212PL | Used for fluid delivery or construction of the wire-template vessel model. |
| Steriflip vacuum filter units | MilliporeSigma | SE1M179M6 | Used to sterile-filter warm gelatin and other compatible solutions. |
| Sterile plastic 5mL syringes | Allevi | PSYR5-S | Used to load sacrificial ink for pneumatic extrusion printing. |
| Thrombin, human plasma, high activity | Sigma-Aldrich | 605195 | Used to initiate fibrin polymerization during ECM gel formation. |
| Transglutaminase | Moo Gloo | 1201 | Crosslinking enzyme used during preparation and modification of the gelatin/fibrin ECM. |
| Triton X-100 | Sigma-Aldrich | 648466 | Detergent used for endothelial cell permeabilization before immunostaining. |
| TrypLE Express Enzyme, 1x, phenol red | Thermo Fisher Scientific | 12605010 | Cell-dissociation reagent used to harvest endothelial cells before vessel seeding. |
| Tween 20 | Sigma-Aldrich | 11332465001 | Detergent component of the immunostaining blocking buffer. |
| Vascular Cell Basal Medium | ATCC | PCS-100-030 | Basal medium used for endothelial cell culture and perfusion experiments. |
References
- Franken R, et al. Increased aortic tortuosity indicates a more severe aortic phenotype in adults with Marfan syndrome. Int J Cardiol. 2015;194:7-12.
- Morris SA, et al. Vertebral artery tortuosity in Turner syndrome: is tortuosity a component of the aortopathy phenotype J Cardiovasc Magn Reson. 2014;16(Suppl 1):P115.
- Morris SA. Arterial tortuosity in genetic arteriopathies. Curr Opin Cardiol. 2015;30(6):587-593.
- Ciurică S, et al. Arterial tortuosity. Hypertension. 2019;73(5):951-960.
- Penta R, Ambrosi D. The role of the microvascular tortuosity in tumor transport phenomena. J Theor Biol. 2015;364:80-97.
- Bullitt E, et al. Abnormal vessel tortuosity as a marker of treatment response of malignant gliomas: preliminary report. Technol Cancer Res Treat. 2004;3(6):577-584.
- Fattahi M, et al. Influence of parent vessel feature on the risk of internal carotid artery aneurysm rupture via computational method. Sci Rep. 2023;13(1):1-12.
- Kawsara A, et al. Management of coronary artery aneurysms. JACC Cardiovasc Interv. 2018;11(13):1211-1223.
- Sokhal BS, Ma Y, Rajagopalan S. Femoral artery aneurysms. Br J Hosp Med. 2022;83(12).
- Golledge J. Abdominal aortic aneurysm: update on pathogenesis and medical treatments. Nat Rev Cardiol. 2019;16(4):225-242.
- Toader C, et al. Cerebral aneurysm: filling the gap between pathophysiology and nanocarriers. Int J Mol Sci. 2024;25(22):11874.
- Wei F, et al. Arterial tortuosity: an imaging biomarker of childhood stroke pathogenesis Stroke. 2016;47(5):1265-1270.
- Moceri P, et al. Arterial tortuosity syndrome: early diagnosis and association with venous tortuosity. J Am Coll Cardiol. 2013;61(7):783.
- Zhang X, et al. The relationship between retinal vascular tortuosity and retinal vasculitis. J Ophthalmic Inflamm Infect. 2025;15:65.
- Cuhlmann S, et al. Disturbed blood flow induces RelA expression via c-Jun N-terminal kinase 1: a novel mode of NF-κB regulation that promotes arterial inflammation. Circ Res. 2011;108(8):950-959.
- Sunderland K, Jiang J, Zhao F. Disturbed flow's impact on cellular changes indicative of vascular aneurysm initiation, expansion, and rupture: a pathological and methodological review. J Cell Physiol. 2022;237(1):278-300.
- Luu V, et al. Role of endothelial primary cilia as fluid mechanosensors on vascular health. Atherosclerosis. 2018;275.
- Vion AC, et al. Endothelial cell orientation and polarity are controlled by shear stress and VEGF through distinct signaling pathways. Front Physiol. 2021;11:623769.
- Petzold T, et al. Focal adhesion kinase modulates activation of NF-kappaB by flow in endothelial cells. Am J Physiol Cell Physiol. 2009;297(4):C814-C822.
- Thodeti CK, et al. TRPV4 channels mediate cyclic strain-induced endothelial cell reorientation through integrin-to-integrin signaling. Circ Res. 2009;104(9):1123-1130.
- Beech DJ. PIEZO force sensing in vascular biology: an explosion of new knowledge, concepts and opportunity. Adv Sci (Weinh). 2025;12(41):e11774.
- Tamargo IA, et al. Flow-induced reprogramming of endothelial cells in atherosclerosis. Nat Rev Cardiol. 2023;20(11):738-753.
- Chiu JJ, Chien S. Effects of disturbed flow on vascular endothelium: pathophysiological basis and clinical perspectives. Physiol Rev. 2011;91(1):327-387.
- Nakajima H, Mochizuki N. Flow pattern-dependent endothelial cell responses through transcriptional regulation. Cell Cycle. 2017;16(20):1893-1901.
- Zhao Y, et al. Small rodent models of atherosclerosis. Biomed Pharmacother. 2020;129:110426.
- Curry-Koski T, Curtin LP, Esfandiarei M, Thomas TC. Cerebral microvascular density, blood-brain barrier permeability, and support for neuroinflammation indicate early aging in a Marfan syndrome mouse model. Front Physiol. 2024;15:1457034.
- Thompson JW, et al. In vivo cerebral aneurysm models. Neurosurg Focus. 2019;47(1).
- Golledge J, Krishna SM, Wang Y. Mouse models for abdominal aortic aneurysm. Br J Pharmacol. 2022;179(5):792-810.
- Noval Rivas M, Arditi M. Kawasaki disease: pathophysiology and insights from mouse models. Nat Rev Rheumatol. 2020;16(7):391-405.
- He L, et al. Endothelial shear stress signal transduction and atherogenesis: from mechanisms to therapeutics. Pharmacol Ther. 2022;235:108152.
- Wang X, et al. Endothelial mechanobiology in atherosclerosis. Cardiovasc Res. 2023;119(8):1656-1675.
- Humphrey JD, Schwartz MA. Vascular mechanobiology: homeostasis, adaptation, and disease. Annu Rev Biomed Eng. 2021;23:1-27.
- Wang C, Lu H, Schwartz MA. A novel in vitro flow system for changing flow direction on endothelial cells. J Biomech. 2012;45(7):1212-1218.
- Sedlak J, Clyne A. Application of shear stress to endothelial cells using a parallel plate flow chamber. Methods Mol Biol. 2023;2600:81-90.
- Zhu J, et al. Advances in tissue engineering of vasculature through three-dimensional bioprinting. Dev Dyn. 2021;250(12):1717-1738.
- Kinstlinger IS, Miller JS. 3D-printed fluidic networks as vasculature for engineered tissue. Lab Chip. 2016;16(11):2025-2043.
- Werschler N, Quintard C, Nguyen S, Penninger J. Engineering next generation vascularized organoids. Atherosclerosis. 2024;398:118529.
- Shakeri A, et al. Engineering organ-on-a-chip systems for vascular diseases. Arterioscler Thromb Vasc Biol. 2023;43(12):2241-2255.
- Xie X, et al. Customizable microfluidic origami liver-on-a-chip (oLOC). Adv Mater Technol. 2022;7(5):2100677.
- Kawakita S, et al. Organ-on-a-chip models of the blood-brain barrier: recent advances and future prospects. Small. 2022;18(39):e2201401.
- Bai H, Ingber DE. What can an organ-on-a-chip teach us about human lung pathophysiology Physiology. 2022;37(5).
- Seghir R, Arscott S. Extended PDMS stiffness range for flexible systems. Sens Actuators A Phys. 2015;230:33-39.
- Hasler J, et al. Development and characterization of a tunable PDMS substrate model for investigating elastic properties and mechanical stretching in intervertebral disc cells. JOR Spine. 2025;8(4):e70140.
- Uroz M, et al. Differential stiffness between brain vasculature and parenchyma promotes metastatic infiltration through vessel co-option. Nat Cell Biol. 2024;26(12):2144-2153.
- Wood JA, Liliensiek SJ, Russell P, Nealey PF, Murphy CJ. Biophysical cueing and vascular endothelial cell behavior. Materials. 2010;3(3):1620-1639.
- Peloquin J, Huynh J, Williams RM, Reinhart-King CA. Indentation measurements of the subendothelial matrix in bovine carotid arteries. J Biomech. 2011;44(5):815-821.
- McQueen A, Warboys CM. Mechanosignalling pathways that regulate endothelial barrier function. Curr Opin Cell Biol. 2023;84:102213.
- Hahn C, Orr AW, Sanders JM, Jhaveri KA, Schwartz MA. The subendothelial extracellular matrix modulates JNK activation by flow. Circ Res. 2009;104(8):995-1003.
- Xu Z, et al. Matrix stiffness, endothelial dysfunction and atherosclerosis. Mol Biol Rep. 2023;50(8):7027-7041.
- Lemarié CA, Tharaux PL, Lehoux S. Extracellular matrix alterations in hypertensive vascular remodeling. J Mol Cell Cardiol. 2010;48(3):433-439.
- Huveneers S, Daemen MJAP, Hordijk PL. Between Rho(k) and a hard place: the relation between vessel wall stiffness, endothelial contractility, and cardiovascular disease. Circ Res. 2015;116(5):895-908.
- Stankey PP, et al. Embedding biomimetic vascular networks via coaxial sacrificial writing into functional tissue. Adv Mater. 2024;36(36):e2401528.
- Sundaram S, et al. Sacrificial capillary pumps to engineer multiscalar biological forms. Nature. 2024;636(8042):361-367.
- Kroll KT, et al. A perfusable, vascularized kidney organoid-on-chip model. Biofabrication. 2024;16(4).
- Strobel HA, Moss SM, Hoying JB. Vascularized tissue organoids. Bioengineering. 2023;10(2):124.
- Servais B, et al. Engineering brain-on-a-chip platforms. Nat Rev Bioeng. 2024;2(8):691-709.
- Osaki T, Sivathanu V, Kamm RD. Engineered 3D vascular and neuronal networks in a microfluidic platform. Sci Rep. 2018;8(1):5168.
- Maharjan S, Cecen B, Zhang YS. 3D immunocompetent organ-on-a-chip models. Small Methods. 2020;4(9):2000235.
- Fang JS, et al. A microphysiological system HHT-on-a-chip platform recapitulates patient vascular lesions. Nat Commun. 2026.
- Catano JA, et al. A patient-specific 3D printed carotid artery model integrating vascular structure, flow, and endothelium responses. Adv Healthc Mater. 2026;15(4):e02478.
- Li Z, Hui J, Yang P, Mao H. Microfluidic organ-on-a-chip system for disease modeling and drug development. Biosensors. 2022;12(6):370.
- Leung CM, et al. A guide to the organ-on-a-chip. Nat Rev Methods Primers. 2022;2(1):33.
- Campisi M, et al. 3D self-organized microvascular model of the human blood-brain barrier with endothelial cells, pericytes and astrocytes. Biomaterials. 2018;180:117-129.
- Miller JS, et al. Rapid casting of patterned vascular networks for perfusable engineered three-dimensional tissues. Nat Mater. 2012;11(9):768-774.
- Kong Z, Wang X. Bioprinting technologies and bioinks for vascular model establishment. Int J Mol Sci. 2023;24(1):891.
- Kolesky DB, et al. 3D bioprinting of vascularized, heterogeneous cell-laden tissue constructs. Adv Mater. 2014;26(19):3124-3130.
- Lin NYC, et al. Renal reabsorption in 3D vascularized proximal tubule models. Proc Natl Acad Sci U S A. 2019;116(12):5399-5404.
- Park W, et al. 3D bioprinted multilayered cerebrovascular conduits to study cancer extravasation mechanism related with vascular geometry. Nat Commun. 2023;14(1):7696.
- Kolesky DB, Homan KA, Skylar-Scott MA, Lewis JA. Three-dimensional bioprinting of thick vascularized tissues. Proc Natl Acad Sci U S A. 2016;113(12):3179-3184.
- Xiao Y, Liu Q, Han HC. Buckling reduces eNOS production and stimulates extracellular matrix remodeling in arteries in organ culture. Ann Biomed Eng. 2016;44(9):2840-2850.
- Arnaoutova I, George J, Kleinman HK, Benton G. The endothelial cell tube formation assay on basement membrane turns 20: state of the science and the art. Angiogenesis. 2009;12(3):267-274.
- Qiu Y, et al. Microvasculature-on-a-chip for the long-term study of endothelial barrier dysfunction and microvascular obstruction in disease. Nat Biomed Eng. 2018;2(6):453-463.
- Rose GG, Pomerat CM, Shindler TO, Trunnell JB. A cellophane-strip technique for culturing tissue in multipurpose culture chambers. J Biophys Biochem Cytol. 1958;4(6):761-764.
- Boudaoud A, et al. FibrilTool, an ImageJ plug-in to quantify fibrillar structures in raw microscopy images. Nat Protoc. 2014;9(2):457-463.
- Fischer RS, et al. Contractility, focal adhesion orientation, and stress fiber orientation drive cancer cell polarity and migration along wavy ECM substrates. Proc Natl Acad Sci U S A. 2021;118(22):e2021135118.
- Wolf KJ, et al. Perfusable 3D models of ureteric bud and collecting duct tubules. Cell Biomater. 2026;2(3):100297.
- Ren B, et al. Study of sacrificial ink-assisted embedded printing for 3D perfusable channel creation for biomedical applications. Appl Phys Rev. 2022;9(1).
- Hynes WF, et al. Examining metastatic behavior within 3D bioprinted vasculature for the validation of a 3D computational flow model. Sci Adv. 2020;6(35):eabb3308.
- Pisano A. From tubes and catheters to the basis of hemodynamics: viscosity and Hagen-Poiseuille equation. In: Physics for Anesthesiologists and Intensivists: From Daily Life to Clinical Practice. Springer; 2021:89-98.
- Gerhardt H, Betsholtz C. How do endothelial cells orientate EXS. 2005;(94):3-15.
- Baeyens N, et al. Endothelial fluid shear stress sensing in vascular health and disease. J Clin Invest. 2016;126(3):821-828.
- Lee J. Hemodynamics in Doppler ultrasonography. Ultrasonography. 2024;43(6):413.
- Kamada H, et al. Blood flow analysis with computational fluid dynamics and 4D-flow MRI for vascular diseases. J Cardiol. 2022;80(5):386-396.
- Postnov DD, Tuchin VV, Sosnovtseva O. Estimation of vessel diameter and blood flow dynamics from laser speckle images. Biomed Opt Express. 2016;7(7):2759.
- Dessalles CA, Leclech C, Castagnino A, Barakat AI. Integration of substrate- and flow-derived stresses in endothelial cell mechanobiology. Commun Biol. 2021;4:764.
- Parekh P, Agrawal N, Vasavada A, Vinchurkar M. Extreme coronary artery tortuosity in association with tortuosity of the systemic arteries: a rare and challenging situation for the interventionist. BMJ Case Rep. 2014;2014:bcr2014204725.
- Vetter J, Palagi I, Waisman A, Blaeser A. Recent advances in blood-brain barrier-on-a-chip models. Acta Biomater. 2025;197:1-28.
- Liu Y, Lin L, Qiao L. Recent developments in organ-on-a-chip technology for cardiovascular disease research. Anal Bioanal Chem. 2023;415(18):3911-3925.
- Cuenca MV, et al. Engineered 3D vessel-on-chip using hiPSC-derived endothelial- and vascular smooth muscle cells. Stem Cell Reports. 2021;16(9):2159-2168.
- van Engeland NCA, et al. A biomimetic microfluidic model to study signalling between endothelial and vascular smooth muscle cells under hemodynamic conditions. Lab Chip. 2018;18(11):1607-1620.
- Sobrino A, et al. A tissue-engineered 3D microvessel model reveals the dynamics of mosaic vessel formation in breast cancer. Cancer Res. 2020;80(19).
- Riddle RB, Jennbacken K, Hansson KM, Harper MT. A multicellular vessel-on-a-chip model reveals context-dependent roles for platelets in inflammation and inflammatory hemostasis. Blood Vessels Thromb Hemost. 2024;1(2):100007.
- Rickman M, et al. Disturbed flow increases endothelial inflammation and permeability via a Frizzled-4-β-catenin-dependent pathway. J Cell Sci. 2023;136(6):jcs260449.
- Shevchuk O, et al. Vessel-on-a-chip: a powerful tool for investigating endothelial COVID-19 fingerprints. Cells. 2023;12(9):1297.