This protocol describes posterior-only revision surgery for post-vertebral augmentation infection, including patient selection, cement-removal versus cement-preservation decisions, targeted debridement, pathogen testing, reconstruction, and structured follow-up assessment.
Method Article
A Posterior-Only Revision Surgery Protocol with Selective Cement Preservation for Post-Vertebral Augmentation Infection
* These authors contributed equally
In This Article
Summary
Abstract
Post-vertebral augmentation infection is uncommon but clinically serious, especially in older patients with multiple comorbidities and fragile spinal bone stock. Revision surgery is challenging because surgeons must eradicate infection, decompress neural structures when needed, restore stability, and decide whether polymethylmethacrylate cement can be safely preserved. This article describes a posterior-only protocol for diagnosing and treating post-vertebral augmentation infection and illustrates the workflow with a retrospective representative cohort treated between January 2015 and December 2024. Among 48 surgically treated patients, 12 underwent cement removal, and 36 underwent selective cement preservation when all predefined preservation conditions were satisfied, and no mandatory removal or intraoperative conversion criterion was present. The protocol emphasizes diagnosis confirmation, compartment-focused debridement, staged cement-decision logic, microbiological sampling including metagenomic next-generation sequencing, posterior stabilization, and postoperative reassessment. The median follow-up duration in the representative cohort was 14.0 months (interquartile range, 12.0–28.5 months). In selected patients, the cement-preservation pathway was associated with lower unadjusted operative burden, whereas final infection control, computed tomography-confirmed fusion, pain improvement, and complication rates were descriptively similar between groups. This protocol is intended for spine surgeons managing post-PVA infection when a posterior-only corridor can address the active infected compartment and provide stable reconstruction.
Introduction
Percutaneous vertebral augmentation (PVA), including percutaneous vertebroplasty (PVP) and percutaneous kyphoplasty (PKP), is widely used to treat painful osteoporotic vertebral compression fractures. Infection after augmentation is rare but can lead to discitis, vertebral destruction, epidural or paravertebral abscess formation, neurological decline, fixation failure, and prolonged antimicrobial treatment1,2. Salvage surgery is often technically demanding because cement, necrotic bone, and infected soft tissue may coexist around the index vertebra in elderly patients with limited physiological reserve3,4,5.
Many published salvage strategies emphasize radical cement extraction or combined anterior-posterior revision. The posterior-only strategy described here was developed to provide a reproducible alternative when the infected segment can be decompressed, debrided, reconstructed, and instrumented through a posterior corridor6. Its main advantages are procedural consolidation, avoidance of a second surgical approach, control of blood loss and soft-tissue disruption when anatomy permits, and a clear intraoperative decision pathway for converting from selective cement preservation to cement removal when safety or infection control requires it. The protocol does not claim universal superiority; it is intended to standardize decision-making and operative execution in a difficult revision setting7,8,9,10.
This protocol is primarily intended for spine surgeons familiar with posterior decompression, debridement, fixation, and interbody reconstruction in infection surgery. It is most appropriate for surgically indicated post-PVA infection in which the active infected compartment can be reached posteriorly, stabilization is feasible through posterior instrumentation, and cement removal can be reserved for cases with mechanical instability, migration, obstruction, purulent embedding, or failed preservation criteria. Readers should use the protocol together with institution-specific antimicrobial pathways, imaging availability, and implant resources.
Protocol
The retrospective cohort and protocol reporting were approved by the Ethics Committee of Fuzhou Second General Hospital (Ethics No. 2025202-X1). Written informed consent for participation in this retrospective study was obtained from all included patients. Written informed consent for surgery was obtained from all patients. Written informed consent for publication of the de-identified clinical images shown in Figure 1 and Figure 2 was obtained from the patients represented.
1. Confirm the diagnosis and define the treatment pathway
- Identify patients with prior PVA, including PVP or PKP. Suspect post-PVA infection when persistent or recurrent back pain, fever, wound drainage, new neurological deficit, radicular pain, or destructive postoperative imaging findings are present.
- Confirm infection with clinical assessment, white blood cell count, C-reactive protein, erythrocyte sedimentation rate, magnetic resonance imaging (MRI), computed tomography (CT), and plain radiography. Obtain two sets of blood cultures before new antibiotics when the patient is clinically stable.
- Review the index augmentation record. Define the active infected compartment as the anatomic space that still contains pus, infected granulation tissue, necrotic disc or bone, or communication with the symptomatic abscess cavity. Record the vertebral level, cement distribution, time from augmentation to symptom onset, prior antibiotics, comorbidities, and baseline neurological status.
- Choose operative treatment when neurological compromise, spinal instability, progressive vertebral destruction, enlarging abscess, sepsis, or failure of nonoperative treatment is present. Reassess any nonoperative candidate closely and convert to surgery if these risk features emerge.
2. Prepare the patient and infection-control plan
- Review MRI and CT together before surgery. Map the dominant infected compartment, neural compression, vertebral-body destruction, cement morphology, and the posterior corridor that can reach the lesion most directly.
- Withhold additional antibiotics before incision when the patient is stable and intraoperative sampling is imminent. Document the last antibiotic dose, route, and timing when preoperative treatment cannot be interrupted safely.
- Prepare separate sterile containers for aerobic and anaerobic culture, histopathology, and metagenomic next-generation sequencing (mNGS).
- Plan posterior instrumentation, graft options, blood products, and neuromonitoring according to bone quality and neurological risk.
3. Decide whether cement removal is required
- Classify the revision as cement removal or selective cement preservation by integrating CT, MRI, radiographs, and the algorithm in Figure 3. Apply the preservation, mandatory removal, and intraoperative conversion rules summarized in Supplementary Table 1.
- Choose cement removal when any mandatory removal condition is present, including loose, migrated, fragmented, mechanically obstructive, directly compressive, grossly exposed within purulent necrosis, or unreconstructable cement. Override any initial preservation plan when any mandatory removal condition is present.
- Choose selective cement preservation only when all preservation conditions are satisfied. Confirm stable cement, absence of direct cement-related neural compression, posterior access to the active infected compartment, and the ability to complete debridement and stable reconstruction without cement extraction.
- Treat preservation as conditional rather than guaranteed. Convert to cement removal intraoperatively if cement becomes mobile, purulence tracks continuously along retained cement, viable debridement margins cannot be reached, or fixation or reconstruction becomes unsafe without extraction.
- Record the final pathway and the exact reason for removal, preservation, or intraoperative conversion in the operative record. Use Supplementary Table 1 as the practical rule set.
4. Position, expose, sample, and stabilize
- Place the patient prone on a radiolucent frame after general anesthesia. Protect pressure points, keep the abdomen free, and confirm the operative level on anteroposterior and lateral fluoroscopy.
- Make a posterior midline incision and expose the planned fixation levels subperiosteally. Limit unnecessary stripping of uninvolved soft tissue.
- Insert pedicle screws according to the preoperative fixation plan and place a temporary rod before major decompression or debridement when construct stability may be compromised11.
- Collect deep specimens before definitive irrigation whenever feasible.
5. Perform the cement-removal pathway
- Use a laminectomy, facetectomy, transpedicular access, or a transforaminal corridor to reach the cement-infection interface. Protect the dura, nerve roots, and segmental vessels throughout mobilization.
- Remove loose or obstructive cement, pus, necrotic tissue, infected disc, abscess wall, and devitalized bone until every surgically accessible infected cavity has been cleared. Avoid levering cement directly against neural structures.
- Reconstruct the anterior or middle column when needed and complete definitive posterior fixation and fusion. Confirm decompression and construct stability before closure.
6. Perform the cement-preservation pathway
- Use this pathway only when the active infected compartment can be treated without cement extraction. Preserve stable cement only after confirming that the retained cement is not an inaccessible reservoir of ongoing purulence.
- Create the posterior intervertebral or transforaminal corridor on the safer side according to preoperative imaging. Debride the infected disc space, endplate granulation tissue, paravertebral abscess cavity, and necrotic tissue around the cement.
- Define adequate debridement as removal of visible pus and devitalized tissue from all surgically accessible infected cavities, decompression of compromised neural elements, and absence of continuous purulent tracking along retained cement. Confirm the operative endpoint using the criteria in Section 6.4.
- Stop debridement only after no residual pus is visible within the accessible cavity, devitalized tissue has been removed, and the retained cement remains mechanically stable. Convert to cement removal immediately if these endpoints cannot be met safely.
- Place local autograft or other institution-approved fusion material after debridement and complete posterior fixation. Avoid repeated manipulation of the retained cement after the final stability check.
7. Collect specimens and identify pathogens
- Collect three to five deep tissue specimens when feasible from distinct infected sites before final irrigation. Sample the disc space, vertebral lesion, abscess cavity, and tissue adjacent to the cement-decision interface when clinically informative.
- Send separate specimens for conventional culture, histopathology, and mNGS. Keep mNGS and culture samples unfixed and label the specimen source precisely.
- Interpret mNGS results according to the reporting criteria validated by the performing clinical laboratory.
NOTE: No study-specific universal read-count threshold was prespecified. - Assess the clinical relevance of each detected organism by integrating the laboratory report with specimen source, conventional culture, histopathology, imaging findings, and the overall clinical syndrome12–15.
8. Close the wound and start postoperative treatment
- Irrigate the field with sterile saline after sampling and definitive debridement. Reinspect neural structures, instrumentation, graft placement, and retained cement before closure.
- Place closed-suction drainage when dead space or residual oozing warrants it and document the drain location. Remove the drain after output decreases progressively, the wound remains dry, and no ongoing collection or cerebrospinal fluid leak is suspected.
- Start empiric intravenous antibiotics after sampling unless preoperative sepsis or neurological deterioration requires earlier treatment. Narrow therapy after culture or mNGS correlation with infectious-disease input16.
- Transition from intravenous to pathogen-directed oral therapy when the patient is afebrile, the wound is stable, inflammatory markers are decreasing, and an active oral agent with adequate bioavailability is available.
9. Mobilize, follow, and troubleshoot non-response
- Mobilize the patient after the surgical team confirms fixation stability, adequate neurological status, pain control, and wound safety. Use external bracing when construct stability or bone quality requires additional support.
- Monitor wound condition, temperature, drain output, white blood cell count, C-reactive protein, erythrocyte sedimentation rate, and neurological status during hospitalization. Record deviations that prolong drainage or antimicrobial therapy.
- Reassess symptoms, wound status, inflammatory markers, and MRI at approximately 6 weeks after surgery. Obtain an MRI earlier when persistent fever, wound drainage, recurrent pain, neurological deterioration, or an uncertain treatment response warrant earlier reassessment.
- Obtain CT during postoperative follow-up to assess structural stability and osseous fusion.
NOTE: CT timing was clinically driven rather than prespecified; final radiographic fusion was adjudicated from the last available clinically relevant postoperative CT examination. - Treat persistent fever, wound drainage, rising inflammatory markers, progressive MRI abnormalities, new instability, or neurological decline as a non-response checkpoint.
- Re-evaluate the organism, antibiotic coverage, retained cement status, and hardware stability before prolonging therapy or planning reoperation17.
Results
Between January 2015 and December 2024, 7,506 primary PVA procedures were performed at the Fuzhou Second General Hospital. Seven post-PVA infections occurred after institutional PVA, and an additional 46 patients were referred after undergoing PVA elsewhere. Overall, 53 patients were diagnosed with post-PVA infection, of whom 48 underwent surgical treatment (Figure 4).
Among the 48 surgically treated patients, the mean age was 73.0 ± 8.8 years, and 23 patients (47.9%) were female. The median interval from PVA to infection presentation was 3.0 months (interquartile range [IQR], 1.0–10.5 months), and the median follow-up duration was 14.0 months (IQR, 12.0–28.5 months) (Table 1). Twelve patients underwent the cement-removal pathway, whereas 36 underwent the cement-preservation pathway (Table 2).
Patient-level etiological detection by mNGS or conventional culture was positive in 35 of 48 patients (72.9%), including 10 of 12 patients in the cement-removal group and 25 of 36 patients in the cement-preservation group (Figure 5A). In the unadjusted group comparisons, operative time, blood loss, and transfusion frequency were lower in the cement-preservation group, whereas final infection control, CT-confirmed fusion, readmission, pain improvement, and complication rates were descriptively similar between the two groups (Figure 5B, Supplementary Table 2).
At the last available follow-up, infection control was documented in all 12 patients in the cement-removal group and in 33 of 36 patients in the cement-preservation group. CT-confirmed complete fusion was documented in 9 of 12 patients and 24 of 36 patients, respectively (Figure 5B; Table 2). Postoperative MRI was typically obtained at approximately 6 weeks, with earlier examinations performed when clinically indicated (Figure 1 and Figure 2). Because CT follow-up was clinically driven rather than performed at a fixed prespecified time point, final radiographic fusion was assessed using the last available clinically relevant postoperative CT examination. Similarly, final infection control was assessed at the last available clinical follow-up.
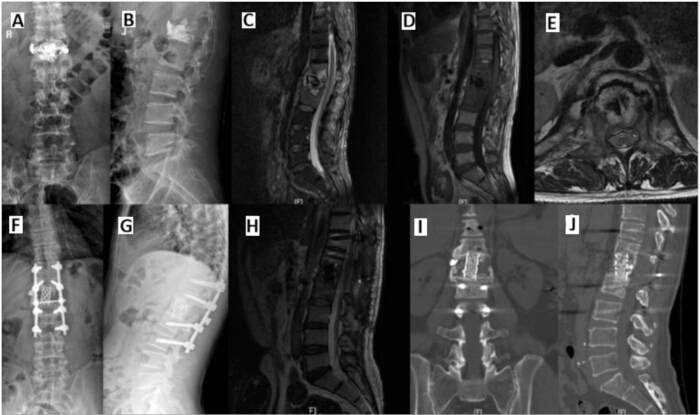
Figure 1: Representative cement-removal revision case. A 53-year-old man underwent L1 PVP for an L1 fracture. (A–B) These panels show preoperative anteroposterior and lateral radiographs with cement augmentation. (C–E) These panels show sagittal and axial MRI findings of post-PVA infection and paravertebral abscess six months after PVP. (F–G) These panels show posterior-only cement removal, titanium mesh reconstruction, and pedicle screw fixation on postoperative radiographs. (H) This panel shows inflammatory improvement on MRI at six weeks. (I–J) These panels show CT-confirmed fusion at one year. Abbreviations: PVP = percutaneous vertebroplasty; PVA = percutaneous vertebral augmentation; MRI = magnetic resonance imaging; CT = computed tomography. Please click here to view a larger version of this figure.
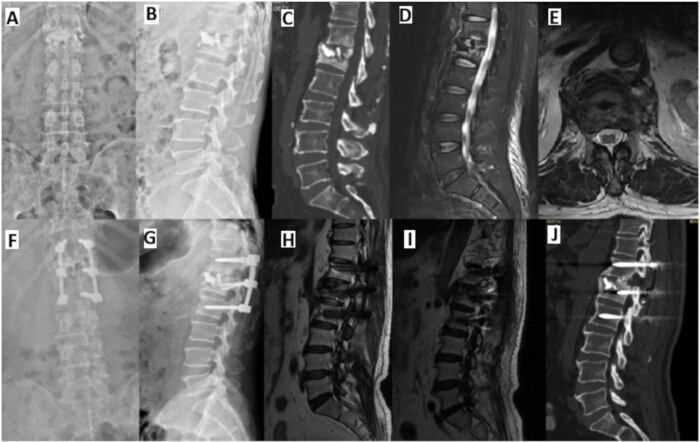
Figure 2: Representative cement-preservation revision case. A 67-year-old man underwent L1 PVP for an osteoporotic vertebral compression fracture. (A–C) These panels show preoperative radiographs and CT with cement augmentation. (D, E) show sagittal and axial MRI findings of post-PVA infection and paravertebral abscess. Panels f and g show posterior-only intervertebral debridement, cement preservation, fusion, and internal fixation. (H–I)These panels show inflammatory improvement on MRI at six weeks, and (J) This panel shows CT-confirmed fusion at six months. Abbreviations: PVP = percutaneous vertebroplasty; PVA = percutaneous vertebral augmentation; MRI = magnetic resonance imaging; CT = computed tomography. Please click here to view a larger version of this figure.
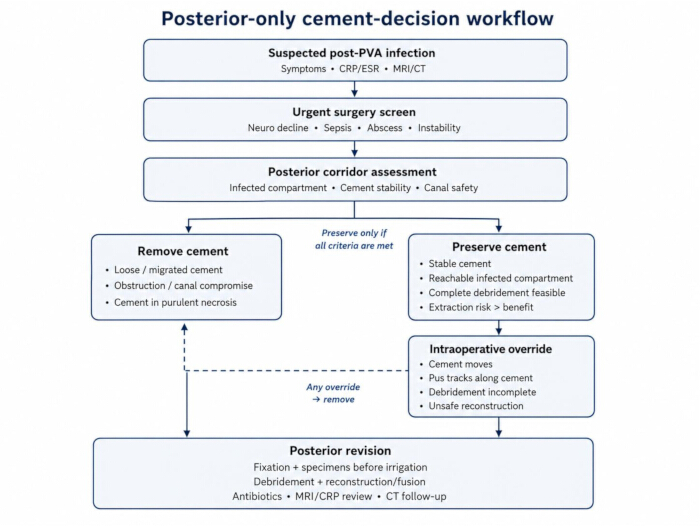
Figure 3: Posterior-only protocol workflow and cement-decision algorithm for post-PVA infection. All preservation criteria must be satisfied; any mandatory removal or intraoperative conversion criterion triggers cement removal or conversion. Abbreviations: PVA = percutaneous vertebral augmentation; MRI = magnetic resonance imaging; CT = computed tomography; CRP = C-reactive protein; ESR = erythrocyte sedimentation rate. Please click here to view a larger version of this figure.
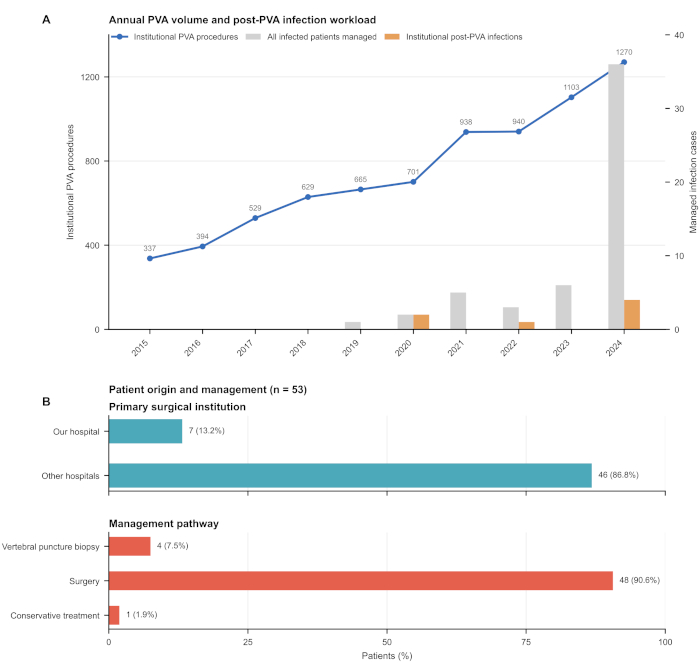
Figure 4: Annual institutional PVA volume, post-PVA infection workload, patient origin, and treatment pathway. (A) It summarizes the annual number of institutional PVA procedures, all infected patients managed, and institutional post-PVA infections. (B) It summarizes the 53 diagnosed post-PVA infection patients, including 7 institutional cases and 46 referrals, and the resulting treatment allocation. Abbreviation: PVA = percutaneous vertebral augmentation. Please click here to view a larger version of this figure.
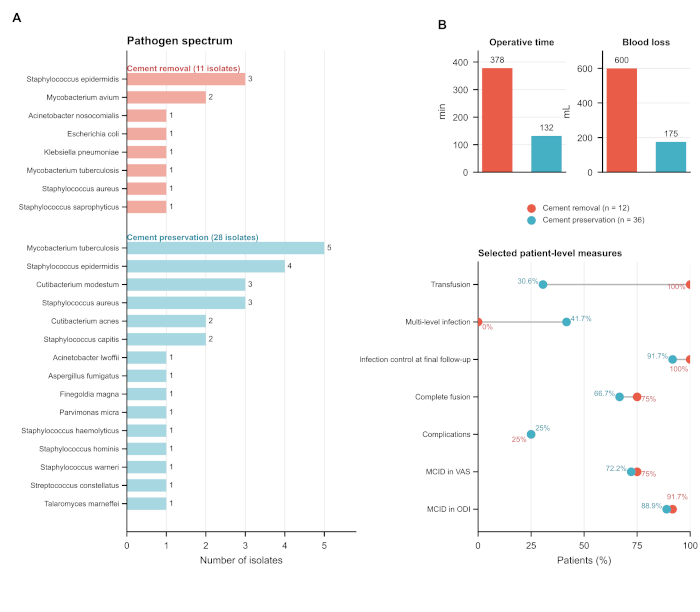
Figure 5: Pathogen spectrum and selected patient-level measures after posterior-only revision. (A) This figure shows isolate-level pathogen findings (39 total isolates; 11 isolates from the cement-removal group and 28 isolates from the cement-preservation group). (B) This figure shows descriptive patient-level perioperative and outcome measures (12 cement-removal patients and 36 cement-preservation patients); the corresponding statistical tests and unadjusted P values are reported in Table 2. Abbreviations: CT = computed tomography; VAS = Visual Analog Scale; ODI = Oswestry Disability Index; MCID = minimal clinically important difference. Please click here to view a larger version of this figure.
Table 1: Patient demographics and baseline clinical characteristics of the 48 surgically treated patients. All reported variables were analyzable in all 48 patients, with no missing data. Other diseases comprised infrequently recorded comorbid conditions and were retained as a summary category. Abbreviations: BMI = body mass index; CRP = C-reactive protein; WBC = white blood cell count; ESR = erythrocyte sedimentation rate; VAS = Visual Analog Scale; ASIA = American Spinal Injury Association; mNGS = metagenomic next-generation sequencing. Please click here to download this Table.
Table 2: Comparison between the cement-removal group and cement-preservation group. Effect estimates are reported as Group B minus Group A; positive values indicate higher values or proportions in the cement-preservation group, and negative values indicate lower values or proportions in that group. Group definitions: Group A = cement-removal group; Group B = cement-preservation group. Analyzable n is reported as the per-variable denominator for Group A / Group B. Missing values are reported as unavailable data counts for Group A / Group B. Abbreviations: CT = computed tomography; VAS = Visual Analog Scale; ODI = Oswestry Disability Index; MCID = minimal clinically important difference; PVP = percutaneous vertebroplasty. Please click here to download this Table.
Supplementary Table 1: Practical preservation criteria, mandatory removal criteria, and intraoperative conversion triggers for selective cement preservation. All preservation criteria are required, and any mandatory-removal criterion or intraoperative override triggers removal or conversion. Please click here to download this file.
Supplementary Table 2: Retrospective review of five patients who required postoperative readmission. Please click here to download this file.
Discussion
This protocol frames posterior-only revision for post-PVA infection as a decision-guided workflow rather than a fixed cement-retention strategy. The central practical question is whether the active infected compartment can be reached, debrided, decompressed, and reconstructed safely through a posterior corridor while leaving only mechanically stable cement that is not functioning as an inaccessible infectious nidus.
The main technical advantage of the protocol is that it consolidates decompression, debridement, instrumentation, and fusion planning into one posterior operation when the anatomy permits it. For selected patients, this may limit operative trauma compared with broader combined approaches, but the protocol should not be interpreted as evidence that selective cement preservation is categorically superior. In this retrospective cohort, the preservation pathway was applied to patients who already satisfied more favorable anatomical conditions, which introduces clear selection bias.
The applicability of the protocol is therefore limited to selected clinical scenarios. Cement removal remains mandatory when cement is loose, migrated, obstructive, exposed within gross purulence, or when complete debridement and stable reconstruction cannot be achieved otherwise. The protocol is most useful for spine surgeons who can judge posterior access routes, identify conversion triggers, and balance infection clearance against the risks of aggressive cement extraction in elderly or medically vulnerable patients.
Several limitations should be stated explicitly. The representative comparison is retrospective, sequential, and non-randomized; the sample size is modest; MRI and CT follow-up were based on retrospective clinical practice rather than a prespecified imaging schedule; and some operational parameters, such as drain management, IV-to-oral transition, and device-level model documentation, were institution-specific rather than protocolized in this study. These constraints limit causal interpretation and the reproducibility of institution-specific postoperative details.
Pathogen identification and postoperative surveillance remain critical. Conventional culture can be limited by prior antibiotics or low-burden infection, which is why the protocol pairs culture with mNGS and histopathology. Recent postoperative spine infection series also show substantial microbiological heterogeneity and repeated operative or antibiotic management18,19. Postoperative non-response should prompt a structured re-evaluation of organism identification, antimicrobial coverage, retained cement status, and construct stability rather than automatic prolongation of therapy.
Evidence supporting posterior stabilization without formal debridement in selected frail patients is limited and does not justify retaining an uncontrolled infected compartment20. The present protocol, therefore, requires compartment-directed debridement and treats any failure to reach adequate margins as an override that triggers cement removal or conversion.
Disclosures
The authors declare no competing interests.
Generative AI was used to assist with language editing and manuscript revision. All scientific content, data interpretation, and final wording were reviewed and approved by the authors.
Acknowledgements
The authors thank the patients, clinical staff, and research team members who contributed to diagnosis, surgery, follow-up, and data collection.
This work was supported by the Fujian Provincial Clinical Medical Research Center for First Aid and Rehabilitation in Orthopedic Trauma (2020Y2014).
Materials
| Name | Company | Catalog Number | Comments |
|---|---|---|---|
| Anaerobic transport medium or container | BD | 221606 | BBL Port-A-Cul tube |
| Bacterial and fungal culture system | bioMerieux | 410851; 410852 | BACT/ALERT VIRTUO; BACT/ALERT FA Plus; FN Plus |
| Bone grafting instruments | DePuy Synthes | 01.211.003 | Bone Harvesting Set |
| C-arm fluoroscopy system | Siemens Healthineers | / | Cios Select with FD |
| C-reactive protein assay | Roche Diagnostics | 07876033190 | Tina-quant C-Reactive Protein IV (CRP4) |
| Closed-suction drains | Cardinal Health | SU130-1000 | Jackson-Pratt 400 cc reservoir |
| Computed tomography scanner | Siemens Healthineers | / | SOMATOM go.Top |
| Curettes and rongeurs | B. Braun Aesculap | FK841R; OK711R | VOLKMANN bone curette; KERRISON bone punch |
| High-speed burr and ultrasonic bone scalpel | Misonix BoneScalpel | BCM-SY | BoneScalpel System |
| Magnetic resonance imaging system | Siemens Healthineers | / | MAGNETOM Skyra 3T |
| Metagenomic next-generation sequencing service/platform | Ajian (Fuzhou) Gene Medical Laboratory Co., Ltd. | / | PathoSeq mNGS pathogen detection platform |
| Mycobacterial testing platform | BD | 445870 | BACTEC MGIT 960 |
| Pedicle screw-rod fixation system | Medtronic CD Horizon Solera | / | CD Horizon Solera; model and dimensions varied by case |
| Sterile saline irrigation | Baxter | NACLIRR | Sodium Chloride for Irrigation |
| Sterile tissue culture containers | Thermo Fisher Scientific | 010001 | Samco Wide-Mouth Bio-Tite 120 mL specimen container |
| Titanium mesh cage | DePuy Synthes SYNMESH | / | SYNMESH |
References
- Anselmetti GC, et al. Percutaneous vertebroplasty: multi-centric results from EVEREST experience in large cohort of patients. Eur J Radiol. 2012;81(12):4083-6.
- Tsoumakidou G, et al. CIRSE guidelines on percutaneous vertebral augmentation. Cardiovasc Intervent Radiol. 2017;40(3):331-42.
- Mounika C, Tadge T, Keerthana M, Velyutham R, Kapusetti G. Advancements in poly(methyl methacrylate) bone cement for enhanced osteoconductivity and mechanical properties in vertebroplasty: a comprehensive review. Med Eng Phys. 2023;120:104049.
- Yuan H, et al. Spinal infection after vertebral augmentation: a covert complication with serious havoc. Arch Orthop Trauma Surg. 2024;144(4):1461-71.
- Park JW, et al. Infection following percutaneous vertebral augmentation with polymethylmethacrylate. Arch Osteoporos. 2018;13(1):47.
- Abdelrahman H, Siam AE, Shawky A, Ezzati A, Boehm H. Infection after vertebroplasty or kyphoplasty: a series of nine cases and review of literature. Spine J. 2013;13(12):1809-17.
- Zampetakis K, et al. Infection following vertebroplasty or kyphoplasty: a systematic review of risk factors, treatment options and outcomes. Global Spine J. 2026;16(3):1598-607.
- Chiu YC, Yang SC, Chen HS, Kao YH, Tu YK. Posterior transpedicular approach with circumferential debridement and anterior reconstruction as a salvage procedure for symptomatic failed vertebroplasty. J Orthop Surg Res. 2015;10:28.
- Zhang S, Wang S, Wang Q, Yang J, Xu S. Debridement and corpectomy via single posterior approach to treat pyogenic spondylitis after vertebral augmentation. BMC Musculoskelet Disord. 2021;22(1):591.
- Hu X, Jiang W, Chen Y, Wang Y, Ma W. Revision surgery after cement augmentation for osteoporotic vertebral fracture. Orthop Traumatol Surg Res. 2021;107(7):102796.
- Talia AJ, Wong ML, Lau HC, Kaye AH. Safety of instrumentation and fusion at the time of surgical debridement for spinal infection. J Clin Neurosci. 2015;22(7):1111-6.
- Lin W, et al. Diagnostic performance of metagenomic next-generation sequencing and conventional microbial culture for spinal infection: a retrospective comparative study. Eur Spine J. 2023;32(12):4238-45.
- Li Z, et al. Value of metagenomic next-generation sequencing in the diagnosis of native pyogenic spinal infections: a multicenter, retrospective observational study. Spine J. 2025;25(4):640-8.
- Li C, Xiao NS, Ke BY, Li S, Lin Y. Application of metagenomic next-generation sequencing in suspected spinal infectious diseases. World Neurosurg. 2024;185:e542-8.
- Lv H, et al. Application of metagenomic next-generation sequencing for rapid molecular identification in spinal infection diagnosis. Front Cell Infect Microbiol. 2024;14:1382635.
- Bernard L, et al. Antibiotic treatment for 6 weeks versus 12 weeks in patients with pyogenic vertebral osteomyelitis: an open-label, non-inferiority, randomised, controlled trial. Lancet. 2015;385(9971):875-82.
- Kramer A, et al. Diagnosis and management of de novo non-specific spinal infections: European Association of Neurosurgical Societies Spine Section Delphi consensus recommendations. Brain Spine. 2025;5:104178.
- Zhao A, et al. The microbiology of postoperative spine surgical site infections: an institutional experience of 170 cases. J Clin Orthop Trauma. 2026;81:103553.
- Mace W, et al. Incidence and surgical management of secondary spine infections: a retrospective case series study of 4,921 consecutive patients. J Clin Orthop Trauma. 2026;80:103512.
- Elmajee M, et al. Posterior stabilisation without formal debridement for the treatment of non-tuberculous pyogenic spinal infection in frail and debilitated population: a systematic review and meta-analysis. J Clin Orthop Trauma. 2021;15:9-15.