This bibliometric analysis of 1,014 publications on sacrococcygeal pilonidal disease (2000–2025) maps global research trends, collaborative networks, thematic evolution, and emerging frontiers, revealing evolving research emphasis toward minimally invasive techniques and evidence-based prevention strategies.
Research Article
Bibliometric and Knowledge-Mapping Analysis of Sacrococcygeal Pilonidal Disease Research (2000–2025)
* These authors contributed equally
In This Article
Summary
Abstract
Sacrococcygeal pilonidal disease (SPD) is an acquired inflammatory condition predominantly affecting young adults and adolescents, with a rising incidence and substantial clinical burden. Despite increasing research activity, the global scientific landscape of SPD, including research output, co-authorship patterns, knowledge diffusion pathways, thematic evolution, and emerging research frontiers, has not been systematically analyzed in the peer-reviewed literature. This study aimed to address this gap using a multitool bibliometric analysis. Bibliometric tools (VOSviewer, CiteSpace, and Pajek) were used to summarize the key features and generate visualizations. Articles and reviews on SPD published between 2000 and 2025 were retrieved from the Web of Science Core Collection. A total of 1,014 papers from 72 countries and 1,387 institutions were included. Research output steadily increased, with a marked acceleration after 2018. Turkey led in publication productivity and citation impact, whereas Germany, England, and the USA were key hubs for international collaboration. The University of Naples Federico II published the most articles, while the Technical University of Munich received the most citations. Dietrich Doll emerged as the most prominent and productive researcher in this field. Diseases of the Colon & Rectum was the most influential journal. Increasing research attention toward minimally invasive techniques, alongside continued interest in conventional surgical approaches, was identified. Current research interests emphasize less invasive strategies, etiological prevention, and evidence synthesis. This study provides valuable information for clinicians and researchers to better understand the current global status of SPD, recognize emerging research themes, and identify potential areas for future investigation and collaboration.
Introduction
Sacrococcygeal pilonidal disease (SPD) is an acquired inflammatory condition characterized by asymptomatic midline pits, acute abscesses, or painful sinus tracts, primarily affecting teenagers and young adults1,2,3. Its incidence has been increasing in clinical practice, particularly in European countries4,5,6. In Germany, between 2005 and 2017, the average number of inpatient episodes of SPD per 100,000 males climbed from 43 to 56, and per 100,000 females from 14 to 185. Generally, it requires surgical intervention and is an economically burdensome disease that contributes to loss of productivity and substantial treatment costs in working-age patients, placing an increasing strain on healthcare systems worldwide7. In adolescents, SPD imposes substantial physical and psychological burdens, with intergluteal pain and discharge disrupting daily activities, sports, and school attendance, while high recurrence rates and chronic course diminish quality of life and impair psychosocial development1,8.
Although conservative nonoperative options such as phenol injection occupy a significant place in management1,9, surgery remains a standard treatment approach for symptomatic SPD, despite its potential complications and recurrence risk10. Incision and drainage is recommended for pilonidal abscess11, and for symptomatic chronic sinus disease, myriad surgical modalities have been described1,10, with the specific choice largely depending on disease characteristics and the surgeon’s expertise4. Historically, excision with primary closure or secondary healing represented commonly used surgical approaches for chronic SPD, with each strategy associated with distinct advantages and limitations3,12,13. Off-midline closure procedures, including Karydakis flaps, Limberg flaps, and Bascom cleft-lift, have been increasingly adopted as reconstructive options when primary closure is selected, owing to their favorable healing outcomes, reduced wound morbidity compared with midline closure, and acceptable recurrence rates4. Over the past decade, minimally invasive surgical techniques, including limited excisional procedures such as sinusectomy (e.g., the Gips procedure) and endoscopic treatment approaches, have attracted increasing clinical and research interest as less invasive alternatives to conventional excisional procedures1,2,14. Nevertheless, the optimal surgical strategy for SPD remains influenced by disease characteristics, patient factors, and surgeon preference, with ongoing investigation into comparative effectiveness among available approaches.
Despite these developments, the scientific literature on SPD presents several macroscopic challenges that warrant systematic investigation. Specifically, although research output in this domain has grown rapidly15, the evolutionary trajectories of research topics and emerging frontiers remain insufficiently characterized from a quantitative perspective, and knowledge diffusion pathways have not been systematically explored. Additionally, research productivity varies markedly across regions16, and although collaboration within the field is crucial for promoting scientific exchange and knowledge advancement17, comprehensive analysis of cooperative networks among contributors remains limited. Bibliometric analysis has emerged as a robust approach capable of addressing these challenges and has been used to investigate diverse anorectal diseases, including hemorrhoids18,19, perianal fistula20, and rectal prolapse21. Previous studies related to SPD have provided valuable insights into specific aspects of the literature, including clinical evidence mapping15, publication productivity16, citation characteristics22, and methodological trends23. However, these investigations have primarily focused on individual dimensions of SPD research, such as clinical evidence domains, country-level productivity, highly cited publications, or study design characteristics, while a comprehensive evaluation integrating global collaboration networks, intellectual structures, and thematic evolution remains lacking. Therefore, this study aims to provide an up-to-date global overview of SPD research using bibliometric and science-mapping approaches, specifically characterizing the knowledge structure, identifying core contributors, deciphering international collaboration patterns, detecting emerging research hotspots, and highlighting potential directions for future investigation. The reporting of this article follows the BIBLIO checklist24.
Protocol
Data source
The Web of Science (WoS) Core Collection (provided by Clarivate Analytics) was employed as the primary data source for this study. As a widely used multidisciplinary scientific database, the WoS Core Collection has been frequently adopted as a data source for bibliometric analyses25. Records retrieved from this database can be exported in formats directly compatible with bibliometric tools such as VOSviewer. A comprehensive search strategy was applied to identify publications related to SPD. The search was conducted within the WoS Core Collection (see Table of Materials) without restricting retrieval to any specific index in order to maximize literature coverage and minimize the risk of missing potentially relevant publications.
Search strategy
To identify all potentially relevant literature, the WoS Core Collection was initially searched using the Topic field (TS) with the following search query: TS = (“pilonidal sinus” OR “pilonidal cyst” OR “pilonidal fistula” OR “pilonidal abscess” OR “pilonidal disease” OR “pilonidal tract” OR “sacrococcygeal cyst” OR “sacrococcygeal sinus” OR “sacrococcygeal fistula” OR “sacrococcygeal tract” OR “sacrococcygeal abscess” OR “sacrococcygeal pilonidal disease” OR “pilonidal cyst disease” OR “pilonidal sinus disease” OR “pilonidal fistula disease” OR “pilonidal tract disease” OR “pilonidal abscess disease” OR “jeep disease”). Two investigators (LC and WZ) independently performed the literature search on February 1, 2026, according to the predefined search strategy, with discrepancies resolved through discussion with a third investigator (YL). After the initial retrieval, predefined filters were sequentially applied for publication years (2000–2025), language (English), and document type (Article or Review). Following the initial filtering process, the remaining records underwent a second-stage screening based on title and abstract review according to the predefined eligibility criteria. As some case reports and case series may still be indexed as Article in the WoS Core Collection, these publication types were further identified during this screening process.
Eligibility criteria
Publications were considered eligible when they focused on sacrococcygeal pilonidal disease and provided relevant scientific information related to SPD, including etiology, pathophysiology, epidemiology, diagnosis, surgical or conservative management, treatment outcomes, or malignant transformation. Publications outside the predefined scope of this bibliometric analysis were considered ineligible. Case reports and case series were excluded because this study aimed to characterize publication trends, collaboration patterns, and knowledge structures at the field level, whereas individual case-based publications may be less representative of overall research development.
Study selection
The initial search of the WoS Core Collection identified 2,600 records potentially related to SPD. After applying the predefined filters, 1,354 records were retained for subsequent title and abstract review. During this process, records inconsistent with the eligibility criteria were excluded, including studies involving pilonidal disease at non-sacrococcygeal locations, cadaveric studies, and retracted publications. A final corpus of 1,014 eligible publications was included for subsequent bibliometric analysis. Full records and citations for the included publications were exported in plain-text (.txt) format for subsequent data processing and visualization. The detailed flowchart of the literature retrieval and screening process is shown in Figure 1A.
Analytical method
Bibliometric information, including titles, publication years, citation counts, keywords, authors, countries/regions, affiliations, journals, and reference lists, was obtained from the included publications and exported records. Microsoft Excel 2024 was used for data organization, tabulation, and basic summarization of bibliometric information, including annual publication counts and publication trends. The average annual growth rate was calculated as: average annual growth rate = (final number of articles / starting number of articles)^(1/n) − 1. Three analytical tools were employed for bibliometric analysis and visualization: VOSviewer (version 1.6.20)26, CiteSpace (version 6.3.R3)27, and Pajek (version 6.02)28. Before network construction, variations and duplicates among country names, institutional names, author names, journal names, and keywords were manually reviewed and standardized based on the exported WoS records and original publication information. For keyword harmonization, terms with equivalent meanings or minor formatting differences, including spelling variants, hyphenation differences, singular/plural variations, abbreviations, and closely related expressions, were merged into unified terms. The detailed keyword harmonization procedures and corresponding changes are provided in Supplementary Table 1.
VOSviewer was used to construct collaboration networks among countries, institutions, and authors, and to visualize citation networks of contributing journals and co-citation networks of cited references. Full counting and association strength normalization were applied for all VOSviewer analyses. In co-authorship networks, link strength was defined as the number of co-authored publications between two connected items, reflecting the intensity of direct collaboration. Total link strength (TLS) represents the cumulative link strength of an item with all other connected items in the network and was used to evaluate the overall collaborative intensity of countries, institutions, and authors. Network clustering was performed using the VOSviewer clustering algorithm with a resolution parameter of 1.0. Items meeting predefined minimum publication thresholds were included for visualization, with thresholds set at ≥ 10 publications for countries, ≥ 5 publications for institutions and journals, and ≥ 2 publications for authors. For cited reference visualization, references with ≥ 50 citations were included. CiteSpace was used for keyword clustering, timeline visualization, and citation burst detection of keywords and cited references. The analysis period was set from January 2000 to December 2025, with one-year intervals. Keyword and cited reference analyses were performed using a top N selection criterion of 20. Pathfinder pruning, pruning sliced networks, and pruning the merged network were applied to optimize network structures. Keyword clusters were identified using the log-likelihood ratio (LLR) algorithm. Citation burst detection was performed using CiteSpace’s default Kleinberg burst detection model with a minimum burst duration of 2 years. Finally, Pajek software was used to refine the graphical layout of VOSviewer-generated networks to enhance visualization quality and interpretability.
Results
Bibliometric analysis of global publication output
Based on a predefined search strategy and inclusion criteria, 1,014 relevant publications were retrieved from the WoS Core Collection database, originating from 255 peer-reviewed journals. These comprised 916 articles and 98 reviews, with a total of 18,036 citations and an average of 17.79 citations per publication. In total, 3,942 authors from 72 countries and 1,387 institutions contributed to publications on SPD. Figure 1B illustrates the annual and cumulative publication output in this field from 2000–2025, with publication counts rising from nine in 2000 to a peak of 87 in 2025, a nearly tenfold increase, indicating a growing research interest in this topic. A compound annual growth rate of 9.52% was calculated using the geometric mean approach. From 2018 onwards, annual publication output has increased noticeably, while cumulative output has followed a stable upward trajectory, reaching 1,014 publications by 2025, indicating a robust and persistent expansion of research output in this area.
Contributions and collaboration of countries/regions
A total of 72 countries (and regions) contributed to the field of SPD from 2000 to 2025. Table 1 shows the top 10 most productive countries ranked by publications. Among these, Turkey leads with 294 publications (28.99%), followed by the United States (114, 11.24%), England (80, 7.89%), Germany (76, 7.50%), and Italy (76, 7.50%). In terms of total citations, Turkey ranked first with 5,282 citations, with an average of 17.97 citations per publication, followed by the United States (1,996, 17.51), Germany (1,783, 23.46), England (1,548, 19.35), and Italy (1,488, 19.58). Notably, Scotland achieved an outstanding average of 66.80 citations per publication despite having only 10 publications, indicating relatively high-impact research from this country. A network visualization of 21 countries (each with at least 10 publications) was generated using VOSviewer (Figure 2A). In this network, node size reflects publication volume, line thickness indicates link strength between connected countries, and colors denote clusters of similar collaboration patterns. Despite Turkey’s leading productivity, cooperation occurred more frequently between the United States and several European countries (e.g., Germany, England, Italy, Switzerland, and the Netherlands). Regarding TLS, a measure of collaborative intensity in co-authorship networks, Germany ranked first (TLS = 46), followed by the United States (TLS = 38), England (TLS = 33), Italy (TLS = 29), and Switzerland (TLS = 29), reflecting their central position in international collaboration.
Contributions and collaboration of institutions
In this analysis, a total of 1,387 institutions were involved in research pertaining to SPD, with 68 institutions contributing five or more articles. Table 2 presents the top 10 most prolific and most collaborative institutions. Regarding publication volume, the University of Naples Federico II is the leading contributor to SPD research with 28 publications and 615 citations, followed by Technical University of Munich (17, 674) and University of Bern (15, 608). As for collaborative intensity, the University of Sheffield has the strongest inter‑institutional collaboration (TLS = 70), followed by the University of Bern (TLS = 66) and St Mark’s Hospital (TLS = 61). Notably, six of the top 10 institutions by TLS are located in England, highlighting its central role in collaborative networks. A network of key institutions and their collaborative relationships is illustrated using VOSviewer (Figure 2B).
Contributions and collaboration of authors
Overall, 3,942 authors contributed to studies on SPD in this analysis. Table 3 offers an overview of the top 10 authors ranked by publication count, total citations, and TLS. Notably, Dietrich Doll from Germany ranks highest in publication volume, total citations, and collaborative intensity during the study period (2000–2025). With respect to publication output, following Doll (48 papers), other highly prolific authors are Marco Milone (18 papers) from Italy and Markus M. Luedi (16 papers) from Switzerland. Regarding total citations, Sven Petersen (660 citations), Markus M. Luedi (620 citations), and Iain J. D. McCallum (574 citations) also demonstrate strong scholarly impact. Figure 3A depicts collaborative relationships among authors with more than one publication, where node size represents publication volume, node color denotes cluster affiliation, and line thickness reflects link strength between connected authors. Most collaborative ties are concentrated among European researchers, particularly from Germany, Italy, and England. However, among the 544 authors who published at least two articles, only 132 formed large‑scale collaborations, represented as nodes scattered across 11 clusters of different colors in the network. The network shows several core collaborative groups, whereas many authors remained isolated or belonged to smaller collaborative teams.
Analysis of contributing journals
From 2000–2025, 255 academic journals have published articles in the realm of SPD. Table 4 lists the top 10 contributing journals with the most publications. The most prolific journal is Diseases of the Colon & Rectum from the United States, ranking first with 55 papers and 2,667 citations. This journal, with an impact factor (IF) of 3.7 and a Q1 Journal Citation Reports (JCR) ranking, has consistently served as the leading journal and is ranked among the major journals in colorectal surgery. Other productive journals include Techniques in Coloproctology (42 papers, 945 citations, IF 2.9, Q1), Colorectal Disease (41 papers, 829 citations, IF 2.7, Q1), and International Journal of Colorectal Disease (34 papers, 942 citations, IF 2.3, Q2), all of which have a strong reputation in this domain. In addition, the Journal of Pediatric Surgery has a considerable number of publications (33 papers, 781 citations, IF 2.5, Q1), highlighting current attention to the pediatric population affected by this disease.
A citation network of journals (Figure 3B) was constructed using VOSviewer software, with each node representing a journal, and the link strength between two journals reflecting the number of times that one journal has cited articles from the other. Nodes with higher link strength indicate journals that are heavily cited by others and play a central role in knowledge dissemination. A total of 50 journals with at least five papers were included in this network, and the above productive journals occupied central positions and were highly interconnected with other sources. Figure 3C presents an overlay visualization of the journal citation network, where node colors indicate the average publication year of relevant articles in each journal. In this overlay map, a color gradient ranging from white to red is used, with white nodes representing journals with earlier average years. For instance, Diseases of the Colon & Rectum and American Journal of Surgery have earlier average years than 2010, highlighting their foundational significance in this research period.
Analysis of keywords
Supplementary Table 2 lists the top 30 most frequently occurring keywords in SPD research from 2000–2025. Apart from the core terms “pilonidal sinus” and “disease”, keywords such as “primary closure”, “excision”, and “surgery” also appeared prominently in the literature, highlighting the importance of surgical treatment in this condition. The CiteSpace software to generate a keyword clustering network and timeline map to identify research topics and their evolution in SPD research. The parameter settings were as follows: the time slicing was from January 2000 to December 2025 with one-year intervals per slice, and the node type was “keyword”. To simplify the network structure and concentrate on core hotspots, the selection criterion was set to the top 20 items per slice. Network pruning and clustering were performed according to the predefined CiteSpace settings. The resulting network comprised 231 nodes and 1,011 links, forming 15 clusters labeled by the log likelihood ratio (LLR) method. The modularity Q value was 0.8134, indicating a significant clustering structure ( > 0.3), and the weighted mean silhouette S value was 0.9203, suggesting reliable clustering results ( > 0.7). Figure 4A presents the keyword clustering network generated by CiteSpace, while Figure 4B shows the timeline visualization of keyword clustering results, illustrating the temporal progression of focal topics in this research area. A total of 10 major clusters were retained in the clustering network, each labeled by a cluster number (0–9) and its top LLR term, representing distinct research themes in the SPD literature. As shown in Supplementary Table 3, the largest clusters are Cluster 0 “pilonidal disease” (size = 31, S = 0.984), followed by Cluster 1 “recurrence rate” (26, 0.861), Cluster 2 “Limberg flap” (20, 0.814), and Cluster 3 “Karydakis flap” (19, 0.777). Notably, seven clusters have S values above 0.9 (Cluster 0, 4–9), indicating high internal homogeneity and strong alignment with their assigned thematic labels. Supplementary Table 4 displays all keywords and their frequency of occurrence in each cluster. In the timeline map, each horizontal line corresponds to a keyword cluster, with its color indicating the cluster identity. The nodes on each line represent individual keywords, and their positions along the line indicate the year when the keyword first appeared in the literature.
Figure 5 shows the top 25 keywords with the strongest citation bursts, which reflect the thematic evolution and research hotspots in this field. The leftmost side of the dark blue bars in the map corresponds to the year when the keyword first appeared, while the red bars represent the duration of keyword bursts. The keyword with the highest burst strength was “minimally invasive treatment” (strength 14.35, 2019–2025), followed by “risk factors” (12.60, 2019–2025) and “video-assisted ablation” (10.63, 2017–2023). Research on this topic has experienced a two-phase trajectory. In the early period (2000–2013), bursts were mainly associated with surgical techniques such as “rhomboid flap”, “y‑advancement flap”, “z‑plasty”, “transposition”, and “follicle removal”, along with the keyword “randomized trial”, suggesting that the initial focus likely centered on evaluating a variety of asymmetric closure and full‑thickness flap techniques (also referred to collectively as “flattening procedures”) through clinical trials. In the latter period (2014–2025), keywords such as “video-assisted ablation”, “crystallized phenol”, and “minimally invasive treatment” experienced strong and relatively recent bursts, indicating an evolving research focus with increasing attention toward less invasive techniques. Furthermore, the most recent and ongoing hotspots include “risk factors”, “hair”, “guidelines”, and “society”, reflecting growing interest in etiological and preventive aspects, as well as increasing attention toward evidence synthesis and guideline-related research.
Analysis of cited references
Table 5 lists the top 10 most cited publications in this analysis. The most frequently cited article is “Easy and successful treatment of pilonidal sinus after explanation of its causative process” published in ANZ Journal of Surgery by Karydakis GE in 1992. Karydakis also authored the paper “New approach to the problem of pilonidal sinus,” published in The Lancet in 1973, which is the earliest publication in this list. The second most cited article is “Patient characteristics and symptoms in chronic pilonidal sinus disease,” published in the International Journal of Colorectal Disease by Sondenaa K in 1995. Of note, although all other highly cited references were published before 2010, the article “Common surgical procedures in pilonidal sinus disease: A meta-analysis, merged data analysis, and comprehensive study on recurrence” (Scientific Reports, Stauffer VK et al, 2018) ranks seventh with 165 citations.
Figure 6A displays the top 25 references with the strongest citation bursts, where the red bars correspond to the duration of reference bursts. Among these publications, the article by Stauffer VK et al published in Scientific Reports in 2018 exhibits the highest burst strength (40.61), reflecting its influence within the field. Figure 6B presents the co-citation network visualization of cited references, comprising 83 articles that met the 50-citation threshold. In the network, nodes represent cited references, and their sizes reflect citation frequency. Connections between nodes indicate that the two references have been co‑cited by the same later publication, with thicker lines representing stronger co‑citation relationships. Node colors indicate cluster membership, with nodes sharing the same color belonging to the same thematic cluster.
DATA AVAILABILITY:
The datasets generated and analyzed during the current study are included in this article as supplementary materials. The bibliographic records used for this analysis were retrieved from the Web of Science Core Collection, and the relevant search strategy and screening process are described in the manuscript. All data necessary to reproduce the analyses and interpret the findings are provided within this article and its Supplementary Tables 1–4 and Supplementary File 1.
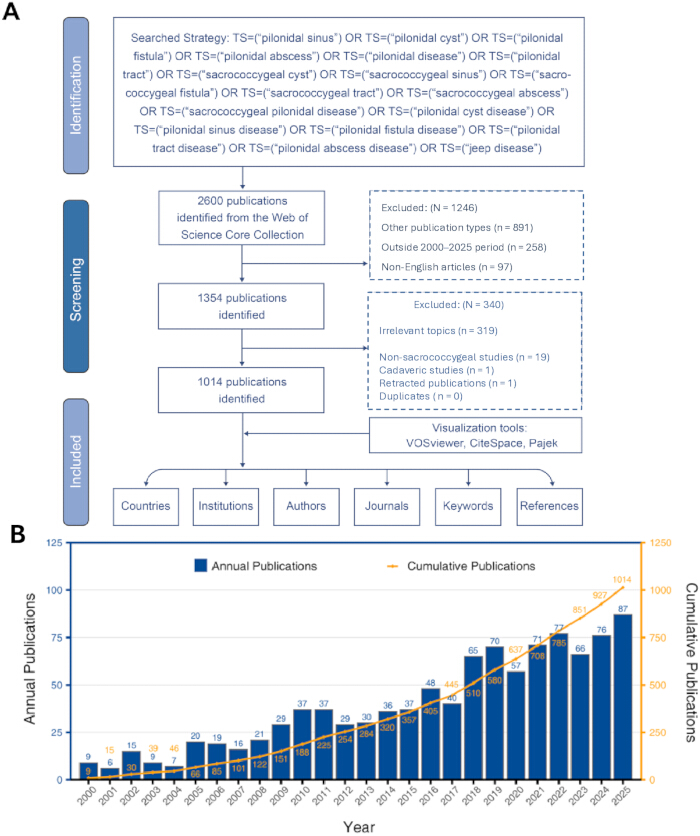
Figure 1: Study selection and publication trends. (A) Flow diagram illustrating the stepwise screening and inclusion process based on the WoS Core Collection, resulting in a final curated dataset of 1,014 original English-language publications on SPD. (B) Annual and cumulative numbers of publications on sacrococcygeal pilonidal disease between 2000 and 2025. Please click here to view a larger version of this figure.
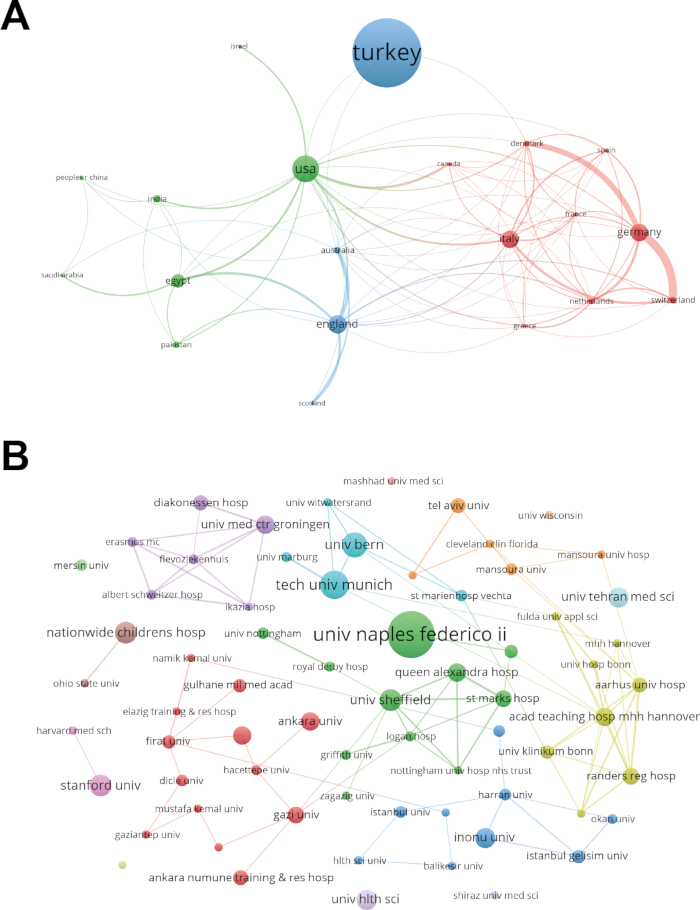
Figure 2: Network maps of the productive countries and institutions. (A) Collaborative network of countries. (B) Collaborative network of institutions. In both networks, larger nodes represent higher publication volume, node colors indicate different clusters, and thicker lines indicate stronger links between connected nodes. Please click here to view a larger version of this figure.
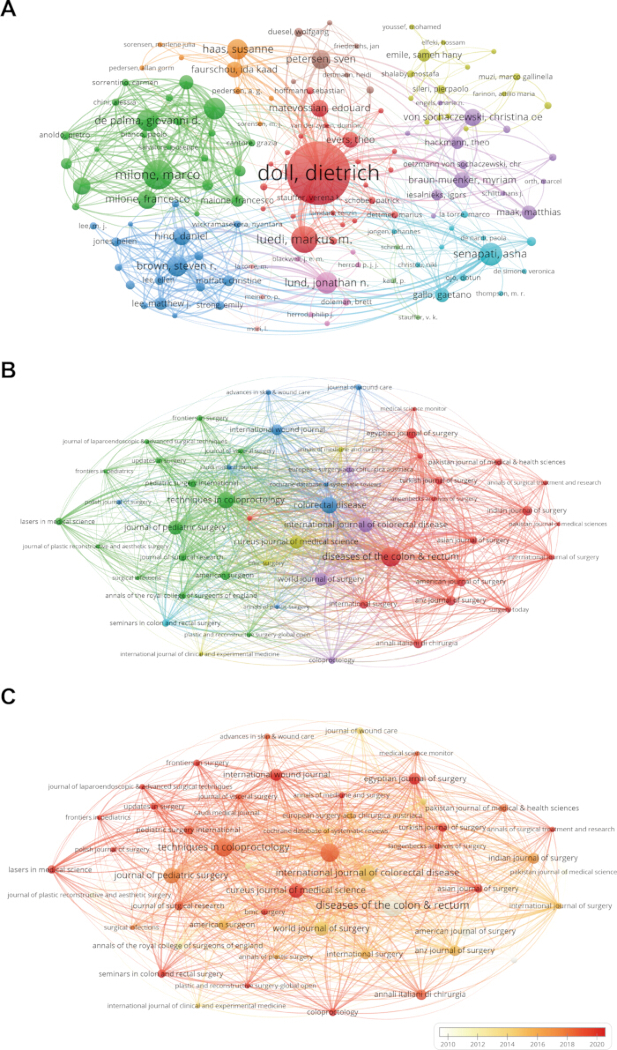
Figure 3: Network maps of prolific authors and journals. (A) Collaborative network visualization of authors. (B) Citation network visualization of contributing journals. (C) Overlay visualization of contributing journals. In (A) and (B), larger nodes represent higher publication volume, node colors indicate different clusters, and thicker lines indicate higher link strength between connected items. In (C), node colors indicate the average publication year of articles in each journal, using a gradient from white (earlier years) to red (later years). Please click here to view a larger version of this figure.
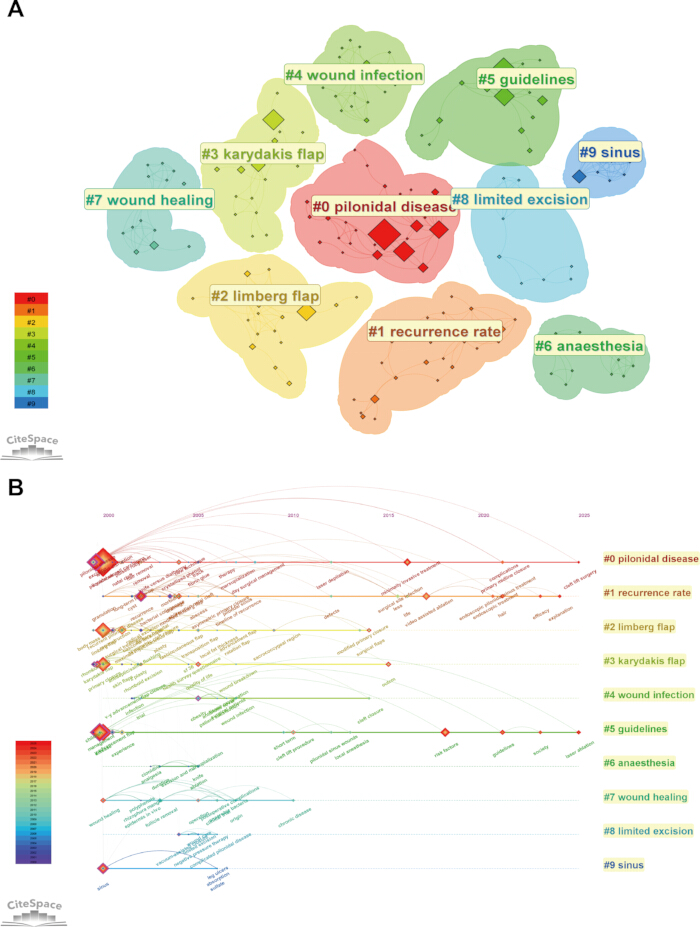
Figure 4: Keyword clustering and temporal evolution. (A) Keyword clustering network generated by CiteSpace, with clusters labeled by the log likelihood ratio (LLR) method. (B) Timeline visualization of keyword clustering analysis, showing the temporal progression of research topics from 2000–2025. Please click here to view a larger version of this figure.
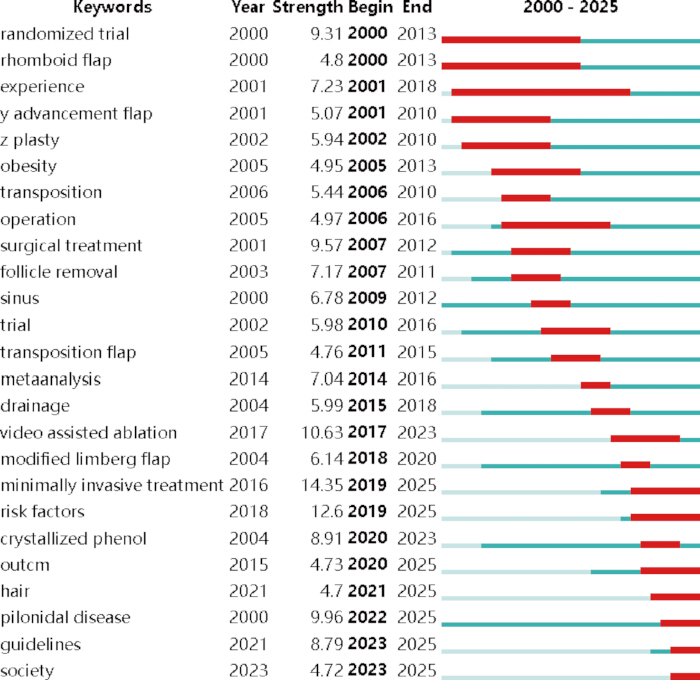
Figure 5: Top 25 keywords with the strongest citation bursts. The dark blue bars indicate the temporal distribution of each keyword, and the red bars denote burst duration. Please click here to view a larger version of this figure.
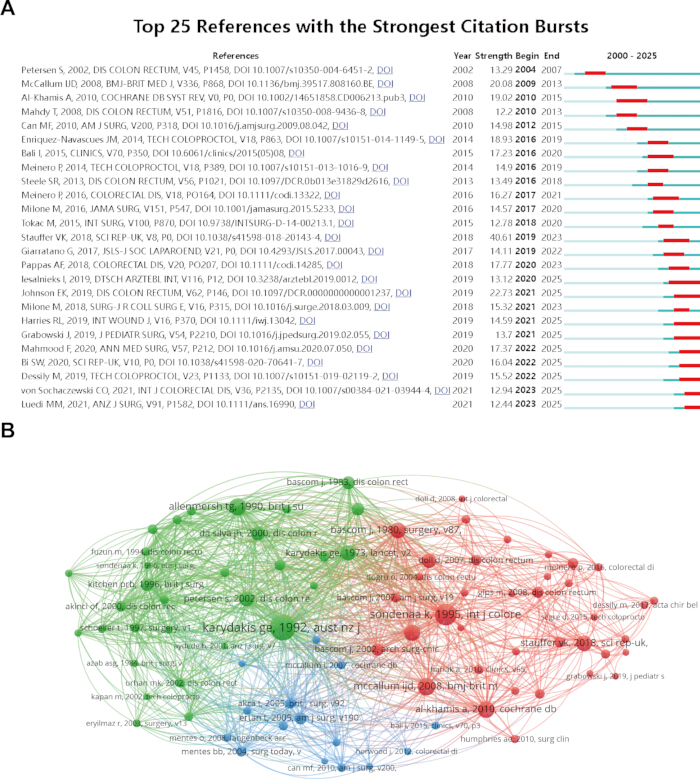
Figure 6: Visualization of references. (A) Top 25 references with the strongest citation bursts. (B) Co-citation network visualization of cited references. In this network, each node represents a cited reference; node size reflects citation frequency; line thickness denotes co‑citation strength; and colors represent thematic clusters. Please click here to view a larger version of this figure.
Table 1: Top 10 most productive countries in SPD research. This table presents country rankings by publication count, total citations, and total link strength. Abbreviations: ACPP = average citations per publication; TC = total citations; TLS = total link strength. Please click here to download this file.
Table 2: Top 10 most prolific institutions in SPD research. This table presents the top 10 institutions ranked according to total citations and total link strength, respectively. Abbreviations: TC = total citations; TLS = total link strength. Please click here to download this file.
Table 3: Top 10 highest-impact authors in SPD research. This table presents the top 10 authors ranked by publication count, total citations, and total link strength. Abbreviations: TC = total citations; TLS = total link strength. Please click here to download this file.
Table 4: Top 10 most productive journals. This table presents the top 10 journals ranked by publication count, with corresponding total citations, average citations per publication, Journal Citation Reports quartile, and impact factor. Abbreviations: ACPP = average citations per publication; IF = impact factor; JCR = Journal Citation Reports; TC = total citations. Please click here to download this file.
Table 5: Top 10 most cited references. This table presents the top 10 references ranked by citation count, including title, first author, journal, and publication year. Please click here to download this file.
Supplementary Table 1: Keywords harmonization. Keyword harmonization and standardization are applied during bibliometric data preprocessing.Please click here to download this file.
Supplementary Table 2: Keywords. The top 30 most frequently occurring keywords in SPD research from 2000 to 2025. Keywords with a greater log-likelihood ratio are more representative of the clusters. Abbreviations: LLR, log-likelihood ratio. Please click here to download this file.
Supplementary Table 3: Keyword clusters. The 10 largest keyword clusters and the top 5 label terms (by log-likelihood ratio) for each cluster.Please click here to download this file.
Supplementary Table 4: Frequency of keywords. All keywords and their frequency of occurrence in each cluster.Please click here to download this file.
Supplementary File 1: Completed BIBLIO checklist for reporting bibliometric reviews.
The checklist details the manuscript page, line, and section corresponding to each BIBLIO reporting item.Please click here to download this file.
Discussion
This comprehensive bibliometric synthesis of 1,014 publications delineates the trajectory of SPD research over the first quarter of the 21st century, revealing a field with increasing publication activity, expanding thematic diversity, and evolving research interests. This study proposes a macroscopic, quantitative framework to not only chart the expansion of scientific output but, more critically, to deconstruct the underlying intellectual architecture, collaborative dynamics, and evolving research themes that characterize modern SPD research16,22. Moving beyond descriptive statistics, this multitool bibliometric approach—integrating performance analysis, science mapping, and burst detection—provides a unique, systematic synthesis of a vast and fragmented literature. By visualizing the knowledge network, we have characterized the core contributors, the centrality of specific journals29, and the heterogeneous structure of global collaboration networks30, thereby providing a useful reference for understanding research trends and potential directions for future collaboration. This methodology, already proven effective in other anorectal fields18,19,20,21, allows for an objective assessment of research trends, providing insights into the evolution from predominantly surgical technique-focused studies toward broader investigations incorporating prevention, evidence synthesis, and patient-centered outcomes1,31.
The findings reveal substantial thematic evolution, with increasing research attention directed toward minimally invasive techniques and etiological prevention, alongside continued investigation of conventional surgical approaches. The keyword clustering and burst detection analyses provide evidence of changing research priorities in this field1,2,14, with sustained high-intensity bursts for terms like “minimally invasive treatment” and “video-assisted ablation” in recent years. The emergence of these less invasive approaches may reflect growing interest in reducing treatment burden and improving patient-centered outcomes14,30,31. However, the bibliometric findings primarily indicate shifts in research priorities rather than definitive evidence of clinical superiority among available surgical techniques. Simultaneously, the surge of keywords such as “risk factors”, “hair”, and “guidelines” indicates a maturing research landscape that increasingly explores etiological factors, such as the role of hair insertion in disease development32,33, while reflecting increasing attention toward evidence synthesis and future guideline development4,34. This thematic diversification indicates that SPD research is increasingly extending beyond operative techniques to incorporate etiological, preventive, and evidence synthesis perspectives.
The analysis reveals variation in international collaboration patterns within the SPD research landscape, highlighting opportunities for strengthening international connectivity within the SPD research community. While Turkey dominates in publication volume16, international collaboration patterns varied substantially across countries, with several Western European countries demonstrating stronger cross-border collaborative links. These differences highlight the heterogeneous structure of global collaboration networks in SPD research. This uneven distribution of collaboration networks underscores the potential benefits of broader multinational cooperation for future evidence generation30. Previous methodological analyses have reported that the field remains reliant on single-center, retrospective cohorts and meta-analyses of heterogeneous data, with a concerning declining proportion of randomized controlled trials (RCTs)23. Future research may benefit from greater international collaboration and well-designed prospective studies capable of comparing different surgical approaches across diverse populations and healthcare settings34.
The potential implications of these findings are twofold: they provide researchers and clinicians with a structured overview of the current SPD research landscape and may help identify knowledge gaps, emerging themes, and potential areas for future investigation. The identification of core journals29 and influential authors may also help researchers recognize established knowledge contributors and potential collaborative networks within the field. For researchers and scientific organizations, the emergence of burst keywords such as “guidelines” and “society” highlights areas of growing research interest and suggests potential directions for future investigation, including evidence synthesis and multicenter studies11,34. Future research directions may benefit from moving beyond descriptive surgical series toward hypothesis-driven collaborative studies. Potential priorities suggested by the current literature landscape include: (1) conducting well-powered RCTs comparing the most promising minimally invasive techniques against established off-midline flap procedures, using recurrence at 5–10 years as the primary endpoint34; (2) developing and validating standardized, patient-reported outcome measures that capture the full impact of treatment on quality of life and psychosocial well-being, particularly in adolescent populations1,8; and (3) exploring the role of prophylactic interventions, such as laser hair removal, in high-risk populations through robust, long-term cohort studies to assess their cost-effectiveness in preventing primary and recurrent disease.
Methodological limitations of this synthesis must be acknowledged to contextualize these findings. First, reliance on a single database (WoS Core Collection) and the restriction to English-language publications may have inadvertently excluded significant research published in other major scientific databases or in languages other than English. Second, as with all bibliometric analyses, citation metrics are influenced by the natural accumulation of citations over time, which inherently favors older publications and may not fully capture the contemporary impact of recent innovations. Finally, citation counts and publication frequency are surrogate markers of scientific attention and activity, not direct measures of methodological rigor or clinical utility. Future studies could mitigate these limitations by incorporating multiple databases and using altmetrics to capture broader societal and clinical impact, thereby complementing the traditional citation-based analysis to provide a more holistic view of the field’s evolution.
This bibliometric analysis of 1,014 publications provides a comprehensive, systematic overview of sacrococcygeal pilonidal disease research from 2000 to 2025, mapping the global landscape, collaborative networks, thematic evolution, and emerging frontiers. The field has experienced a marked and sustained increase in research output, with Turkey emerging as the most productive country, while Germany, England, and the United States demonstrated relatively prominent roles in international collaboration networks. Professor Dietrich Doll stands out as the most productive and highly cited researcher in the field. Thematic evolution reveals an increasing research emphasis on minimally invasive techniques alongside continued investigation of conventional surgical approaches, with recurrence remaining a central outcome measure in the literature. Emerging research themes—highlighted by burst keywords including “minimally invasive treatment”, “risk factors”, “hair”, and “guidelines”— point toward growing interest in less invasive strategies, etiological prevention, and evidence synthesis. By integrating global productivity patterns, collaborative structures, and thematic evolution, this study provides a quantitative reference framework for identifying knowledge gaps, emerging research priorities, and potential collaborative opportunities in SPD research.
Disclosures
The authors declare that they have no competing interests. Artificial intelligence tools were not used for data collection, data analysis, interpretation of results, or figure preparation. ChatGPT (OpenAI) was used only for language editing and manuscript refinement.
Acknowledgements
The authors have no acknowledgments to declare.
Materials
| Name | Company | Catalog Number | Comments |
|---|---|---|---|
| CiteSpace | Drexel University | version 6.3.R3 | https://citespace.podia.com/ |
| Microsoft Excel | Microsoft Corporation | version 2024 | https://www.microsoft.com/microsoft-365/excel |
| Pajek | University of Ljubljana | version 6.02 | https://mrvar.fdv.uni-lj.si/pajek/ |
| VOSviewer | Leiden University | version 1.6.20 | https://www.vosviewer.com/ |
| Web of Science Core Collection | Clarivate | N/A | https://www.webofscience.com/ |
References
- Gil LA, Deans KJ, Minneci PC. Management of Pilonidal Disease: A Review. JAMA Surg. 2023;158(8):875-883.
- Di Castro A, Guerra F, Levi Sandri GB, Ettorre GM. Minimally invasive surgery for the treatment of pilonidal disease. The Gips procedure on 2347 patients. Int J Surg. 2016;36(Pt A):201-205.
- McCallum IJ, King PM, Bruce J. Healing by primary closure versus open healing after surgery for pilonidal sinus: systematic review and meta-analysis. BMJ. 2008;336(7649):868-871.
- Wiinblad IM, Ulrichsen J, Brandstrup B. Outcome After Surgical Treatment for Chronic Pilonidal Sinus Disease: A Systematic Review of Common Surgical Techniques. Dis Colon Rectum. 2025;68(5):515-529.
- Oetzmann von Sochaczewski C, Gödeke J. Pilonidal sinus disease on the rise: a one-third incidence increase in inpatients in 13 years with substantial regional variation in Germany. Int J Colorectal Dis. 2021;36(10):2135-2145.
- Faurschou IK, Erichsen R, Doll D, Haas S. Time trends in incidence of pilonidal sinus disease from 1996 to 2021: A Danish population-based cohort study. Colorectal Dis. 2024;27(1):e17227.
- Brown SR et al. Real-world practice and outcomes in pilonidal surgery: Pilonidal Sinus Treatment Studying The Options (PITSTOP) cohort. Br J Surg. 2024;111(3):znae009.
- Salimi-Jazi F et al. Burden of pilonidal disease and improvement in quality of life after treatment in adolescents. Pediatr Surg Int. 2022;38(10):1453-1459.
- Calikoglu I et al. Phenol Injection Versus Excision With Open Healing in Pilonidal Disease: A Prospective Randomized Trial. Dis Colon Rectum. 2017;60(2):161-169.
- Walker H, Hamid O, Ramirez J, Glancy D. Diagnosis and management of sacrococcygeal pilonidal disease in primary care. BMJ. 2023;382:e071511.
- Johnson EK, Vogel JD, Cowan ML, Feingold DL, Steele SR. Clinical Practice Guidelines Committee of the American Society of Colon and Rectal Surgeons. The American Society of Colon and Rectal Surgeons’ Clinical Practice Guidelines for the Management of Pilonidal Disease. Dis Colon Rectum. 2019;62(2):146-157.
- Vartanian E, Gould DJ, Lee SW, Patel KM. Pilonidal Disease: Classic and Contemporary Concepts for Surgical Management. Ann Plast Surg. 2018;81(6):e12-e19.
- Al-Khamis A, McCallum I, King PM, Bruce J. Healing by primary versus secondary intention after surgical treatment for pilonidal sinus. Cochrane Database Syst Rev. 2010;2010(1):CD006213.
- Tien T, Athem R, Arulampalam T. Outcomes of endoscopic pilonidal sinus treatment (EPSiT): a systematic review. Tech Coloproctol. 2018;22(5):325-331.
- Kumar M, Clay WH, Lee MJ, Brown SR, Hind D. A mapping review of sacrococcygeal pilonidal sinus disease. Tech Coloproctol. 2021;25(6):675-682.
- Doll D, Stauffer V, Diekann M, Van Wyk P, Luedi MM. Turkey is leading in the 21st century pilonidal sinus disease research. Turk J Surg. 2020;36(3):284-290.
- Dhole S, Mahakalkar C. Advancements and Innovations in the Surgical Management of Sacrococcygeal Pilonidal Sinus: A Comprehensive Review. Cureus. 2024;16(5):e61141.
- Chen X. Global knowledge mapping and technological evolution in hemorrhoid therapy: a multi-tool bibliometric analysis. Updates Surg. 2025. doi:10.1007/s13304-025-02460-2.
- Wang Z et al. Top 100 most-cited articles on hemorrhoids: A bibliometric analysis and visualized study. Front Surg. 2022;9:1021534.
- Chen Q, Li Y, Wang X, Li H. Hot topics in global perianal fistula research: A SCOPUS-based bibliometric analysis. Medicine (Baltimore). 2020;99(17):e19659.
- Feng L, Wang M, Li X, Yang Q. A bibliometric analysis of surgical treatment for rectal prolapse. Medicine (Baltimore). 2025;104(32):e43763.
- Şahin A, Şimşek G. The One Hundred Most Cited Articles from Turkey about Pilonidal Disease: A Bibliometric Study. Turk J Colorectal Dis. 2022;32:123-133.
- Doll D et al. One century of pilonidal sinus research: trends in study size and the declining share of randomized controlled trials. Coloproctology. 2025;47:353-359.
- Montazeri A et al. Preliminary guideline for reporting bibliometric reviews of the biomedical literature (BIBLIO): a minimum requirements. Systematic Reviews. 2023;12(1):239.
- Thelwall M. Bibliometrics to webometrics. J Inf Sci. 2008;34(4):605-621.
- van Eck NJ, Waltman L. Software survey: VOSviewer, a computer program for bibliometric mapping. Scientometrics. 2010;84(2):523-538.
- Chen C. Searching for intellectual turning points: progressive knowledge domain visualization. Proc Natl Acad Sci U S A. 2004;101 Suppl 1(Suppl 1):5303-5310.
- Mrvar A, Batagelj V. Analysis and visualization of large networks with program package Pajek. Complex Adapt Syst Model. 2016;4:6.
- Becerra AZ et al. A New Bibliometric Index: The Top 100 Most Disruptive and Developmental Publications in Colorectal Surgery Journals. Dis Colon Rectum. 2022;65(3):429-443.
- Wagner CS, Leydesdorff L. Network structure, self-organization, and the growth of international collaboration in science. Res Policy. 2005;34(10):1608-1618.
- Esposito C et al. Quality of life of pediatric patients operated for pilonidal sinus disease. Eur J Pediatr. 2023;182(1):25-30.
- Halleran DR et al. Recurrence of Pilonidal Disease: Our Best is Not Good Enough. J Surg Res. 2018;232:430-436.
- Karydakis GE. Easy and successful treatment of pilonidal sinus after explanation of its causative process. Aust N Z J Surg. 1992;62(5):385-389.
- Stauffer VK et al. Common surgical procedures in pilonidal sinus disease: A meta-analysis, merged data analysis, and comprehensive study on recurrence. Sci Rep. 2018;8(1):3058.