This protocol compares septal region-of-interest (ROI) and whole-myocardium contouring methods for myocardial T1 measurement in patients with metabolic syndrome. The septal ROI method showed no statistically significant difference in prognostic performance compared with whole-myocardium contouring while requiring less extensive image analysis.
Method Article
Comparison of Septal Region-of-Interest and Whole-Myocardium Contouring Methods for Myocardial T1 Measurement in Metabolic Syndrome
* These authors contributed equally
In This Article
Summary
Abstract
Metabolic syndrome (MetS) is a global public health challenge associated with an increased risk of cardiovascular disease and all-cause mortality. Cardiac magnetic resonance (CMR) T1 mapping enables non-invasive quantitative assessment of myocardial tissue characteristics and facilitates detection of diffuse myocardial remodeling in MetS. However, whether T1 quantification in patients with focal late gadolinium enhancement (LGE) should exclude scar regions remains controversial. This study compared T1 values obtained using a septal region-of-interest (ROI) method that avoids LGE lesions with those obtained using conventional whole-myocardium contouring and evaluated their predictive performance for major adverse cardiovascular events (MACE). A retrospective cohort of 207 patients with MetS who underwent 3.0 T CMR, including T1 mapping and LGE imaging, was evaluated. Native and post-contrast T1 values were measured using the septal ROI method and semi-automated whole-myocardium contouring. Paired t-tests were used to compare measurements, receiver operating characteristic curves were used to evaluate MACE prediction, and intraclass correlation coefficients (ICCs) were used to assess reliability. Native T1 values did not differ significantly between methods (1253.07 ± 218.27 ms vs. 1255.79 ± 261.29 ms, p = 0.748), nor did post-contrast T1 values (270.28 ± 48.66 ms vs. 271.67 ± 55.63 ms, p = 0.469). Both methods showed predictive value for MACE, with no significant difference in predictive performance. Inter-method ICCs were 0.873 and 0.860 for native and post-contrast T1, respectively, and inter- and intra-observer ICCs exceeded 0.93. The septal ROI method yielded T1 measurements similar at the group level to those obtained with whole-myocardium contouring, with no statistically significant difference in prognostic performance, while requiring less extensive image analysis.
Introduction
Metabolic syndrome (MetS) is a clinical condition characterized by central obesity, insulin resistance, hypertension, and dyslipidemia. Worldwide, the prevalence of MetS is approximately 20%–25% and continues to rise1. In China, the prevalence exceeds 33% among adults, representing a major public health burden2. MetS increases the risk of cardiovascular disease by two- to three-fold and significantly elevates all-cause mortality3. Diffuse myocardial fibrosis is recognized as an important pathological basis for cardiac functional deterioration and adverse prognosis in MetS4; therefore, early and accurate assessment of myocardial tissue characteristics is important for risk stratification and clinical decision-making.
MetS-related adverse cardiac remodeling includes diastolic dysfunction, left ventricular hypertrophy, and interstitial fibrosis, which can occur before overt coronary artery disease develops5. Multimodality imaging plays an increasingly important role in MetS assessment, with cardiac magnetic resonance (CMR) serving as a key modality for evaluating cardiac structure, function, and tissue characteristics6. In patients with MetS, diffuse myocardial fibrosis is associated with adverse cardiac outcomes, while myocardial fibrosis and hypertrophy have also been associated with mortality in heart failure with preserved ejection fraction7. CMR T1 mapping enables non-invasive assessment of diffuse myocardial fibrosis and complements conventional late gadolinium enhancement (LGE), which primarily identifies focal lesions.
CMR T1 mapping enables quantification of T1 values and extracellular volume (ECV), providing a sensitive assessment of diffuse myocardial fibrosis8 with histological validation9. Normal reference ranges for myocardial native T1 values have been investigated across different populations and clinical settings10⁻12. Unlike LGE, which primarily identifies focal scar, T1 mapping can quantitatively assess diffuse myocardial disease in LGE-negative regions8˒13. The Society for Cardiovascular Magnetic Resonance (SCMR) consensus recommends T1 mapping as a core CMR technique8, and T1 mapping and related CMR parameters have been applied for myocardial tissue characterization and prognostic assessment in different cardiovascular conditions14⁻17.
In clinical practice, whole-myocardium T1 quantification typically relies on semi-automated contouring and may require more extensive image analysis. Different CMR measurement approaches have been evaluated in previous studies18. For LGE-positive patients, whether whole-myocardium contouring should exclude scar regions remains unclear19. Cardiovascular risk factors have also been associated with myocardial fibrosis and early cardiac dysfunction in type 2 diabetes, with T1 mapping enabling early detection20. The septal region-of-interest (ROI) method samples the mid-septal region and offers a simpler approach with reported reproducibility21. ECV and native T1 have demonstrated prognostic value in non-ischemic cardiomyopathy22˒23, while the extent of LGE has also been associated with major adverse cardiovascular outcomes24. Regional myocardial T1 values may also vary with technical and demographic factors25. However, a systematic comparison of septal ROI and whole-myocardium contouring for T1 measurement and major adverse cardiovascular event (MACE) prediction in patients with MetS remains limited.
This study aimed to compare native and post-contrast T1 values obtained using the septal ROI method, while avoiding LGE lesions, with those obtained using conventional whole-myocardium contouring in patients with MetS. It also evaluated the predictive performance of the resulting T1 parameters for MACE using receiver operating characteristic (ROC) analysis, thereby providing methodological evidence for clinical application.
Protocol
Ethical approval for this study was obtained from the Ethics Committees of The First Affiliated Hospital of Chengdu Medical College (approval no. 2025CYFYIRB-BA-057) and Sichuan Provincial People’s Hospital (approval no. 2024-693), from which the retrospective patient data were collected, and of West China Longquan Hospital, Sichuan University (The First People’s Hospital of Longquanyi District, Chengdu) (approval no. 2025-0119), which served as the leading institution. A waiver of informed consent was granted for the retrospective use of patient data. The study protocol adhered to the ethical principles of the Declaration of Helsinki. The tools used in this protocol are listed in the Table of Materials.
1. Patient selection
- Apply the following inclusion criteria.
- Include patients diagnosed with metabolic syndrome (MetS).
NOTE: A total of 207 patients with MetS who underwent 3.0 T cardiac magnetic resonance (CMR) imaging between January 2018 and December 2024 at The First Affiliated Hospital of Chengdu Medical College and Sichuan Provincial People's Hospital were retrospectively enrolled. MetS was diagnosed according to the International Diabetes Federation (IDF) criteria as the presence of at least three of the following five components: central obesity, defined as waist circumference ≥90 cm in men or ≥80 cm in women; triglycerides ≥1.7 mmol/L or lipid-lowering treatment; high-density lipoprotein cholesterol (HDL-C) < 1.0 mmol/L in men or < 1.3 mmol/L in women; blood pressure ≥130/85 mmHg or antihypertensive treatment; and fasting glucose ≥ 5.6 mmol/L or glucose-lowering treatment. - Include patients who completed a 3.0 T CMR examination comprising T1 mapping and late gadolinium enhancement (LGE) sequences.
- Include patients diagnosed with metabolic syndrome (MetS).
- Exclude patients with severe valvular disease, congenital heart disease, myocarditis, cardiomyopathy, including hypertrophic, dilated, or restrictive cardiomyopathy, or CMR image quality unsuitable for analysis.
2. CMR imaging protocol and scanning parameters
- Scanner configuration
- Perform the examination using a 3.0 T MRI scanner equipped with a cardiac phased-array coil. Position the patient supine.
- Perform pre-scan quality assurance. Set the shim tolerance to ≤5 ppb, signal-to-noise ratio (SNR) to ≥100 using a phantom, and B0 homogeneity to ≤0.5 ppm.
- Scanning protocol
- Access the cardiac imaging protocol using the following console sequence: Console > Protocol Manager > Cardiac > cardiac_easy > Cine_bSSFP.
- Acquire transverse scout views from the aortic arch to the diaphragm, coronal scout views from the pulmonary trunk to the left ventricular (LV) apex, and sagittal scout views from the right ventricle to the descending aorta.
- Electrocardiography gating
- Apply three-lead vector electrocardiography (ECG) with adaptive filtering. Synchronize the respiratory bellows at mid-expiration.
- Select the Adaptive trigger and set the trigger window to 15% to accommodate arrhythmia.
- Cardiac phases and temporal resolution
- Acquire 30 cardiac phases with a temporal resolution of 45 ms and 13 k-space segments for full-cycle coverage.
NOTE: For short-axis imaging, use TR/TE = 2.86/1.31 ms, flip angle = 60°, bandwidth = 1000 Hz/pixel, matrix size = 128 × 224, FOV (read/phase) = 360/320 mm, slice thickness = 8 mm, and 6–12 contiguous short-axis slices. Use breath-hold respiratory control with a single breath-hold duration of 12–15 s. For four-chamber imaging, use TR/TE = 2.86/1.31 ms, flip angle = 55°, bandwidth = 1000 Hz/pixel, matrix size = 128 × 224, FOV (read/phase) = 360/320 mm, slice thickness = 8 mm, and 1–3 slices. Use breath-hold respiratory control with a single breath-hold duration of 10–12 s.
- Acquire 30 cardiac phases with a temporal resolution of 45 ms and 13 k-space segments for full-cycle coverage.
- Parallel imaging
- Enable ARC parallel imaging with an acceleration factor of 2 and perform auto-calibration without a separate reference scan.
NOTE: Perform the coil check and auto-calibration before scanning in accordance with the applicable cardiovascular magnetic resonance safety guidance26.
- Enable ARC parallel imaging with an acceleration factor of 2 and perform auto-calibration without a separate reference scan.
3. LGE acquisition
- Administer gadopentetate dimeglumine at 0.2 mL/kg through the antecubital vein at an injection rate of 0.1 mL/s. Acquire LGE images using a phase-sensitive inversion recovery (PSIR) gradient-echo sequence 10 min after contrast administration.
- Set the LGE acquisition parameters as follows: TR/TE ≈ 5.26/2.16 ms, flip angle = 25°, individually determined inversion time (TI; typically 250–350 ms), matrix size = 256 × 192, FOV = 360 × 320 mm, and slice thickness = 8 mm.
- Record the presence or absence of LGE and the number of LGE-positive segments.
4. T1 mapping acquisition
- Acquire T1 mapping images using Modified Look-Locker Inversion Recovery (MOLLI) acquisition schemes of 5(3)3 and 4(1)3(1)2.
- Acquire native pre-contrast T1 mapping images at the basal, mid-ventricular, and apical short-axis levels before contrast administration. Match the slice positions to the cine and LGE images.
- Set the T1 mapping parameters as follows: TR/TE = 2.8/1.28 ms, flip angle = 35°, TI = 190 ms, bandwidth = 1000 Hz/pixel, matrix size = 256 (read) × 70 (phase), and FOV (read/phase) = 360/320 mm. Acquire the images using an ECG-gated breath-hold technique.
- After contrast administration, acquire post-contrast T1 mapping images during the same examination session at the same three short-axis slice positions.
NOTE: Complete native T1 mapping before contrast administration. Perform post-contrast T1 mapping after contrast administration during the same examination session.
5. Safety and precautions
- Screen patients for implanted metal devices and assess renal function before gadolinium administration. Confirm an estimated glomerular filtration rate (eGFR) >30 mL/min/1.73 m2.
- Follow the applicable European MR contrast safety guidelines for gadolinium administration27. Record the contrast agent type, dose, and injection rate.
- Monitor ECG and respiration throughout the examination. If arrhythmia degrades image quality, extend the trigger window or adjust ECG gating as required.
6. Image analysis and T1 measurement
NOTE: Image analysis and quantitative T1 measurements were independently performed by two radiologists with more than 5 years of experience in cardiac magnetic resonance imaging using post-processing software.
- Randomly select imaging data from 30 patients for intra-observer and inter-observer reproducibility analysis.
- Have one observer perform two independent measurements at an interval of at least 2 weeks.
- Have the second observer perform one independent measurement.
- Calculate the intraclass correlation coefficient [ICC(2,1)] to assess intra-observer and inter-observer agreement.
- Method A: Septal ROI method
- At the mid-ventricular short-axis level, manually draw a region of interest (ROI) within the interventricular septum. Avoid LGE-positive areas, the blood pool, and epicardial fat.
- Maintain the ROI area between 150 and 250 mm2. Measure native septal T1 (T1_native_septal) and post-contrast septal T1 (T1_post_septal) (Figure 1).
- Method B: Whole-myocardium contouring method
- Use semi-automated software to delineate the endocardial and epicardial borders on all short-axis slices, covering the entire myocardium, including LGE-positive regions.
- Calibrate the contours with reference to the LGE images to ensure accurate delineation. Record global native T1 (T1_native_global) and global post-contrast T1 (T1_post_global) values (Figure 2).
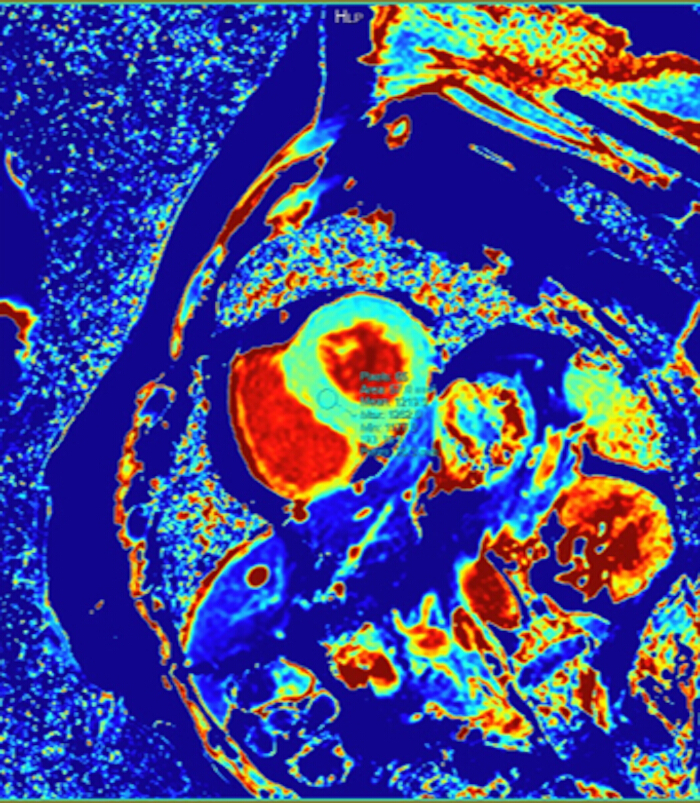
Figure 1: Method A: septal region-of-interest method. Manual placement of a region of interest (ROI) in the interventricular septum on a short-axis T1 mapping image while avoiding areas of focal late gadolinium enhancement (LGE). Please click here to view a larger version of this figure.
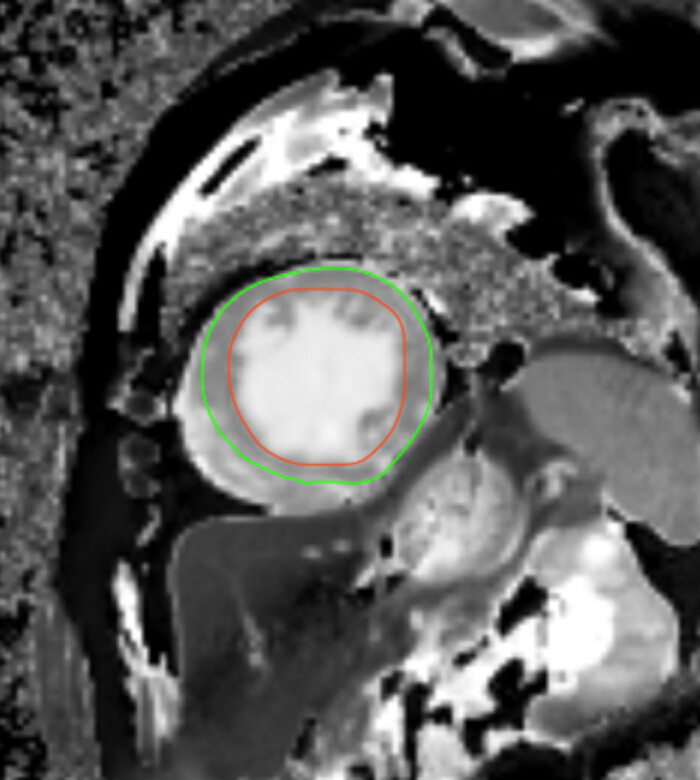
Figure 2: Method B: whole-myocardium contouring method. Semi-automated delineation of the endocardial and epicardial borders on a short-axis T1 mapping image, covering the entire myocardium, including LGE-positive regions. Please click here to view a larger version of this figure.
7. Clinical data, follow-up, and clinical endpoints
- Collect demographic and clinical data, including sex, age, height, weight, heart rate, ejection fraction, history of hypertension, diabetes mellitus, total cholesterol, triglycerides, and other laboratory parameters.
- Conduct follow-up through outpatient visits, telephone interviews, and review of inpatient medical records. The median follow-up duration was 21.4 months (interquartile range, 9.6–41.1 months; range, 2.1–71.2 months).
- Define major adverse cardiovascular events (MACE) as the primary endpoint, comprising cardiovascular death, non-fatal myocardial infarction, hospitalization for heart failure, and malignant ventricular arrhythmia.
8. Statistical analysis
- Perform statistical analyses using Python. Express continuous variables as mean ± standard deviation (x̄ ± s) or median and interquartile range (IQR), as appropriate. Express categorical variables as frequencies and percentages.
- Assess data normality using the Shapiro–Wilk test. Compare normally distributed paired measurements between Method A and Method B using the paired Student's t-test.
- Evaluate inter-method agreement using the intraclass correlation coefficient with a two-way random-effects, absolute-agreement model. Consider ICC > 0.75 to indicate good agreement. Generate Bland–Altman plots to assess systematic bias.
- Perform receiver operating characteristic (ROC) curve analysis to evaluate the predictive value of T1 parameters from both methods for MACE. Calculate the area under the curve (AUC), sensitivity, specificity, and Youden index. Compare AUCs between methods using the DeLong test. Consider a two-sided P value < 0.05 statistically significant. Because multiple ROC analyses and two inter-method DeLong comparisons were performed, these analyses were considered exploratory; a Bonferroni-corrected significance threshold (α = 0.025) for the two pre-specified inter-method comparisons did not change the conclusions.
Results
Table 1 presents the baseline clinical characteristics and comparisons of T1 parameters between the MACE and non-MACE groups. The MACE group was significantly older and had a higher proportion of males, higher body mass index (BMI), and higher triglyceride levels (all P < 0.05). Native and post-contrast T1 values measured using both methods were significantly higher in the MACE group (all P < 0.001).
Table 2 presents the paired t-test comparison of T1 values between Method A (septal ROI) and Method B (whole-myocardium contouring). No significant differences were observed for native T1 (1253.07 ± 218.27 ms vs. 1255.79 ± 261.29 ms; mean difference = −2.72 ms; P = 0.748) or post-contrast T1 (270.28 ± 48.66 ms vs. 271.67 ± 55.63 ms; mean difference = −1.39 ms; P = 0.469).
Table 3 presents the inter-method reliability assessed using the intraclass correlation coefficient (ICC) and Bland–Altman analysis. Good agreement was observed, with an ICC of 0.873 (95% CI: 0.818–0.912) for native T1 and 0.860 (95% CI: 0.801–0.903) for post-contrast T1. Bland–Altman analysis showed biases of −2.72 ms (95% limits of agreement [LoA]: −241.06 –235.62 ms) and −1.39 ms (95% LoA: −55.60 –52.81 ms), respectively (Figure 3).
Receiver operating characteristic (ROC) curve analysis (Table 4) showed predictive value for MACE with both methods. For native T1, Method A yielded an area under the curve (AUC) of 0.766 (95% CI: 0.703–0.823; cutoff = 1235.1 ms; sensitivity = 76.9%; specificity = 67.7%), while Method B yielded an AUC of 0.722 (95% CI: 0.653–0.785; cutoff = 1298.5 ms; sensitivity = 67.3%; specificity = 71.0%). For post-contrast T1, Method A yielded an AUC of 0.736 (95% CI: 0.669–0.797), and Method B yielded an AUC of 0.706 (95% CI: 0.636–0.771). The DeLong test showed no significant difference between methods for native T1 (P = 0.059) or post-contrast T1 (P = 0.149) (Figure 4).
Table 5 presents the intra-observer and inter-observer reliability results. Intra-observer ICC values ranged from 0.931 – 0.958, while inter-observer ICC values ranged from 0.933–0.966, indicating excellent agreement across all four parameters. Bland–Altman analysis showed small measurement biases across the comparisons (Figure 5).
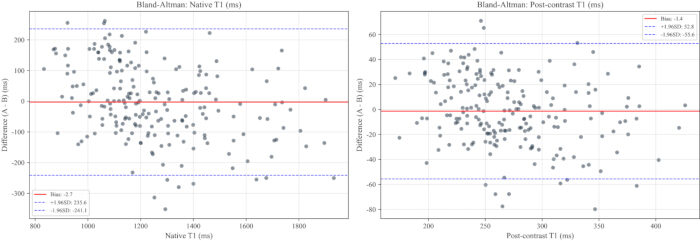
Figure 3: Bland–Altman plots of T1 measurements between methods (n = 207). (A) Native T1 values, with a bias of −2.72 ms and 95% limits of agreement (LoA) of −241.06 –235.62 ms. (B) Post-contrast T1 values, with a bias of −1.39 ms and 95% LoA of −55.60 – 52.81 ms. Solid lines represent the mean bias, and dashed lines represent the 95% LoA. Please click here to view a larger version of this figure.
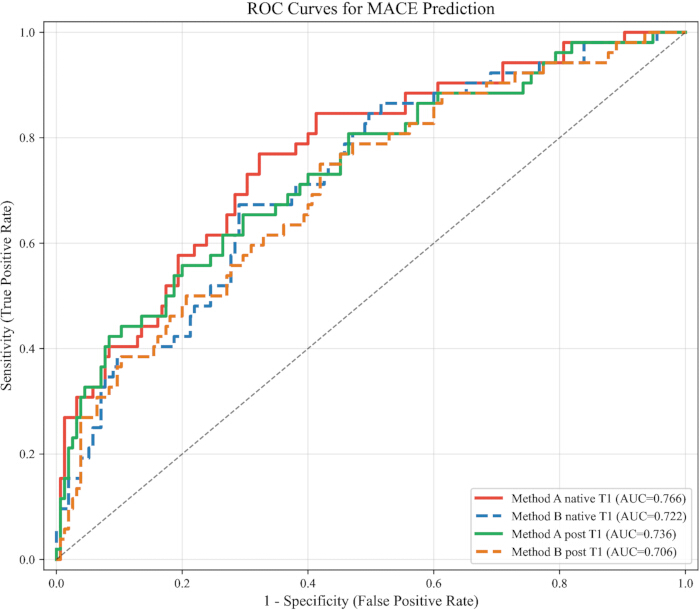
Figure 4: Receiver operating characteristic curves of T1 parameters for predicting major adverse cardiovascular events. Curves show the predictive performance of native and post-contrast T1 measurements obtained using Method A and Method B. The area under the curve (AUC) was 0.766 for Method A native T1, 0.722 for Method B native T1, 0.736 for Method A post-contrast T1, and 0.706 for Method B post-contrast T1. Please click here to view a larger version of this figure.
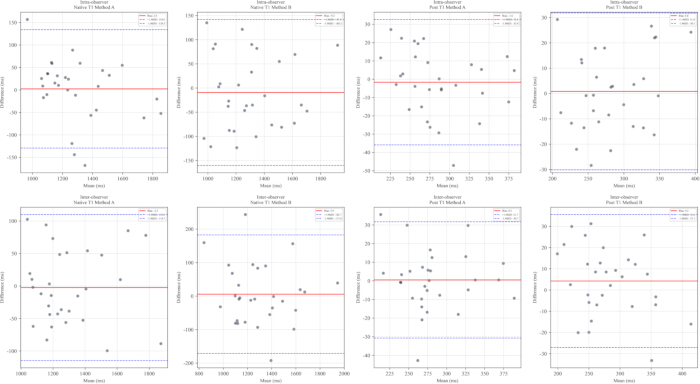
Figure 5: Bland–Altman plots of intra-observer and inter-observer measurements. (A–D) Intra-observer comparisons for native T1 Method A, native T1 Method B, post-contrast T1 Method A, and post-contrast T1 Method B, respectively. (E–H) Corresponding inter-observer comparisons. Solid lines represent the mean bias, and dashed lines represent the 95% limits of agreement. Please click here to view a larger version of this figure.
| Parameter | Total (n = 207) | Non-MACE (n = 155) | MACE (n = 52) | P value |
| Age (years) | 55.14 ± 15.58 | 53.14 ± 15.82 | 61.10 ± 13.28 | 0.001 |
| Male, n (%) | 139 (67.1) | 92 (59.4) | 47 (90.4) | <0.001 |
| BMI (kg/m²) | 24.73 ± 3.29 | 24.36 ± 3.10 | 25.82 ± 3.63 | 0.005 |
| SBP (mmHg) | 132.87 ± 21.17 | 131.97 ± 20.65 | 135.56 ± 22.65 | 0.292 |
| DBP (mmHg) | 82.19 ± 16.24 | 82.84 ± 15.95 | 80.27 ± 17.10 | 0.325 |
| FBG (mg/dL) | 173.41 ± 44.67 | 167.99 ± 39.38 | 189.57 ± 54.97 | 0.011 |
| HbA1c (%) | 6.50 ± 1.43 | 6.37 ± 1.51 | 6.90 ± 1.09 | 0.019 |
| TG (mg/dL) | 176.67 ± 121.23 | 146.86 ± 82.92 | 265.56 ± 166.88 | <0.001 |
| HDL-C (mmol/L) | 1.16 ± 0.31 | 1.17 ± 0.30 | 1.12 ± 0.35 | 0.15 |
| LDL-C (mmol/L) | 2.53 ± 0.78 | 2.57 ± 0.76 | 2.42 ± 0.83 | 0.236 |
| hs-CRP (mg/L) | 5.25 ± 2.77 | 4.68 ± 2.37 | 6.92 ± 3.20 | <0.001 |
| BNP (pg/mL) | 511.12 ± 620.27 | 362.30 ± 569.73 | 954.70 ± 553.15 | <0.001 |
| Creatinine (μmol/L) | 79.61 ± 31.57 | 77.40 ± 25.71 | 86.19 ± 44.39 | 0.083 |
| LVEF (%) | 54.56 ± 2.92 | 54.43 ± 2.90 | 54.94 ± 2.95 | 0.281 |
| EDV (mL) | 100.96 ± 31.17 | 97.26 ± 29.41 | 112.00 ± 33.86 | 0.014 |
| ESV (mL) | 56.59 ± 18.98 | 54.55 ± 18.15 | 62.68 ± 20.23 | 0.024 |
| CI (L/min/m²) | 3.11 ± 0.94 | 3.00 ± 0.91 | 3.45 ± 0.97 | 0.004 |
| RSR (%) | 31.04 ± 15.36 | 33.18 ± 14.51 | 24.66 ± 16.17 | <0.001 |
| Native T1, Method A (ms) | 1253.07 ± 218.27 | 1198.67 ± 180.87 | 1415.21 ± 240.54 | <0.001 |
| Native T1, Method B (ms) | 1255.79 ± 261.29 | 1202.21 ± 233.27 | 1415.49 ± 277.02 | <0.001 |
| Post-contrast T1, Method A (ms) | 270.28 ± 48.66 | 258.66 ± 39.81 | 304.91 ± 53.72 | <0.001 |
| Post-contrast T1, Method B (ms) | 271.67 ± 55.63 | 260.14 ± 49.06 | 306.02 ± 59.88 | <0.001 |
| Data are presented as mean ± standard deviation or n (%), as applicable. MACE, major adverse cardiovascular events; BMI, body mass index; SBP, systolic blood pressure; DBP, diastolic blood pressure; FBG, fasting blood glucose; HbA1c, glycated hemoglobin; TG, triglycerides; HDL-C, high-density lipoprotein cholesterol; LDL-C, low-density lipoprotein cholesterol; hs-CRP, high-sensitivity C-reactive protein; BNP, B-type natriuretic peptide; LVEF, left ventricular ejection fraction; EDV, end-diastolic volume; ESV, end-systolic volume; CI, cardiac index; RSR, radial strain rate. | ||||
Table 1: Baseline clinical characteristics and T1 parameter comparisons between the MACE and non-MACE groups. The table summarizes demographic, clinical, laboratory, cardiac functional, and T1 mapping parameters for the total cohort and according to MACE status. Continuous and categorical variables are compared between the MACE and non-MACE groups, with corresponding P values.
| Parameter | Method A | Method B | Mean difference (ms) | t value | P value |
| Native T1 (ms) | 1253.07 ± 218.27 | 1255.79 ± 261.29 | −2.72 | −0.322 | 0.748 |
| Post-contrast T1 (ms) | 270.28 ± 48.66 | 271.67 ± 55.63 | −1.39 | −0.726 | 0.469 |
| Data are presented as mean ± standard deviation. Method A, septal region-of-interest method; Method B, whole-myocardium contouring method. Comparisons between methods were performed using paired Student's t-tests. A two-sided P value < 0.05 was considered statistically significant. | |||||
Table 2: Comparison of T1 values between Method A and Method B. Native and post-contrast T1 values obtained using the septal ROI method and whole-myocardium contouring method are compared using paired t-tests. Data are presented as mean ± standard deviation (x̄ ± s), together with the mean difference, t value, and P value.
| Parameter | ICC | 95% CI for ICC | Pearson r | Bias, 95% LoA (ms) |
| Native T1 | 0.873 | 0.818–0.912 | 0.887 | −2.72 (−241.06 to 235.62) |
| Post-contrast T1 | 0.86 | 0.801–0.903 | 0.893 | −1.39 (−55.60 to 52.81) |
| ICC, intraclass correlation coefficient; CI, confidence interval; LoA, limits of agreement. Pearson r represents the correlation between measurements obtained using Method A and Method B. Bias and 95% LoA were derived from Bland–Altman analysis. | ||||
Table 3: Inter-method reliability and Bland–Altman analysis of T1 measurements. Agreement between Method A and Method B for native and post-contrast T1 measurements is summarized using intraclass correlation coefficients (ICCs), 95% confidence intervals (CIs), Pearson correlation coefficients, mean bias, and 95% limits of agreement.
| Parameter | AUC | 95% CI | Optimal cutoff | Sensitivity (%) | Specificity (%) |
| Method A native T1 | 0.766 | 0.703–0.823 | 1235.1 ms | 76.9 | 67.7 |
| Method B native T1 | 0.722 | 0.653–0.785 | 1298.5 ms | 67.3 | 71 |
| Method A post-contrast T1 | 0.736 | 0.669–0.797 | 286.7 ms | 55.8 | 80 |
| Method B post-contrast T1 | 0.706 | 0.636–0.771 | 266.0 ms | 75 | 58.1 |
| AUC, area under the receiver operating characteristic curve; CI, confidence interval. Method A, septal region-of-interest method; Method B, whole-myocardium contouring method. Optimal cutoff values were determined using the Youden index. Sensitivity and specificity correspond to the reported optimal cutoff for each T1 parameter. | |||||
Table 4: Predictive performance of T1 parameters for major adverse cardiovascular events. Receiver operating characteristic analysis is summarized for native and post-contrast T1 measurements obtained using both methods. The table reports the area under the curve (AUC), 95% CI, optimal cutoff value, sensitivity, and specificity for MACE prediction.
| Type | Parameter | Measurement 1 | Measurement 2 | ICC(2,1) | 95% CI for ICC | Pearson r | Bias (ms) | 95% LoA (ms) |
| Intra-observer | Native T1, Method A | 1298.61 ± 219.49 | 1296.24 ± 241.85 | 0.958 | 0.882–0.985 | 0.962 | 2.37 | −129.30 to 134.04 |
| Intra-observer | Native T1, Method B | 1298.81 ± 241.00 | 1308.03 ± 237.50 | 0.948 | 0.856–0.982 | 0.948 | -9.22 | −160.24 to 141.80 |
| Intra-observer | Post-contrast T1, Method A | 283.66 ± 44.41 | 285.29 ± 48.60 | 0.931 | 0.812–0.976 | 0.933 | -1.63 | −35.87 to 32.62 |
| Intra-observer | Post-contrast T1, Method B | 283.70 ± 49.15 | 282.88 ± 45.34 | 0.944 | 0.846–0.980 | 0.947 | 0.83 | −30.13 to 31.79 |
| Inter-observer | Native T1, Method A | 1298.61 ± 219.49 | 1300.95 ± 219.46 | 0.966 | 0.904–0.988 | 0.966 | -2.34 | −114.66 to 109.97 |
| Inter-observer | Native T1, Method B | 1298.81 ± 241.00 | 1292.96 ± 250.74 | 0.933 | 0.816–0.976 | 0.933 | 5.85 | −171.03 to 182.74 |
| Inter-observer | Post-contrast T1, Method A | 283.66 ± 44.41 | 283.15 ± 45.38 | 0.937 | 0.828–0.978 | 0.937 | 0.52 | −30.67 to 31.71 |
| Inter-observer | Post-contrast T1, Method B | 283.70 ± 49.15 | 279.46 ± 54.20 | 0.952 | 0.868–0.983 | 0.957 | 4.24 | −27.07 to 35.56 |
| Data are presented as mean ± standard deviation. ICC, intraclass correlation coefficient; CI, confidence interval; LoA, limits of agreement. Method A, septal region-of-interest method; Method B, whole-myocardium contouring method. Intra-observer comparisons represent repeated measurements by the same observer, whereas inter-observer comparisons represent measurements obtained by different observers. | ||||||||
Table 5: Intra-observer and inter-observer reliability of T1 measurements (n = 30). Reproducibility of native and post-contrast T1 measurements obtained using Methods A and B is summarized for repeated measurements within and between observers. The table reports measurement values, ICCs with 95% CIs, Pearson correlation coefficients, mean bias, and 95% limits of agreement.
Discussion
The septal ROI method and whole-myocardium contouring method yielded T1 values that were not significantly different (P = 0.748 for native T1; P = 0.469 for post-contrast T1), with good inter-method agreement (native T1 ICC = 0.873; post-contrast T1 ICC = 0.860). The septal ROI method showed a small tendency toward lower values, with a mean difference of −2.72 ms for native T1. Despite the small mean bias, the relatively wide limits of agreement for native T1 indicate that the two methods should not be considered directly interchangeable for individual-patient measurements. These findings support the use of the septal ROI method as a simplified approach for T1 quantification in patients with MetS.
The methodological findings are consistent with a previous comparison of a septal approach and a short-axis full-layer method, which reported good consistency (CCC = 0.954) and systematically lower values with the septal method21. The small difference between methods may reflect their different myocardial sampling approaches, because the septal ROI method avoids focal LGE regions, whereas whole-myocardium contouring includes the entire myocardium, including LGE-positive regions19.
Both T1 measurement methods showed predictive value for MACE, with no significant difference in predictive performance. A meta-analysis of 4,025 patients with non-ischemic dilated cardiomyopathy reported that a 10 ms increase in native T1 was associated with an approximately 7% increase in MACE risk14. Another meta-analysis reported higher ECV and native T1 values in patients with events and identified ECV as independently associated with MACE risk23. The extent of LGE has also been reported as a predictor of MACE24. The septal ROI approach focuses on a region less affected by focal LGE and therefore provides an alternative method for assessing T1 values in this setting.
Although predictive performance did not differ significantly between the two methods, the Youden-optimal cutoffs for post-contrast T1 differed substantially (286.7 ms for Method A vs. 266.0 ms for Method B; Table 4), with opposite sensitivity–specificity profiles. This is plausibly explained by differences in the myocardial tissue compartments sampled by each approach. Whole-myocardium contouring includes LGE-positive scar and peri-scar tissue, in which gadolinium retention shortens post-contrast T1, and is more susceptible to endocardial partial-volume contamination from the blood pool; these effects shift the distribution of post-contrast T1 values obtained by Method B toward lower values and thereby alter the threshold that maximizes the Youden index. The septal ROI method samples a more homogeneous mid-septal region that avoids focal LGE and blood-pool contamination, making its post-contrast T1 distribution less sensitive to contour placement. These considerations should be kept in mind when comparing T1-derived thresholds across different measurement approaches.
From an operational standpoint, whole-myocardium contouring requires semi-automated delineation of the endocardial and epicardial borders across the myocardium, whereas the septal ROI method requires placement of a single ROI within the interventricular septum. The latter, therefore, requires less extensive image analysis. The septal region is also reported to be relatively less affected by respiratory motion artifacts and blood pool volume effects25. Clinical implementation of CMR should follow established SCMR recommendations and applicable gadolinium-based contrast agent safety guidance26˒27. The observed intra-observer ICCs of 0.931–0.958 and inter-observer ICCs of 0.933–0.966 further support the reproducibility of this approach.
This study has several limitations. First, although patients were enrolled from two institutions, the retrospective design and relatively modest sample size, together with the limited number of MACE events, may have reduced the statistical power to detect differences in predictive performance between the methods. Second, the septal ROI method samples only the mid-ventricular septum and may not capture regional variation in myocardial involvement across the entire left ventricle. Third, the follow-up duration was relatively limited (median, 21.4 months; interquartile range, 9.6–41.1 months), and longer-term assessment of MACE is warranted. Finally, post-hoc analysis indicated that the study had limited statistical power to detect inter-method differences in predictive performance (estimated power ≈47% for the observed native-T1 AUC difference of 0.044 at a two-sided α = 0.05), and the minimum AUC difference detectable at 80% power was approximately 0.06; the non-significant DeLong comparisons (P = 0.059 and P = 0.149) should therefore be interpreted cautiously rather than as evidence of equivalence.
In summary, the septal ROI method and whole-myocardium contouring yielded no significant difference in mean T1 measurements or MACE predictive performance in this cohort. The septal ROI approach requires less extensive image analysis and may serve as a practical alternative for clinical and large-scale research applications. However, the relatively wide limits of agreement and limited power for the AUC comparisons should be considered when interpreting these findings.
Disclosures
The authors declare that they have no conflicts of interest.
Materials
| Name | Company | Catalog Number | Comments |
|---|---|---|---|
| Cardiac phased-array coil | United Imaging Healthcare | NA | Integrated accessory of the United Imaging uMR 790; dedicated 16-channel cardiac coil |
| Gadopentetate dimeglumine (Gd-DTPA) | Consun Pharmaceutical Co., Ltd. | NA | Pharmaceutical product; contrast agent administered at 0.2 mL/kg |
| Medis Suite | Medis Medical Imaging Systems | Medis Suite MR 4.0.84.4 | T1 mapping analysis software |
| Python (including SciPy, scikit-learn, Pingouin, and pandas) | Open-source | NA | Statistical analysis and data processing |
| uMR 790 3.0 T MRI scanner | United Imaging Healthcare | uMR 790 | 3.0 T whole-body MRI system |
References
- Saklayen MG. The global epidemic of the metabolic syndrome. Curr Hypertens Rep. 2018;20(2):12. doi:10.1007/s11906-018-0812-z. PMID:29480368.
- Xi B, Liang Y, He T, et al. Prevalence of metabolic syndrome and its influencing factors among the Chinese adults: the China Health and Nutrition Survey in 2009. Prev Med. 2013;57(6):867–871. doi:10.1016/j.ypmed.2013.09.023. PMID:24103567.
- Mottillo S, Filion KB, Genest J, et al. The metabolic syndrome and cardiovascular risk: a systematic review and meta-analysis. J Am Coll Cardiol. 2010;56(14):1113–1132. doi:10.1016/j.jacc.2010.05.034. PMID:20863953.
- Li XM, Jiang L, Liu X, et al. Myocardial interstitial fibrosis and subclinical left ventricular systolic dysfunction in type 2 diabetes mellitus patients with obesity: a 3.0 T MRI study. Cardiovasc Diabetol. 2025. doi:10.1186/s12933-024-02533-1. PMID:41402782.
- Preda A, Liberale L, Montecucco F, et al. Imaging techniques for the assessment of adverse cardiac remodeling in metabolic syndrome. Heart Fail Rev. 2022;27(5):1883–1897. doi:10.1007/s10741-021-10195-6. PMID:34796433.
- Kalisz K, Navin PJ, Itani M, et al. Multimodality imaging in metabolic syndrome: state-of-the-art review. Radiographics. 2024;44(3):e230083. doi:10.1148/rg.230083. PMID:38329901.
- Garg P, Assadi H, Jones R, et al. Left ventricular fibrosis and hypertrophy are associated with mortality in heart failure with preserved ejection fraction. Sci Rep. 2021;11(1):1242. doi:10.1038/s41598-020-80477-0. PMID:33436786.
- Messroghli DR, Moon JC, Ferreira VM, et al. Clinical recommendations for cardiovascular magnetic resonance mapping of T1, T2, T2* and extracellular volume: a consensus statement by the SCMR. J Cardiovasc Magn Reson. 2017;19(1):75. doi:10.1186/s12968-017-0389-8. PMID:28992817.
- Brouwer WP, Baars EN, Germans T, et al. In-vivo T1 cardiovascular magnetic resonance study of diffuse myocardial fibrosis in hypertrophic cardiomyopathy. J Cardiovasc Magn Reson. 2014;16(1):28. doi:10.1186/1532-429X-16-28. PMID:24766828.
- Goncalves A, Moutinho E, Santos A, et al. Myocardial native T1 mapping at 3T cardiac magnetic resonance—closing the full-vendor reporting cycle of normal values. Clin Radiol. 2024;79(6):e745–e753. doi:10.1016/j.crad.2024.02.013. PMID:38582631.
- van den Boomen M, Slart RHJA, Hulleman EV, et al. Native T(1) reference values for nonischemic cardiomyopathies and populations with increased cardiovascular risk: a systematic review and meta-analysis. J Magn Reson Imaging. 2018;47(4):891–912. doi:10.1002/jmri.25885. PMID:29131444.
- Rauhalammi SM, Mangion K, Barrientos PH, et al. Native myocardial longitudinal (T1) relaxation time: regional, age, and sex associations in the healthy adult heart. J Magn Reson Imaging. 2016;44(3):654–661. doi:10.1002/jmri.25229. PMID:26946323.
- Omori T, Nakamori S, Fujimoto N, et al. Myocardial native T(1) predicts load-independent left ventricular chamber stiffness in patients with HFpEF. JACC Cardiovasc Imaging. 2020;13(10):2117–2128. doi:10.1016/j.jcmg.2020.05.030. PMID:32771571.
- Marchini F, Dal Passo B, Campo G, et al. T1 mapping and major cardiovascular events in non-ischaemic dilated cardiomyopathy: a systematic review and meta-analysis. ESC Heart Fail. 2025;12(4):2621–2630. doi:10.1002/ehf2.15279. PMID:40285366.
- Cadour F, Quemeneur M, Biere L, et al. Prognostic value of cardiovascular magnetic resonance T1 mapping and extracellular volume fraction in nonischemic cardiomyopathy: a systematic review and meta-analysis. J Cardiovasc Magn Reson. 2023;25(1):6. doi:10.1186/s12968-023-00920-7. PMID:36747201.
- Wang Y, Duan X, Zhu L, et al. Prognostic value of myocardial parametric mapping in patients with acute myocarditis: a retrospective study. Radiol Cardiothorac Imaging. 2025;7(1):e240118. doi:10.1148/ryct.240118. PMID:39912725.
- Popa A, Cionca C, Agoston R, et al. The role of magnetic resonance imaging in risk stratification of patients with acute myocarditis. Diagnostics (Basel). 2024;14(13):1412. doi:10.3390/diagnostics14131412. PMID:39001316.
- Dabir D, Vollbrecht TM, Luetkens JA, et al. Multiparametric cardiovascular magnetic resonance imaging in acute myocarditis: a comparison of different measurement approaches. J Cardiovasc Magn Reson. 2019;21(1):54. doi:10.1186/s12968-019-0568-x. PMID:31462282.
- Gai ND, Sandfort V, Liu S, et al. Dose correction for post-contrast T1 mapping of the heart: the MESA study. Int J Cardiovasc Imaging. 2016;32(2):271–279. doi:10.1007/s10554-015-0754-3. PMID:26362875.
- Levelt E, Pavlides M, Banerjee R, et al. Association of cardiovascular risk factors and myocardial fibrosis with early cardiac dysfunction in type 2 diabetes. Diabetes Care. 2017;40(3):405–412. doi:10.2337/dc16-1929. PMID:27986796.
- Hu P, Zhou H, Tang H, et al. Comparative study on native T(1) value of myocardium between using ConSept and SAX approaches in non-ischemic dilated cardiomyopathy. Zhong Nan Da Xue Xue Bao Yi Xue Ban. 2021;46(9):1003–1009. doi:10.11817/j.issn.1672-7347.2021.210229. PMID:34707011.
- Tao M, Dhaliwal S, Ghosalkar D, et al. Utility of native T1 mapping and myocardial extracellular volume fraction in patients with nonischemic dilated cardiomyopathy. Int J Cardiol Heart Vasc. 2024;51:101369. doi:10.1016/j.ijcha.2024.101369. PMID:38371310.
- Berdibekov BS, Alexandrova SA, Bulaeva NI, et al. Prognostic value of myocardial tissue characterization by CMR using T1 mapping in nonischemic dilated cardiomyopathy: a systematic review and meta-analysis. Clin Radiol. 2025;80:106726. doi:10.1016/j.crad.2024.10.007. PMID:39520933.
- Golukhova EZ, Bulaeva NI, Alexandrova SA, et al. The extent of late gadolinium enhancement predicts mortality, sudden death and major adverse cardiovascular events in nonischemic cardiomyopathy: a systematic review and meta-analysis. Clin Radiol. 2023;78(4):e314–e323. doi:10.1016/j.crad.2023.01.001. PMID:36707397.
- Meloni A, Martini N, Positano V, et al. Myocardial T1 values at 1.5T: normal values for General Electric scanners and sex-related differences. J Magn Reson Imaging. 2021;54(5):1506–1517. doi:10.1002/jmri.27716. PMID:33848021.
- Leiner T, Bogaert J, Friedrich MG, et al. SCMR Position Paper (2020) on clinical indications for cardiovascular magnetic resonance. J Cardiovasc Magn Reson. 2020;22(1):76. doi:10.1186/s12968-020-00682-4.
- European Society of Urogenital Radiology (ESUR). ESUR Guidelines on Contrast Agents, Version 10.0. 2018. Available from: https://www.esur.org/wp-content/uploads/2022/03/ESUR-Guidelines-10_0-Final-Version.pdf