This protocol integrates de-identification, terminology normalization, source verification, and reproducible visualization to generate auditable, aggregate outputs from real-world traditional Chinese medicine outpatient records.
Method Article
Source-Audited Mining and Visualization of Real-World Traditional Chinese Medicine Case Records Using Hegan Jianpi Formula
* These authors contributed equally
In This Article
Summary
Abstract
Real-world traditional Chinese medicine (TCM) outpatient records contain longitudinal information on diagnoses, syndrome elements, symptom narratives, and individualized prescriptions, but their semi-structured format complicates reproducible analysis. This article presents a source-audited protocol for converting de-identified case records into traceable aggregate tables and publication-ready visualizations. The workflow defines eligibility criteria and analysis units, preserves mappings between original and normalized terminology, verifies all reported numerators and denominators, and regenerates figures from versioned source tables. Applied to records from January 2015 through June 2024, the protocol identified 555 eligible prescription visits from 396 patients. The final dataset contained 324 normalized herb labels and 9,339 herb-use occurrences. The workflow generated parallel Western medicine and TCM disease spectra, an explicit syndrome-element spectrum and co-occurrence matrix, herb-frequency and materia medica profiles, a 37-term history-derived symptom spectrum, 15 directed association rules, hierarchical clustering, and diagnosis-stratified herb-use heatmaps. At least one prespecified history keyword was detected in 474 visits (85.41%). When permitted by institutional policy, a human-supervised artificial intelligence (AI) option may assist with terminology checks, cross-file consistency review, and caption-figure alignment. Any use of AI must be documented in a separate audit record and must not replace source-data review. By integrating governance, normalization, computation, clinical interpretation, and visual output into a single reproducible workflow, the method transforms dispersed clinical documentation into a reviewable research resource. The protocol can be adapted to other expert-practice datasets, multicenter terminology projects, and prospective clinical data platforms.
Introduction
Real-world traditional Chinese medicine (TCM) outpatient records preserve longitudinal clinical reasoning through narrative symptoms, parallel diagnostic systems, syndrome descriptions, and individualized prescriptions. Early knowledge-discovery work recognized case records as complex experiential data requiring dedicated informatics methods before their patterns can be studied reliably1. Subsequent research has shown that synonymous symptom expressions, fine-grained entities, and locally documented diagnostic terms must be normalized without erasing the original wording2,3,4,5,6. Electronic health record (EHR) data can also support computational prescription research and the use of reusable analytical tools when clinical context and data lineage remain visible7,8. Authoritative materia-medica references are therefore needed to standardize herb names, processing forms, properties, flavors, and meridian assignments9,10. At the reporting level, the RECORD and STROBE statements call for transparent descriptions of data sources, eligibility rules, variables, and analytical decisions, while the FAIR principles emphasize traceable and reusable research objects11,12,13. These considerations are especially important when records contain repeated visits, missing fields, overlapping terminology, and free text. Fitness-for-use assessment must address completeness, conformance, plausibility, and source agreement14,15. Free-text de-identification also requires explicit procedures and human review because automated methods can preserve useful clinical content while leaving residual privacy risks16,17,18.
Once governance and terminology are established, frequency profiling, association-rule mining, and hierarchical clustering can provide complementary views of prescription structure19,20,21. Network and science-mapping methods further demonstrate how coordinated visual representations can reveal relationships that a single ranked list cannot capture22,23,24,25. Recent studies of rheumatoid arthritis with depression, Janus kinase inhibitors in ulcerative colitis, and rheumatoid arthritis with fibromyalgia illustrate the value of version-locked retrieval criteria, co-occurrence networks, clustering, temporal interpretation, and explicit statements of analytical limitations26,27,28. The present study adapts these transferable design principles to clinical record mining rather than to literature bibliometrics. In the source records, Hegan Jianpi Formula refers to an experience-based formula associated with Professor Nai-li Yao's practice29,30. Related publications describe his broader liver-spleen harmonization and spleen-stomach clinical approach29,30. In this method article, the formula name identifies the source-record context only and does not establish a fixed composition, dose, treatment indication, or efficacy claim. The computational workflow uses deterministic rules and general-purpose statistical methods. Reproducible computational practice additionally requires preservation of inputs, documentation of parameters, scripted transformations, and reviewable outputs31,32. A human-supervised artificial intelligence (AI) option can assist with terminology checks, cross-file consistency reviews, and visual quality control when its use is documented. Clinical expertise, privacy safeguards, and accountable human decision-making must remain primary (Supplementary Table 1)33,34. The overall goal of this method is to convert de-identified TCM case records into a source-audited chain of disease-, syndrome-, symptom-, herb-use-, association-, clustering-, and diagnosis-stratified outputs. The worked example uses 555 eligible prescription visits from 396 patients to demonstrate how governance, normalization, computation, clinical interpretation, and visual release can be integrated without disclosing patient-level records, exact formulation details, dose ratios, or prescriptive instructions.
Protocol
This retrospective analysis of de-identified clinical records was reviewed and approved by the Medical Ethics Committee of Guang'anmen Hospital, China Academy of Chinese Medical Sciences (approval No. 2026-108-KY; 13 July 2026). The requirement for informed consent was waived by the Committee.
1. Establish ethics, governance, and data security
- Assign a data custodian, source-data analyst, clinical terminology reviewer, quantitative reviewer, and investigator authorized to approve aggregate release. Record each role in the project log.
- Prepare a data-management plan specifying the permitted source system, study period, fields, storage location, access permissions, backup procedure, retention period, and linkage-key restrictions.
- Export only the minimum variables required for the prespecified analysis. Include a local patient identifier, visit date, age or date of birth when permitted, sex, Western diagnosis, TCM disease name, de-identified history text, tongue text, pulse text, syndrome text, and prescription-herb fields.
- Remove names, national identification numbers, telephone numbers, detailed addresses, insurance identifiers, contact information, and other direct identifiers within the controlled institutional environment. Replace each medical record number with a project-specific patient identifier.
- Scan free-text fields for residual identifiers and mask every detected item. Store any linkage key separately from the analytical dataset and exclude it from working, collaboration, and submission folders.
- Preserve the initial de-identified export as a read-only source snapshot. Record its filename, creation date, row count, column count, file size, and checksum in a source manifest.
- Create separate directories for source files, working files, dictionaries, aggregate tables, figures, scripts, and audit records.
- Restrict released or shared materials to aggregate tables, approved de-identified dictionaries, scripts, and publication figures. Do not upload identifiable or potentially re-identifiable records to public generative-AI systems, unapproved cloud services, or public repositories.
NOTE: When institutional policy permits human-supervised AI assistance, provide only de-identified text excerpts or aggregate tables. Record the purpose, reviewed output, accepted correction, reviewer, and date in the audit log.
2. Define the record-identification rule and analysis units
- Define the institution, outpatient setting, responsible clinical team, electronic medical record system, and source period before screening. For the worked example, use records dated January 2015 through June 2024.
- Store the cohort-identification rule in a restricted, version-controlled file before examining analytical results. Record accepted terminology variants and all inclusion and exclusion conditions without disclosing confidential formulation details in the manuscript.
- Apply the version-locked record-identification rule at the prescription-visit level after herb-name normalization. Finalize the source files, dictionaries, cohort rule, and analysis parameters as a single release set.
- Create a new version and regenerate all dependent outputs whenever a version-locked component changes. Do not modify the cohort-identification rule after examining disease distributions, herb frequencies, association rules, or clusters.
- Include an outpatient visit when it falls within the version-locked study period, maps to a valid project patient identifier, contains an interpretable prescription record, and satisfies the restricted record-identification rule.
- Exclude exact duplicate exports, records outside the study period, records without an interpretable prescription, and rows that fail the version-locked identification rule. Assign one primary exclusion reason to each excluded row.
- Distinguish repeated exports from genuine follow-up visits. Remove only exact system or export duplicates and retain genuine repeated visits.
- Assign stable patient and prescription-visit identifiers. Create a cohort manifest containing the source version, rule version, screening status, inclusion or exclusion reason, patient identifier, visit identifier, and reviewer status.
- Use one record per unique patient for fixed demographic summaries, including age and sex. Use the prescription visit as the analysis unit for disease, syndrome, history-keyword, tongue, pulse, herb, association-rule, and clustering analyses.
- Separate cohort eligibility from variable availability. Retain an otherwise eligible visit when a variable-specific field is missing and report the evaluable denominator for each analysis.
- Freeze the cohort manifest before descriptive analysis. Record the number of eligible prescription visits and unique patients, and regenerate all dependent outputs if an eligibility decision changes.
3. Normalize terminology and preserve the audit trail
- Create separate version-controlled dictionaries for herbs, Western diagnoses, TCM disease names, syndrome elements, history keywords, tongue terms, pulse terms, and materia-medica attributes.
- Include the original term, normalized term, term category, source field, rule, reference source, dictionary version, reviewer, review date, and comments in each dictionary. Retain every original term after normalization.
- Normalize Chinese medicinal material (CMM) names using authoritative nomenclature references9,10. Correct typographical variants and system abbreviations while preserving clinically meaningful processing forms.
- Retain processing qualifiers, including stir-fried, vinegar-processed, honey-fried, ginger-processed, wine-processed, charred, and raw, as separate labels.
- Keep orthographically or clinically distinct herbs separate. Do not merge Bai Shao with Bai Zhu or infer an herb from an ambiguous abbreviation without source review.
- Preserve the original dose and unit in separate fields when available. Remove dose text only when constructing visit-level herb-presence variables.
- Do not interpret occurrence frequency as cumulative dose or treatment intensity.
- Normalize Western and TCM disease names independently. Preserve the diagnostic system and principal-diagnosis status, and do not translate a TCM disease label into a Western diagnosis unless both are explicitly recorded.
- Define a transliterated TCM disease label at first use when needed for reader orientation. Retain the original source label.
- Split multivalued explicit syndrome text using version-locked delimiters and map source expressions to normalized syndrome elements. Deduplicate each normalized element within a visit.
- Keep explicit syndrome text separate from inherited or score-derived indicator columns.
- Retain the original tongue, pulse, structured symptom, and de-identified history fields as separate data products. Do not treat a history-keyword match as equivalent to a clinician-entered structured symptom.
- Ask one reviewer to propose each ambiguous or many-to-one mapping, and have a second clinical reviewer verify it. Exclude uncertain mappings from released analyses until source review resolves them.
- Check for blank normalized labels, one-to-many mappings, many-to-one mappings, duplicate dictionary entries, unreviewed terms, and accidental loss of processing labels. Freeze dictionary versions before generating aggregate tables.
4. Verify source fields and lock reportable outputs
- Create an evidence ledger with one row for each manuscript claim, table, and figure panel. Record the analysis unit, source field, source version, dictionary version, script version, numerator, denominator, output file, reviewer, and approved wording.
- Recalculate eligible-visit and unique-patient counts, demographic summaries, disease counts, explicit syndrome counts, history-keyword counts, merged-herb frequencies, and herb-use totals directly from the version-locked files.
- Compare each recalculated value with the corresponding manuscript, spreadsheet, or figure value. Correct the manuscript and regenerate dependent outputs whenever a discrepancy is confirmed.
- Resolve each discrepancy at the source-field level. Record the reason, correction, reviewer, and date in the evidence ledger before releasing the affected result.
- Verify that each aggregate table contains the normalized label, numerator, denominator, percentage definition, analysis unit, and source identifier required to reproduce the corresponding statement.
- Verify the denominator used for each percentage. Use unique patients for fixed demographic characteristics and prescription visits for dynamic clinical and prescription variables.
- Compare figure labels, values, ordering, and panel definitions with their version-locked aggregate tables. Regenerate each figure after a table correction rather than manually editing plotted values.
- Ask a clinical reviewer to verify terminology mappings. Ask a quantitative reviewer to verify counts, rates, rule metrics, and heatmap denominators.
- Lock the evidence ledger, aggregate tables, and figure sources under one version identifier before manuscript assembly.
5. Generate descriptive spectra and co-occurrence outputs
- Generate patient-level age and sex summaries from one row per unique patient. Retain and explicitly report unknown categories.
- Generate Western and TCM disease spectra separately at the prescription-visit level. Preserve the original diagnostic system and calculate leading normalized labels using a common visit denominator.
- Generate the syndrome-element spectrum from the explicit normalized syndrome-text field. Split terms using version-locked delimiters, deduplicate each term within a visit, and calculate visit-level frequencies.
- Build the syndrome co-occurrence matrix from the same within-visit token sets. Encode node size by visit frequency and edge width or heatmap intensity by pairwise co-occurrence count.
- Prespecify an exact history-keyword dictionary when symptom information is primarily narrative. Scan only the de-identified history field and count each concept no more than once within a visit.
- Calculate the proportion of eligible visits containing at least one history keyword and rank all keyword counts. Export the full table and the plotted subset.
- Generate merged-herb frequencies from normalized prescription data. Count each normalized herb label no more than once per visit, and retain clinically meaningful processing forms as separate labels.
- Generate Four-Qi, five-flavor, and meridian-tropism profiles from the version-locked materia-medica dictionary. Treat Four-Qi as a single-valued category for each property-coded herb occurrence.
- Treat five-flavor and meridian-tropism as multi-label attributes. State the property-coded denominator and preserve the separate analysis unit.
- Export one machine-readable aggregate table for each descriptive domain before generating the final figures.
6. Perform association-rule and hierarchical-clustering analyses
- Construct a binary prescription-visit-by-herb matrix from the version-locked normalized prescription table. Use one row per eligible visit and one column per normalized herb label.
- Calculate support, confidence, and lift for directed single-herb association rules19. Retain the direction of each rule because confidence depends on the antecedent.
- Apply the prespecified thresholds of support ≥ 0.30, confidence ≥ 0.70, and lift > 1.0. Export each retained rule with its co-occurrence count and all three metrics.
- Draw the complete retained rule set as a directed bipartite rule network and an ordered rule-strength profile. Encode network edge width by support and edge color by lift.
- Encode point size by support and annotate confidence in the ordered profile.
- Verify that both rule displays contain the same retained rule set and preserve rule direction. Reconcile each mismatch against the exported rule table before release.
- Select the 20 highest-frequency herb-presence variables for hierarchical clustering. Calculate pairwise Jaccard distances and apply average linkage.
- Label the dendrogram with normalized herb names. Interpret branch proximity only as similarity in visit-level occurrence patterns.
- Export the binary matrix specification, rule table, network edge list, clustering input order, distance matrix, and linkage matrix before figure generation.
- Ask a quantitative reviewer to reproduce one rule metric manually. Compare every network edge with the rule table.
- Rerun the complete rule and clustering workflow whenever the cohort, terminology dictionary, or herb-presence matrix changes.
- For the worked example, perform a deterministic one-visit-per-patient sensitivity analysis by retaining the earliest source-order record for each patient. Compare the resulting 12 rules with the 15 rules from the visit-level analysis.
- Report the change as a descriptive robustness result rather than patient-level validation. Use the deterministic recomputation provided in Supplementary File 1.
7. Generate diagnosis-stratified patterns and the clinical interpretation framework
- Select clinically relevant principal Western-diagnosis strata before inspecting diagnosis-specific herb distributions.
- Count each normalized herb label no more than once per visit within each diagnosis stratum. Calculate prevalence as the number of visits containing the label divided by the total number of eligible visits in that stratum.
- Use the same displayed herb set and a fixed 0%–100% color scale across diagnosis strata. Display cell values to preserve exact interpretation.
- Report the numerator and denominator for each displayed cell in an independent aggregate table.
- Build a separate clinical interpretation panel after completing the descriptive heatmap. Keep computed results and expert interpretation visually distinct.
- Populate the cue layer only with terms traceable to the version-locked history-keyword table or explicit normalized syndrome text.
- Ask two clinical reviewers to agree on concise contextual interpretations of the selected cues. Record the reviewers and final wording in the evidence ledger.
- Link each contextual interpretation to a research use, such as variable selection, prospective validation, or hypothesis generation.
- Use dashed, non-directional connectors for the interpretation layer. Omit dose, fixed-composition, and treatment-recommendation content.
- Review the heatmap and interpretation panel together. Ensure that computed prevalence, expert context, and future research use remain clearly separated.
8. Assemble and verify the reproducibility package
- Export the source manifest, cohort manifest, dictionary versions, evidence ledger, analysis scripts, aggregate tables, figure sources, and final figures into separate directories.
- Name each file using a stable figure or table number and version date. Preserve one authoritative current version and archive superseded outputs separately.
- Generate each figure as one multipanel image file. Export a high-resolution PDF and a 300 dpi PNG for review.
- Place figure legends in the manuscript and keep them outside the image files. Describe each panel, analysis unit, denominator, and visual encoding.
- Prepare one independent XLSX file for each table.
- Ask an independent reviewer to compare manuscript numbers with aggregate tables and percentages with their numerators and denominators.
- Compare rule edges with the rule table and heatmap cells with the source matrix.
- Run automated checks for filename consistency, required sections, figure dimensions, table count, reference count, template residue, and restricted wording.
- Ask the clinical author team to review terminology, interpretation, intellectual-property boundaries, author details, funding order, ethics wording, and the final figure set.
- Remove patient-level files, linkage keys, unrestricted free text, internal correspondence, and temporary review artifacts from the submission package.
- Freeze the released package and record its version, date, checksum, manuscript version, and author-approval status. Create a new version and a change log for each subsequent correction.
Results
Successful application of the protocol produced a traceable chain connecting the de-identified source snapshot, cohort manifest, terminology dictionaries, aggregate tables, scripts, and final figures. The version-locked screening procedure identified 555 eligible prescription visits from 396 unique patients. Figure 1 summarizes the three coordinated stages of the method: governance, terminology normalization, and analysis with clinical review. The corresponding transparency and audit documentation, including the aggregate-only boundary for AI-assisted review, is provided in Supplementary Table 1.
The final cohort comprised 555 eligible prescription visits contributed by 396 unique patients (Figure 2 and Table 1). Genuine repeated visits were retained for dynamic clinical and prescription variables, whereas age and sex were summarized after patient-level deduplication. Patient age ranged from 13 to 94 years, with a mean of 47.11 years and a standard deviation of 14.88 years. The cohort included 228 female patients (57.58%), 167 male patients (42.17%), and 1 patient with unknown sex (0.25%). This separation of analysis units preserved longitudinal encounters without inflating the demographic denominator.
Western and TCM disease spectra are summarized in Figure 3. Western diagnoses were concentrated in gastrointestinal, hepatobiliary, and pancreatic disorders. Hierarchical grouping assigned 271 visits to gastrointestinal disorders, 222 to hepatobiliary or pancreatic disorders, and 62 to other systems (Figure 3A). The leading individual diagnoses were chronic gastritis in 133 visits (23.96%), fatty liver in 77 visits (13.87%), and liver cirrhosis in 46 visits (8.29%), followed by chronic atrophic gastritis, abdominal pain, chronic hepatitis B, dyspepsia, reflux esophagitis, chronic superficial gastritis, and chronic pancreatitis (Figure 3C and Table 2).
The corresponding TCM disease-name spectrum organized the same visits according to a parallel diagnostic system. Spleen-stomach or intestinal disease names accounted for 280 visits, liver-gallbladder disease names for 223, qi-blood-fluid disorders for 26, mind-chest-head disorders for 12, channel or limb disorders for 5, gynecological disorders for 4, and other categories for 5 visits (Figure 3B). Wei pi, a retained TCM disease label for epigastric fullness or discomfort, was recorded in 163 visits (29.37%). Ji disease (an accumulation-type source TCM label), Gan zhuo (literally, liver fixity; a retained classical TCM disease label), Bi disease (impediment disease), and Xiao ke (wasting-thirst) were retained as source TCM labels and were not converted into modern biomedical diagnoses. Gan pi, a TCM disease label used in the contemporary Chinese consensus for fatty liver disorders, was recorded in 77 visits (13.87%)35. The Western and TCM source fields remained independent and were not substituted for one another (Figure 3D and Table 3). Xie xie (loose or watery stools) and Fu xie (diarrhea) were separate original TCM disease labels, recorded 6 and 2 times, respectively, and neither was equated with a modern biomedical diagnosis. Displaying the two spectra side by side preserved the logic of each diagnostic system while demonstrating the clinical breadth of the source records.
The explicit normalized syndrome-text field contained 555 eligible visit rows. After within-visit deduplication, the leading elements were spleen in 362 visits (65.23%), liver in 304 (54.77%), qi deficiency in 295 (53.15%), stomach in 171 (30.81%), dampness in 151 (27.21%), and qi stagnation in 109 (19.64%; Figure 4A and Table 4). Heat, water retention, blood, blood stasis, channels, kidney, heart, and yin deficiency comprised the remainder of the displayed spectrum. Percentages were nonexclusive because multiple syndrome elements could occur during a single visit.
The network and count matrix were generated from the same visit-level token sets (Figure 4B,C). Frequent co-recording centered on spleen, liver, and qi deficiency, with additional connections to stomach, dampness, qi stagnation, heat, and water retention. Using one version-locked matrix for the frequency plot, network, and heatmap ensured that all three panels represented the same underlying evidence at different levels of detail. The recovered audit identified 0 exact syndrome-text/indicator matches among 555 rows and a mean text-indicator Jaccard similarity of 0.1806. The indicator columns were therefore excluded from substantive reporting. The retained materials did not contain reconstructable pre-cleaning distribution vectors; consequently, cross-version distributional stability was not estimated. The one-visit-per-patient sensitivity analysis instead addressed the effect of repeated visits. Source audit and data quality outcomes are summarized in Supplementary Table 2.
After terminology normalization and retention of clinically meaningful processing forms, the 555 visits contained 324 distinct merged herb labels and 9,339 herb-use occurrences. Bai Shao was recorded in 531 visits (95.68%), followed by Fu Ling in 520 (93.69%), Dang Gui in 510 (91.89%), Chi Shao in 467 (84.14%), and stir-fried Bai Zhu in 361 (65.05%; Figure 5A and Table 5). The rank-frequency curve of 36 leading labels showed a steep, high-frequency segment followed by a progressively broader tail (Figure 5B), providing a compact representation of the shared-background and individualized-prescription components. The source-to-normalized mappings, processing qualifiers, standard CMM names, source species, and evidence boundaries underlying herb nomenclature are documented in Supplementary Table 3.
The auxiliary materia-medica dictionary contained 9,115 property-coded herb-use occurrences. The leading Four-Qi categories were warm (2,588, 28.39%), slightly cold (2,339, 25.66%), neutral (2,330, 25.56%), and cold (1,221, 13.40%; Figure 5C). After normalization of compound source flavor terminology, the leading five-flavor categories were bitter (4,488, 49.24%), sweet (4,377, 48.02%), and pungent (2,893, 31.74%) (Figure 5D). Meridian-tropism coding was led by spleen (5,541, 60.79%), liver (4,801, 52.67%), lung (3,358, 36.84%), stomach (2,988, 32.78%), and heart (2,702, 29.64%; Figure 5E). Figure 5F records the distinct visit-level and property-coded analysis units and their reproducibility link. Together, these panels demonstrate how prescription frequency and standardized materia-medica descriptors can be summarized without collapsing processing-specific terminology.
The prespecified history dictionary contained 37 exact symptom concepts. At least one concept was detected in 474 of 555 eligible visits (85.41%). The leading terms were dry throat in 178 visits (32.07%), fatigue in 151 (27.21%), poor sleep in 139 (25.05%), abdominal distension in 115 (20.72%), acid reflux in 100 (18.02%), bitter taste in 99 (17.84%), heartburn in 90 (16.22%), hiccup in 87 (15.68%), belching in 87 (15.68%), and loose stool in 77 (13.87%; Figure 6A,B and Table 6).
The complete rank-frequency curve displayed the full 37-term distribution, whereas the cumulative line summarized the concentration of all keyword detections across ranks (Figure 6C). Figure 6D records the reproducible sequence used to generate the spectrum: lock the dictionary, scan de-identified history text, deduplicate concepts within each visit, and export aggregate counts and rates.
Association-rule mining used the version-locked 555-row prescription-visit-by-herb presence matrix. Fifteen directed single-herb rules met support ≥ 0.30, confidence ≥ 0.70, and lift > 1.0 (Figure 7A,B and Table 7). Retained support values ranged from 0.3009 to 0.7892, confidence values from 0.7302 to 0.9748, and lift values from 1.0010 to 1.1226.
The most frequently co-recorded directed pair was Chi Shao > Fu Ling, based on 438 visits, with support of 0.7892, confidence of 0.9379, and lift of 1.0010. The reverse rule had the same support and a confidence of 0.8423, demonstrating why rule direction must be retained. Threshold sensitivity retained 18, 11, 21, 14, 7, and 4 rules under support ≥ 0.25 or ≥ 0.35, confidence ≥ 0.65 or ≥ 0.75, or lift > 1.02 or > 1.05, respectively. In the one-visit-per-patient analysis, the same pair occurred in 316 visits, with support of 0.7980, confidence of 0.9489, and lift of 0.9994; therefore, it was not retained under the lift > 1.0 criterion. Threshold perturbations and repeat-visit sensitivity results are provided in Supplementary Table 4, and the deterministic recomputation is provided in Supplementary File 1. Accordingly, high visit-level support should not be interpreted as patient-level validation.
The largest lift values were observed for Gan Cao > stir-fried Bai Zhu (1.1226) and Gan Cao > Chi Shao (1.1200). Figure 7A integrates all 15 retained rules in a directed bipartite network, with edge width encoding support and edge color encoding lift. Figure 7B ranks the same rules by lift, scales each point by support, and annotates confidence. The two panels, therefore, distinguish network topology from quantitative rule strength rather than duplicating the same visual representation.
Hierarchical clustering of the 20 highest-frequency herb variables used Jaccard distance and average linkage (Figure 7C). The dendrogram provides a global representation of similarity in visit-level presence patterns that complements the local directional information provided by the association rules. Together, the panels demonstrate how complementary analytical views can be aligned to a single version-locked binary matrix.
Diagnosis-stratified prevalence was calculated for fatty liver (77 visits), liver cirrhosis (46 visits), and chronic gastritis (133 visits; Figure 8A and Table 8). Bai Shao, Fu Ling, and Dang Gui showed high prevalence across all three strata. Liver-cirrhosis visits showed prominent documentation of Dan Shen (95.65%), vinegar-processed E Zhu (86.96%), vinegar-processed Bie Jia (84.78%), and Sheng Huang Qi (60.87%). Fatty-liver visits showed a higher prevalence of Yin Chen (41.56%) and Ze Xie (31.17%) than the other strata displayed, whereas chronic-gastritis visits showed recurrent Huang Lian (44.36%), Mu Xiang (34.59%), and Chai Hu (36.09%). The heatmap, therefore, provides a compact descriptive comparison of aggregate prescription patterns across major clinical contexts.
Figure 8B separates computation from interpretation. Verified history cues are linked to concise expert contexts and then to research uses, including contextualizing syndrome elements, comparing diagnosis-stratified patterns, selecting variables for prospective validation, and generating follow-up questions. This final panel demonstrates how clinical expertise can enrich the analytical output while remaining visibly distinct from computed prevalence.
Figure 8C summarizes the reproducibility and release boundary by distinguishing source-verified or reanalyzed components from elements requiring caution or further confirmation. This final audit layer prevents unresolved or nonreconstructable analytical products from being presented as validated outputs.
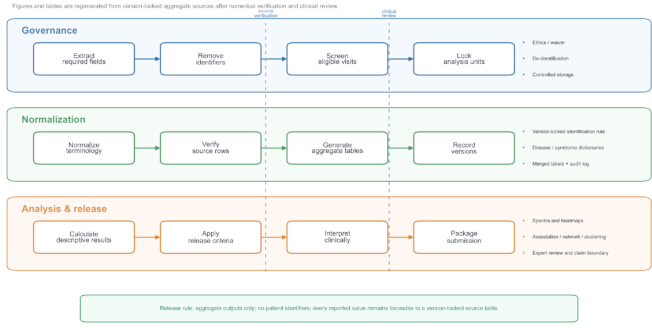
Figure 1: Source-audited case-record mining workflow. Governance, terminology normalization, aggregate analysis, clinical review, and release packaging are shown as sequential stages of the workflow. Blue, green, and orange bands distinguish workflow domains, and dashed vertical lines indicate audit gates. Arrows indicate workflow sequence and do not imply biological causality. The release rule specifies that only aggregate outputs are released, patient identifiers are excluded, and every reported value remains traceable to a version-locked source table. No error bars are applicable. Please click here to view a larger version of this figure.
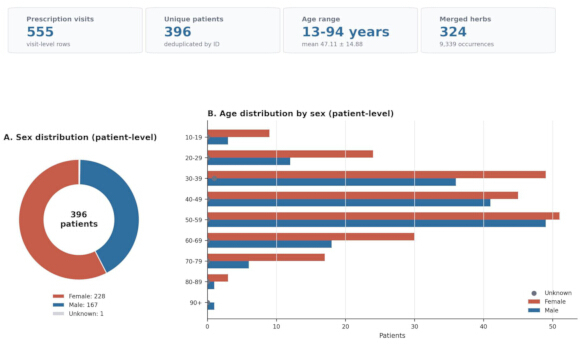
Figure 2: Dataset profile and patient-level demographics. The summary boxes report 555 prescription visits, 396 unique patients, a patient-level age range of 13–94 years with a mean age of 47.11 ± 14.88 years, and 324 merged herb labels representing 9,339 herb-use occurrences. (A) Patient-level sex distribution among 396 unique patients, including female, male, and unknown categories. (B) Patient-level age distribution by sex among the same 396 patients. The summary boxes use the displayed visit-level or patient-level denominators, as applicable. Colors distinguish sex categories and summary elements and have no inferential meaning. Please click here to view a larger version of this figure.
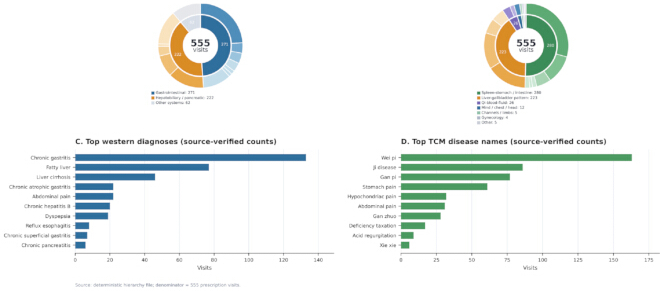
Figure 3: Disease spectra recovered from prescription visits. (A) Hierarchical Western disease groups and (B) hierarchical TCM disease groups derived from 555 eligible prescription visits. (C) Leading normalized Western diagnoses and (D) leading normalized TCM disease names from the same visit-level denominator. Ring segments and bars represent visit counts; colors distinguish diagnostic systems or categories and do not represent treatment effects. Retained TCM source labels are defined in Table 3: Wei pi (epigastric fullness or discomfort), Ji disease (accumulation-type source TCM label), Gan pi (a TCM disease label used for fatty-liver disorders), Gan zhuo (literally, liver fixity; a retained classical TCM disease label), Bi disease (impediment disease), Xiao ke (wasting-thirst), Xie xie (loose or watery stools), and Fu xie (diarrhea). These glosses do not convert the source labels into modern biomedical diagnoses. Please click here to view a larger version of this figure.
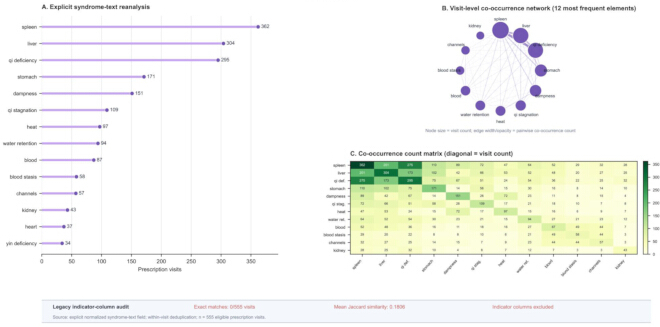
Figure 4: Explicit syndrome-text spectrum and co-occurrence structure. (A) Visit-level frequencies of 14 normalized syndrome elements after within-visit deduplication, using 555 eligible prescription visits as the denominator. (B) Co-occurrence network of the 12 most frequent syndrome elements; node size represents visit frequency, and edge width and opacity represent pairwise co-occurrence counts. (C) Corresponding symmetric co-occurrence count matrix; diagonal cells represent individual visit frequencies, and off-diagonal cells represent pairwise co-occurrence counts. The audit strip reports 0 exact syndrome-text/indicator matches across 555 rows and a mean text-indicator Jaccard similarity of 0.1806; therefore, the legacy indicator columns were excluded from substantive reporting. In the matrix, Qi def. denotes qi deficiency, Qi stag. denotes qi stagnation, and Water ret. denotes water retention. The color palette is descriptive. No error bars are applicable. Please click here to view a larger version of this figure.
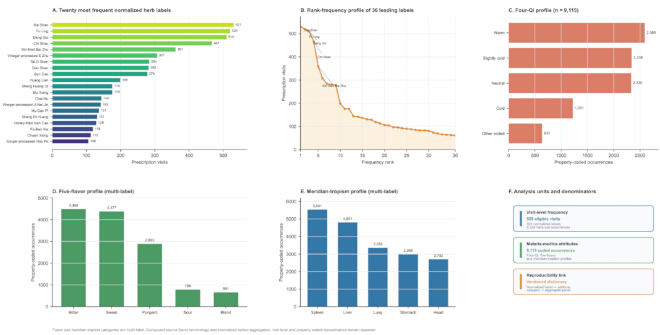
Figure 5: High-frequency herbs and normalized materia-medica attribute profiles. (A) The twenty most frequent normalized herb labels among 555 eligible prescription visits. (B) Rank-frequency profile of 36 leading normalized herb labels. (C) Four-Qi distribution based on 9,115 property-coded herb-use occurrences; Four-Qi is single-valued for each coded occurrence. (D) Five-flavor and (E) meridian-tropism distributions based on the same property-coded denominator; both are multi-label attributes, and category counts are therefore nonexclusive. (F) Visit-level and property-coded analysis units and their reproducibility link. Bar lengths represent counts, and colors distinguish panels. No error bars are applicable. Please click here to view a larger version of this figure.
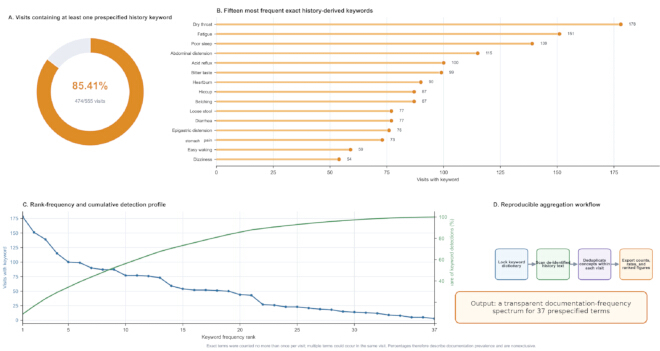
Figure 6: History-derived symptom keyword spectrum and reproducible aggregation workflow. (A) Proportion of 555 eligible prescription visits containing at least one prespecified history keyword; 474 visits (85.41%) contained at least one keyword. (B) Fifteen most frequent exact history-derived symptom concepts. (C) Full 37-term rank-frequency distribution and cumulative share of keyword detections. (D) Version-locked workflow from the prespecified dictionary to aggregate outputs. Each concept was counted no more than once within a visit, whereas multiple concepts could occur in the same visit. Orange bars represent keyword counts, and workflow colors distinguish processing stages. No error bars are applicable. Please click here to view a larger version of this figure.
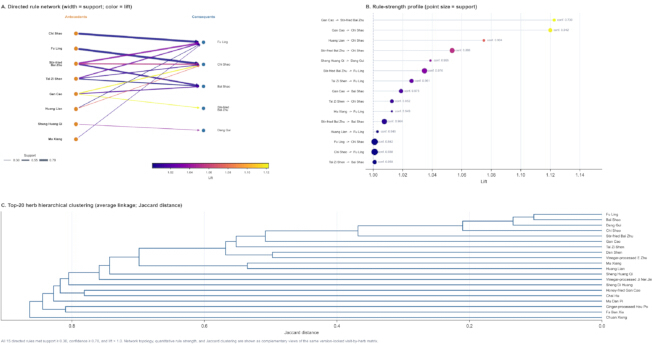
Figure 7: Directed herb association rules and hierarchical clustering. (A) Directed bipartite network of all 15 single-herb association rules meeting the prespecified thresholds of support ≥ 0.30, confidence ≥ 0.70, and lift > 1.0. Edge width represents support, and edge color represents lift. (B) Rule-strength profile of the same 15 rules ranked by lift; point size represents support, and adjacent labels report confidence (conf.). (C) Average-linkage hierarchical clustering of the 20 highest-frequency herb-presence variables using Jaccard distance. All panels use prescription visits as the unit of analysis and describe co-recording patterns rather than efficacy, synergy, or a recommended fixed combination. No error bars are applicable. Please click here to view a larger version of this figure.
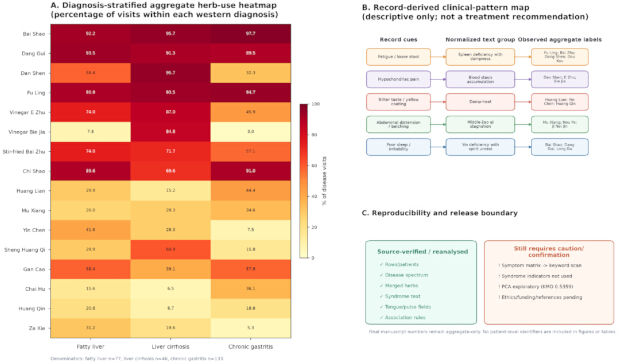
Figure 8: Diagnosis-stratified aggregate herb patterns, clinical-pattern map, and release boundary. (A) Diagnosis-stratified heatmap showing visit-level prevalence of 16 normalized herb labels in fatty liver (n = 77), liver cirrhosis (n = 46), and chronic gastritis (n = 133). Each cell represents the percentage of eligible visits within the corresponding Western-diagnosis stratum, using a fixed 0%–100% color scale. (B) Record-derived clinical-pattern map linking verified record cues to normalized text groups and observed aggregate herb labels. Dashed, non-directional connectors distinguish this descriptive interpretation layer from computed prevalence; the panel does not constitute a treatment recommendation. (C) Reproducibility and release boundary distinguishing source-verified or reanalyzed components from items requiring caution or confirmation. Please click here to view a larger version of this figure.
| Metric | Value | Unit/denominator | Status |
| Prescription visits | 555 | 555 prescription visits | verified from recovered XLSX |
| Unique patients | 396 | 396 unique patients | verified from recovered XLSX |
| Patient-level age range | 13-94 | years | verified |
| Patient-level age mean +/- SD | 47.11 +/- 14.88 | years | verified |
| Visit-level age mean +/- SD | 48.22 +/- 15.82 | years | verified |
| Patient-level sex | Female 228; male 167; unknown 1 | 396 patients | verified |
| Visit-level sex | Female 327; male 227; unknown 1 | 555 visits | verified |
| Merged herbs | 324 | distinct merged names | verified |
| Merged herb-use occurrences | 9339 | 555 prescription visits | verified |
Table 1: Dataset profile. Patient-level demographic characteristics and prescription-visit-level variables are reported using their respective denominators. Normalized herb totals are also provided.
| Disease name | Count | Percent of visits |
| Chronic gastritis | 133 | 24 |
| Fatty liver | 77 | 13.9 |
| Liver cirrhosis | 46 | 8.3 |
| Chronic atrophic gastritis | 22 | 4 |
| Abdominal pain | 22 | 4 |
| Chronic hepatitis B | 20 | 3.6 |
| Dyspepsia | 19 | 3.4 |
| Reflux esophagitis | 8 | 1.4 |
| Chronic superficial gastritis | 7 | 1.3 |
| Chronic pancreatitis | 6 | 1.1 |
| Ulcerative colitis | 6 | 1.1 |
| Gallbladder polyp | 6 | 1.1 |
| Post-cholecystectomy syndrome | 6 | 1.1 |
| Intestinal dysfunction | 6 | 1.1 |
| Gallstones | 6 | 1.1 |
| Chronic hepatitis | 5 | 0.9 |
| Fatigue | 5 | 0.9 |
| Gastrointestinal dysfunction (uncertain original label) | 5 | 0.9 |
| Chronic gastritis (uncertain original label) | 5 | 0.9 |
| Autoimmune liver cirrhosis | 4 | 0.7 |
Table 2: Leading normalized Western diagnoses. Counts and percentages of leading normalized Western diagnoses recorded across 555 eligible prescription visits. Percentages use eligible prescription visits as the denominator.
| TCM disease name | Count | Percent of visits |
| Wei pi (epigastric fullness or discomfort) | 163 | 29.4 |
| Ji disease (accumulation-type source TCM label) | 86 | 15.5 |
| Gan pi (TCM disease label used for fatty-liver disorders) | 77 | 13.9 |
| Stomach pain | 61 | 11 |
| Hypochondriac pain | 32 | 5.8 |
| Abdominal pain | 31 | 5.6 |
| Gan zhuo (literally, liver fixity; a retained classical TCM disease label) | 28 | 5 |
| Deficiency taxation | 17 | 3.1 |
| Acid regurgitation | 9 | 1.6 |
| Xie xie (loose or watery stools) | 6 | 1.1 |
| Insomnia | 4 | 0.7 |
| Dysentery | 4 | 0.7 |
| Headache | 4 | 0.7 |
| Bi disease (impediment disease) | 4 | 0.7 |
| Menstrual disorder | 3 | 0.5 |
| Chest impediment | 3 | 0.5 |
| Sweating disorder | 3 | 0.5 |
| Constipation | 3 | 0.5 |
| Fu xie (diarrhea) | 2 | 0.4 |
| Xiao ke (wasting-thirst) | 2 | 0.4 |
Table 3: Leading normalized TCM disease names. Counts and percentages of leading normalized TCM disease names recorded across 555 eligible prescription visits. Percentages use eligible prescription visits as the denominator. Retained source labels and explanatory glosses do not imply equivalence with modern biomedical diagnoses.
| Rank | Syndrome element | Prescription visits | Eligible visits | Visit percentage |
| 1 | spleen | 362 | 555 | 65.23% |
| 2 | liver | 304 | 555 | 54.77% |
| 3 | qi deficiency | 295 | 555 | 53.15% |
| 4 | stomach | 171 | 555 | 30.81% |
| 5 | dampness | 151 | 555 | 27.21% |
| 6 | qi stagnation | 109 | 555 | 19.64% |
| 7 | heat | 97 | 555 | 17.48% |
| 8 | water retention | 94 | 555 | 16.94% |
| 9 | Blood | 87 | 555 | 15.68% |
| 10 | blood stasis | 58 | 555 | 10.45% |
| 11 | channels | 57 | 555 | 10.27% |
| 12 | kidney | 43 | 555 | 7.75% |
| 13 | heart | 37 | 555 | 6.67% |
| 14 | yin deficiency | 34 | 555 | 6.13% |
Table 4: Leading normalized syndrome elements. Syndrome elements were extracted from explicit normalized syndrome text and deduplicated within each prescription visit. Counts use 555 eligible prescription visits as the denominator; percentages are nonexclusive because multiple syndrome elements can occur within a visit.
| Merged herb label | Count | Percent of visits |
| Bai Shao | 531 | 95.7 |
| Fu Ling | 520 | 93.7 |
| Dang Gui | 510 | 91.9 |
| Chi Shao | 467 | 84.1 |
| Stir-fried Bai Zhu | 361 | 65 |
| Vinegar-processed E Zhu | 307 | 55.3 |
| Tai Zi Shen | 284 | 51.2 |
| Dan Shen | 282 | 50.8 |
| Gan Cao | 278 | 50.1 |
| Huang Lian | 199 | 35.9 |
| Sheng Huang Qi | 176 | 31.7 |
| Mu Xiang | 176 | 31.7 |
| Chai Hu | 144 | 25.9 |
| Vinegar-processed Ji Nei Jin | 142 | 25.6 |
| Mu Dan Pi | 137 | 24.7 |
| Sheng Di Huang | 131 | 23.6 |
| Honey-fried Gan Cao | 129 | 23.2 |
| Fa Ban Xia | 119 | 21.4 |
| Chuan Xiong | 113 | 20.4 |
| Ginger-processed Hou Po | 106 | 19.1 |
| Yin Chen | 104 | 18.7 |
| Sheng Bai Zhu | 97 | 17.5 |
| Dou Kou | 96 | 17.3 |
| Sheng Long Gu | 92 | 16.6 |
| Zhe Bei Mu | 90 | 16.2 |
| Huang Qin | 88 | 15.9 |
| Dang Shen | 85 | 15.3 |
| Vinegar-processed Bie Jia | 83 | 15 |
| Gui Zhi | 83 | 15 |
| Sheng Mu Li | 81 | 14.6 |
| Jiao Zhi Zi | 74 | 13.3 |
| He Huan Hua | 69 | 12.4 |
| Wine-processed Huang Jing | 66 | 11.9 |
| Chen Pi | 64 | 11.5 |
| Ze Xie | 63 | 11.4 |
| Jin Qian Cao | 61 | 11 |
Table 5: Leading normalized herb labels by prescription-visit frequency. Each normalized herb label was counted at most once per prescription visit. Counts and percentages use 555 eligible prescription visits as the denominator, and clinically meaningful processing forms are retained as separate labels.
| Rank | History-derived keyword | Prescription visits | Eligible visits | Visit percentage |
| 1 | Dry throat | 178 | 555 | 32.07% |
| 2 | Fatigue | 151 | 555 | 27.21% |
| 3 | Poor sleep | 139 | 555 | 25.05% |
| 4 | Abdominal distension | 115 | 555 | 20.72% |
| 5 | Acid reflux | 100 | 555 | 18.02% |
| 6 | Bitter taste | 99 | 555 | 17.84% |
| 7 | Heartburn | 90 | 555 | 16.22% |
| 8 | Hiccup | 87 | 555 | 15.68% |
| 9 | Belching | 87 | 555 | 15.68% |
| 10 | Loose stool | 77 | 555 | 13.87% |
| 11 | Diarrhea | 77 | 555 | 13.87% |
| 12 | Epigastric distension | 76 | 555 | 13.69% |
| 13 | Stomach pain | 73 | 555 | 13.15% |
| 14 | Easy waking | 59 | 555 | 10.63% |
| 15 | Dizziness | 54 | 555 | 9.73% |
| 16 | Vomiting | 52 | 555 | 9.37% |
| 17 | Nausea | 52 | 555 | 9.37% |
| 18 | Dull pain | 51 | 555 | 9.19% |
| 19 | Distending pain | 50 | 555 | 9.01% |
| 20 | Poor appetite | 44 | 555 | 7.93% |
| 21 | Abdominal pain | 43 | 555 | 7.75% |
| 22 | Chest oppression | 27 | 555 | 4.86% |
| 23 | Irritability | 26 | 555 | 4.68% |
| 24 | Headache | 23 | 555 | 4.14% |
| 25 | Borborygmus | 23 | 555 | 4.14% |
| 26 | Epigastric discomfort | 21 | 555 | 3.78% |
| 27 | Palpitations | 19 | 555 | 3.42% |
| 28 | Yellow urine | 18 | 555 | 3.24% |
| 29 | Foreign-body sensation | 15 | 555 | 2.70% |
| 30 | Stabbing pain | 14 | 555 | 2.52% |
| 31 | Constipation | 13 | 555 | 2.34% |
| 32 | Drowsiness | 12 | 555 | 2.16% |
| 33 | Pharyngeal foreign-body sensation | 9 | 555 | 1.62% |
| 34 | Excessive sweating | 8 | 555 | 1.44% |
| 35 | Hypochondriac pain | 5 | 555 | 0.90% |
| 36 | Tenesmus | 5 | 555 | 0.90% |
| 37 | Dry stool | 3 | 555 | 0.54% |
Table 6: Leading history-derived symptom keywords. Exact symptom concepts detected in de-identified history text. Each concept was counted no more than once within a prescription visit, whereas multiple concepts could occur within the same visit. Counts and percentages use 555 eligible prescription visits as the denominator.
| Antecedent | Consequent | Co-occurring visits | Support | Confidence | Lift |
| Chi Shao | Fu Ling | 438 | 0.7892 | 0.9379 | 1.0010 |
| Fu Ling | Chi Shao | 438 | 0.7892 | 0.8423 | 1.0010 |
| Stir-fried Bai Zhu | Fu Ling | 350 | 0.6306 | 0.9695 | 1.0348 |
| Stir-fried Bai Zhu | Bai Shao | 348 | 0.6270 | 0.9640 | 1.0076 |
| Stir-fried Bai Zhu | Chi Shao | 320 | 0.5766 | 0.8864 | 1.0535 |
| Tai Zi Shen | Fu Ling | 273 | 0.4919 | 0.9613 | 1.0260 |
| Tai Zi Shen | Bai Shao | 272 | 0.4901 | 0.9577 | 1.0010 |
| Gan Cao | Bai Shao | 271 | 0.4883 | 0.9748 | 1.0189 |
| Gan Cao | Chi Shao | 262 | 0.4721 | 0.9424 | 1.1200 |
| Tai Zi Shen | Chi Shao | 242 | 0.4360 | 0.8521 | 1.0127 |
| Gan Cao | Stir-fried Bai Zhu | 203 | 0.3658 | 0.7302 | 1.1226 |
| Huang Lian | Fu Ling | 187 | 0.3369 | 0.9397 | 1.0029 |
| Huang Lian | Chi Shao | 180 | 0.3243 | 0.9045 | 1.0750 |
| Sheng Huang Qi | Dang Gui | 168 | 0.3027 | 0.9545 | 1.0388 |
| Mu Xiang | Fu Ling | 167 | 0.3009 | 0.9489 | 1.0127 |
Table 7: Directed herb association rules meeting the prespecified thresholds. Rules were generated from 555 binary prescription-visit rows using support ≥ 0.30, confidence ≥ 0.70, and lift > 1.0. Support uses 555 prescription visits as the denominator, and the rule direction is retained because confidence is directional.
| Herb label | Fatty liver (n) | Fatty liver (N) | Fatty liver (%) | Liver cirrhosis (n) | Liver cirrhosis (N) | Liver cirrhosis (%) | Chronic gastritis (n) | Chronic gastritis (N) | Chronic gastritis (%) |
| Bai Shao | 71 | 77 | 92.21% | 44 | 46 | 95.65% | 130 | 133 | 97.74% |
| Dang Gui | 72 | 77 | 93.51% | 42 | 46 | 91.30% | 119 | 133 | 89.47% |
| Dan Shen | 45 | 77 | 58.44% | 44 | 46 | 95.65% | 43 | 133 | 32.33% |
| Fu Ling | 70 | 77 | 90.91% | 43 | 46 | 93.48% | 126 | 133 | 94.74% |
| Vinegar-processed E Zhu | 57 | 77 | 74.03% | 40 | 46 | 86.96% | 61 | 133 | 45.86% |
| Vinegar-processed Bie Jia | 6 | 77 | 7.79% | 39 | 46 | 84.78% | 4 | 133 | 3.01% |
| Stir-fried Bai Zhu | 57 | 77 | 74.03% | 33 | 46 | 71.74% | 76 | 133 | 57.14% |
| Chi Shao | 69 | 77 | 89.61% | 32 | 46 | 69.57% | 121 | 133 | 90.98% |
| Huang Lian | 23 | 77 | 29.87% | 7 | 46 | 15.22% | 59 | 133 | 44.36% |
| Mu Xiang | 20 | 77 | 25.97% | 13 | 46 | 28.26% | 46 | 133 | 34.59% |
| Yin Chen | 32 | 77 | 41.56% | 13 | 46 | 28.26% | 10 | 133 | 7.52% |
| Sheng Huang Qi | 23 | 77 | 29.87% | 28 | 46 | 60.87% | 21 | 133 | 15.79% |
| Gan Cao | 45 | 77 | 58.44% | 18 | 46 | 39.13% | 77 | 133 | 57.89% |
| Chai Hu | 12 | 77 | 15.58% | 3 | 46 | 6.52% | 48 | 133 | 36.09% |
| Huang Qin | 16 | 77 | 20.78% | 4 | 46 | 8.70% | 25 | 133 | 18.80% |
| Ze Xie | 24 | 77 | 31.17% | 9 | 46 | 19.57% | 7 | 133 | 5.26% |
Table 8: Diagnosis-stratified herb-use prevalence. Numerators, denominators, and visit-level prevalence of 16 normalized herb labels in fatty liver (n = 77), liver cirrhosis (n = 46), and chronic gastritis (n = 133). Each herb label was counted no more than once per eligible prescription visit.
Supplementary Table 1: AI-assisted transparency and audit record. Documentation distinguishing the original-analysis record from the revision-stage consistency review conducted on 21 August 2026. The table records the tool/model/version, input scope, purpose, identified Four-Qi cardinality mismatch, human correction, use limitations, reviewer information, disposition, and prompt template. No raw patient-level rows were provided to the AI system. Please click here to download this file.
Supplementary Table 2: Source-audit data-quality outcomes. Recovered-field completeness, audit findings, analytical actions, and released states are reported for source clinical fields and legacy analytical structures. The table documents exclusion of unreconciled legacy syndrome indicators, correction of earlier herb totals, the absence of reconstructable pre-cleaning distribution vectors for cross-version stability estimation, and quantities that could not be reconstructed. Please click here to download this file.
Supplementary Table 3: Herb nomenclature mapping. Controlled herb display labels are linked to processing qualifiers, standard Chinese medicinal material (CMM) names, source terminology, botanical, zoological, or mineral sources, reference versions, evidence locators, and evidence boundaries. Processing-specific labels are retained where clinically meaningful. Please click here to download this file.
Supplementary Table 4: Threshold and repeat-visit sensitivity analyses. Association-rule threshold perturbations, one-visit-per-patient rule-set comparisons, Chi Shao > Fu Ling sensitivity metrics, and the 190-pair clustering-input distance comparison are reported. Please click here to download this file.
Supplementary File 1: Deterministic threshold and repeat-visit sensitivity script. Deterministic script used to reproduce aggregate threshold and repeat-visit sensitivity metrics from the version-locked source dataset. The file contains no patient-level data. Please click here to download this file.
Discussion
The central contribution of this protocol is a complete and inspectable pathway from de-identified TCM case records to aggregate research figures. The most critical steps are to freeze the cohort-identification rule before inspecting analytical results, distinguish unique patients from prescription visits, preserve every original-to-normalized term mapping, and verify each numerator and denominator before visualization. These controls transform data cleaning from an invisible preliminary activity into a documented component of the method. They also align the workflow with RECORD, STROBE, FAIR, and established EHR data-quality frameworks11,12,13,14,15. A result is considered ready for release only when its source field, analysis unit, dictionary version, calculation rule, denominator, table, figure, and reviewer decision can be traced in the evidence ledger.
The method is innovative because governance, terminology engineering, computation, visualization, and clinical review are integrated rather than treated as separate tasks. A single explicit syndrome matrix generates the frequency spectrum, co-occurrence network, and heatmap. A single prescription-visit-by-herb matrix supports frequency summaries, directed association rules, and hierarchical clustering19,20,21. A single diagnosis-stratified table supports both exact percentages and the final heatmap. The analytical workflow uses scripted, reproducible open-source tools36,37,38,39,40, allowing a correction to an upstream dictionary or cohort decision to propagate through all dependent outputs. Earlier clinical data warehouse work also demonstrates the importance of source-linked preprocessing and structured data reuse41,42. This architecture reduces manual transcription, maintains alignment between graphical encodings and source tables, and facilitates audit, teaching, and transfer to other research teams.
Three recent database-mining studies provide useful design principles, although their unit of analysis is a publication rather than a clinical visit. The rheumatoid arthritis and depression study combines a predefined search strategy with country, institution, author, journal, keyword, and timeline analyses26. The ulcerative colitis and Janus kinase inhibitor study uses coordinated collaboration, co-citation, clustering, and burst analyses to distinguish persistent themes from emerging research fronts27. The rheumatoid arthritis and fibromyalgia study extends bibliometric mapping with bioinformatics while maintaining a distinction between the two evidence layers28. The present protocol applies the same principle of coordinated but noninterchangeable analytical views. Transfer to gynecology, respiratory medicine, rheumatology, or another specialty requires reconstruction of specialty-specific fields, terminology dictionaries, inclusion and exclusion rules, outcomes, and clinical review procedures before the rule set is reused. Disease spectra, syndrome networks, symptom keywords, association rules, clustering, and diagnosis-stratified patterns all arise from version-locked sources, but each addresses a distinct question and retains its own denominator and interpretation boundary.
Human-supervised AI can provide an additional quality-control layer when restricted to approved de-identified excerpts or aggregate materials. Within this workflow, AI can compare terminology across files, flag inconsistencies between captions and tables, identify labels that extend beyond figure boundaries, verify that each displayed network node has a valid edge, and suggest clearer wording. AI does not determine cohort eligibility, invent terminology mappings, infer treatment effects, or replace source-data review. This division of responsibilities is consistent with the broader view that medical AI should augment human judgment rather than obscure accountability33. It also reflects the DECIDE-AI emphasis on transparent human factors, error handling, and accountable evaluation34. The purpose of each prompt, the reviewed output, the accepted correction, the reviewer, and the date should therefore be retained in the audit log whenever AI assistance is used.
Troubleshooting is particularly important when an output appears clinically plausible but fails source reconciliation. In such cases, downstream interpretation should be suspended until the discrepancy is traced to eligibility determination, deduplication, terminology mapping, field selection, denominator choice, or figure assembly. All dependent outputs should then be regenerated after correction. The worked example remains a single-center, retrospective, expert-outpatient dataset in which repeated visits are not independent of one another. The one-visit-per-patient sensitivity analysis reduced the retained rule set from 15 to 12 while preserving membership of all 20 top herbs. Across all 190 unordered pairs among these 20 shared variables, the Pearson correlation was 0.9944, Spearman rho was 0.9836, the mean absolute change in Jaccard distance was 0.0146, and the maximum change was 0.0528 (Supplementary Table 4). Accordingly, high visit-level support should not be interpreted as patient-level validation. The history-keyword spectrum reflects literal documentation rather than a validated symptom scale. Materia-medica summaries are occurrence-weighted rather than dose-weighted. Association rules describe co-recording rather than causation. Diagnosis-stratified heatmaps are descriptive and do not establish comparative effectiveness, disease specificity, or treatment necessity.
The protocol can be applied to research on the inheritance of expert clinical experience, the description of specialist outpatient cohorts, multicenter terminology harmonization, documentation-quality review, variable selection for prospective registries, and privacy-conscious preparation of aggregate collaboration datasets. Future work can incorporate prospective structured symptom collection, patient-clustered models, explicit dose variables, prespecified comparative hypotheses, external validation, versioned terminology services, privacy-preserving computation, and interactive evidence ledgers. Natural-language processing and AI-assisted review may further reduce repetitive curation when governed by version-locked rules and human verification. More broadly, the protocol enables dispersed clinical experience to be transformed into a transparent research object that can be inspected, reproduced, challenged, and extended. The method does not convert frequency into efficacy; rather, it converts undocumented analytical decisions into visible evidence, providing a foundation for more rigorous clinical questions and more durable real-world TCM research.
Disclosures
The authors declare no competing interests.
Acknowledgements
OpenAI Codex (gpt-5.6-luna and gpt-5.6-sol) was used exclusively during manuscript revision for aggregate-level cross-file consistency checks and wording suggestions. No patient-level records were provided to the AI system. All AI-assisted outputs were independently verified against the source materials by Tian Xia on 21 August 2026. The authors reviewed and approved the final content and take full responsibility for the manuscript. This project was supported by the National Key Research and Development Program of China, Key Special Project on Modernization of Traditional Chinese Medicine (No. 2025YFC3512800); the National Science and Technology Major Project of China (Project No. 2026ZD0554100; Subproject No. 2026ZD0554101); the Central High-level Traditional Chinese Medicine Hospital Clinical Research and Achievement Translation Capacity Improvement Project, Special Project for Inheriting the Academic Experience of Renowned Senior Traditional Chinese Medicine Experts (No. HLCMHPP2023016); and the Natural Science Foundation of Xinjiang Uygur Autonomous Region (No. 2025D01C213).
Materials
| Name | Company | Catalog Number | Comments |
|---|---|---|---|
| Aggregate reanalysis spreadsheets | Author-generated local files | Not applicable | Used for aggregate counts, tables, and figure generation. |
| De-identified outpatient case-record export | Institutional electronic medical record system | Not applicable | Used only in the controlled institutional environment; patient-level records are not submission materials. |
| lxml | lxml project | 6.1.1 | Software version used for namespace-preserving serialization during revision-stage regeneration; not a historical original-analysis version. |
| Matplotlib | Matplotlib project (matplotlib.org) | 3.11.1 | Version observed in the revision-stage regeneration environment and Figure 3 SVG metadata; not a historical original-analysis version. |
| NetworkX | NetworkX project | PyPI package: networkx | Package identifier recorded; exact revision-stage version was not verified in the inherited environment. |
| NumPy | NumPy project | 2.3.5 | Software version used to regenerate the revised aggregate outputs; not a historical original-analysis version. |
| openpyxl | openpyxl project | 3.1.5 | Software version used to write the revised aggregate XLSX outputs; not a historical original-analysis version. |
| pandas | pandas project | 3.0.1 | Software version used to regenerate the revised aggregate outputs; not a historical original-analysis version. |
| PyMuPDF | PyMuPDF project | 1.28.2 | Software version used for revision-stage regeneration of revised figure outputs; not a historical original-analysis version. |
| Python | Python Software Foundation | 3.13.15 | Software version used to regenerate the revised aggregate outputs; not a historical original-analysis version. |
| SciPy | SciPy project | PyPI package: scipy | Package identifier recorded; exact revision-stage version was not verified in the inherited environment. |
References
- Wang YH, et al. Study on knowledge discovery in traditional Chinese medical case records [in Chinese]. Zhong Xi Yi Jie He Xue Bao. 2007;5(4):368-372.
- Wang Y, et al. Automatic symptom name normalization in clinical records of traditional Chinese medicine. BMC Bioinformatics. 2010;11:40.
- Zhou L, et al. Natural language processing algorithms for normalizing expressions of synonymous symptoms in traditional Chinese medicine. Evid Based Complement Alternat Med. 2021;2021:6676607.
- Chu X, et al. Quantitative knowledge presentation models of traditional Chinese medicine (TCM): a review. Artif Intell Med. 2020;103:101810.
- Zhang T, et al. Constructing fine-grained entity recognition corpora based on clinical records of traditional Chinese medicine. BMC Med Inform Decis Mak. 2020;20:64.
- Wang Q, et al. A study of entity-linking methods for normalizing Chinese diagnosis and procedure terms to ICD codes. J Biomed Inform. 2020;105:103418.
- Zhang H, et al. Transformer- and generative adversarial network-based inpatient traditional Chinese medicine prescription recommendation: development study. JMIR Med Inform. 2022;10(5):e35239.
- Dan W, et al. SinoMedminer: an R package and Shiny application for mining and visualizing traditional Chinese medicine herbal formulas. Chin Med. 2025;20:80.
- Chinese Pharmacopoeia Commission. Pharmacopoeia of the People's Republic of China. 2025 ed. China Medical Science and Technology Press; Beijing; 2025.
- Editorial Committee of Zhonghua Bencao, State Administration of Traditional Chinese Medicine. Zhonghua Bencao. 10 vols. Shanghai Scientific and Technical Publishers; Shanghai; 1999. ISBN: 7532351068. Available from: National Diet Library record
- Benchimol EI, et al. The REporting of studies Conducted using Observational Routinely-collected health Data (RECORD) statement. PLoS Med. 2015;12(10):e1001885.
- von Elm E, et al. The Strengthening the Reporting of Observational Studies in Epidemiology (STROBE) statement: guidelines for reporting observational studies. Lancet. 2007;370(9596):1453-1457.
- Wilkinson MD, et al. The FAIR Guiding Principles for scientific data management and stewardship. Sci Data. 2016;3:160018.
- Weiskopf NG, Weng C. Methods and dimensions of electronic health record data quality assessment: enabling reuse for clinical research. J Am Med Inform Assoc. 2013;20(1):144-151.
- Kahn MG, et al. A harmonized data quality assessment terminology and framework for the secondary use of electronic health record data. EGEMS (Wash DC). 2016;4(1):18.
- Kovačević A, Bašaragin B, Milošević N, Nenadić G. De-identification of clinical free text using natural language processing: a systematic review of current approaches. Artif Intell Med. 2024;151:102845.
- Meystre SM, et al. Text de-identification for privacy protection: a study of its impact on clinical text information content. J Biomed Inform. 2014;50:142-150.
- Neamatullah I, et al. Automated de-identification of free-text medical records. BMC Med Inform Decis Mak. 2008;8:32.
- Agrawal R, Srikant R. Fast algorithms for mining association rules in large databases. Presented at: 20th International Conference on Very Large Data Bases; Santiago, Chile; 1994. p. 487-499.
- Hahsler M, Grün B, Hornik K. arules: a computational environment for mining association rules and frequent item sets. J Stat Softw. 2005;14(15):1-25.
- Murtagh F, Contreras P. Algorithms for hierarchical clustering: an overview. WIREs Data Min Knowl Discov. 2012;2(1):86-97.
- van Eck NJ, Waltman L. Software survey: VOSviewer, a computer program for bibliometric mapping. Scientometrics. 2010;84(2):523-538.
- Chen C. CiteSpace II: detecting and visualizing emerging trends and transient patterns in scientific literature. J Am Soc Inf Sci Technol. 2006;57(3):359-377.
- Aria M, Cuccurullo C. bibliometrix: an R-tool for comprehensive science mapping analysis. J Informetr. 2017;11(4):959-975.
- Donthu N, et al. How to conduct a bibliometric analysis: an overview and guidelines. J Bus Res. 2021;133:285-296.
- Zhao Y, Chen GY, Fang M. Research trends of rheumatoid arthritis and depression from 2019 to 2023: a bibliometric analysis. J Multidiscip Healthc. 2024;17:4465-4474.
- Wang Y, et al. Research trends and hotspots in JAK inhibitors for ulcerative colitis: a bibliometric analysis from 2015 to 2024. J Multidiscip Healthc. 2025;18:6755-6771.
- Chen G, Yan Z, Wang Y, Tao Q. Rheumatoid arthritis and fibromyalgia syndrome: a bibliometric and bioinformatics perspective on comorbidity research. J Multidiscip Healthc. 2025;18:6811-6827.
- Wang SL, et al. Yao Naili's experience in applying the harmonizing liver and spleen method. Journal of Traditional Chinese Medicine. 2008;49(7):596-597.
- Wang L, et al. Analysis of Professor Naili Yao's experience in treating spleen-stomach diseases [in Chinese]. Lishizhen Med Mater Med Res. 2022;33(6):1436-1438.
- Sandve GK, Nekrutenko A, Taylor J, Hovig E. Ten simple rules for reproducible computational research. PLoS Comput Biol. 2013;9(10):e1003285.
- Munafò MR, et al. A manifesto for reproducible science. Nat Hum Behav. 2017;1:0021.
- Topol EJ. High-performance medicine: the convergence of human and artificial intelligence. Nat Med. 2019;25(1):44-56.
- Vasey B, et al. Reporting guideline for the early-stage clinical evaluation of decision support systems driven by artificial intelligence: DECIDE-AI. Nat Med. 2022;28(5):924-933.
- Branch of Gastrointestinal Diseases, China Association of Chinese Medicine. Expert consensus on traditional Chinese medicine diagnosis and treatment of Gan pi (2023). Chinese Journal of Integrative Digestive Diseases. 2024;32(9):741-747.
- McKinney W. Data structures for statistical computing in Python [conference paper]. Presented at: 9th Python in Science Conference; Austin, TX; 2010. p. 56-61. doi:10.25080/Majora-92bf1922-00a.
- Harris CR, et al. Array programming with NumPy. Nature. 2020;585(7825):357-362.
- Virtanen P, et al. SciPy 1.0: fundamental algorithms for scientific computing in Python. Nat Methods. 2020;17(3):261-272.
- Hunter JD. Matplotlib: a 2D graphics environment. Comput Sci Eng. 2007;9(3):90-95.
- Hagberg AA, Schult DA, Swart PJ. Exploring network structure, dynamics, and function using NetworkX. Presented at: 7th Python in Science Conference; Pasadena, CA; 2008. p. 11-15. doi:10.25080/TCWV9851.
- Zhou X, et al. Development of traditional Chinese medicine clinical data warehouse for medical knowledge discovery and decision support. Artif Intell Med. 2010;48(2-3):139-152.
- Liu B, et al. Data processing and analysis in real-world traditional Chinese medicine clinical data: challenges and approaches. Stat Med. 2012;31(7):653-660.