This study compares flood and LN₂-derived cryogenic N₂ gas-jet cooling during TC18 turning. Cryogenic cooling was associated with shallower visible deformation, retained near-surface hardening, and lower surface roughness across the tested feed rates, although comparisons were descriptive due to the lack of independent replication in machining.
Research Article
Comparative Observations of Feed Rate and LN2-Derived Cryogenic N2 Gas-Jet Cooling on the Surface-Altered Layer of TC18 Titanium Alloy during Turning
In This Article
Summary
Abstract
Titanium alloys are difficult to machine because low thermal conductivity and affinity for cutting-tool materials concentrate heat and mechanical loading near the cutting edge. In high-strength near-beta TC18 titanium alloy, these conditions can produce a surface-altered layer that may affect component performance. This study examined the effects of feed rate and cooling mode during external turning of TC18. Flood cooling with DRK-5011 semi-synthetic fluid at 20 °C was compared with LN₂-derived cryogenic N₂ gas-jet cooling at feed rates of 0.10, 0.15, 0.20, and 0.26 mm/rev, with a spindle speed of 135 r/min, an initial cutting speed of 19.1 m/min, and a depth of cut of 0.60 mm. Cross-sectional metallography was used to measure the visibly plastically deformed zone (P-zone), Vickers microhardness profiles were used to assess near-surface microhardness and hardened-layer thickness, and arithmetic mean surface roughness (Ra) was measured. Representative P-zone depths were 8.5, 9.7, 10.9, and 21.6 µm under flood cooling and 6.0, 8.2, 10.7, and 11.0 µm under cryogenic cooling. Near-surface microhardness differed descriptively between cooling modes, with the magnitude varying by feed rate, while hardened-layer thickness showed an average descriptive difference of approximately 40%. Cryogenic Ra values were approximately 8%–23% lower across matched feeds. Auxiliary tests showed cryogenic roughness trends with cutting speed and depth of cut but lacked complete paired cooling-mode comparisons. Overall, the cryogenic gas-jet condition was associated with shallower visible deformation, retained near-surface hardening, and lower roughness within the tested process window. Microhardness and Ra values are reported as mean ± standard deviation from repeated measurements on one specimen per condition; these standard deviations reflect measurement repeatability rather than inter-specimen variability. Therefore, all comparisons are descriptive, and statistical significance cannot be assessed without independent machining replication.
Introduction
Titanium alloys combine high specific strength, corrosion resistance, and useful mechanical performance across a broad temperature range, thereby supporting their use in aerospace, energy, marine, and biomedical applications1,2,3,4. In highly loaded components, however, performance depends on more than bulk strength. The machined surface and the material immediately beneath it are the first regions exposed to contact, cyclic loading, fretting, erosion, and aggressive environments. Surface topography, plastically deformed microstructure, hardness gradients, residual damage, and other machining-induced changes can therefore influence where damage initiates and how it develops5,6,7,8. This near-surface region is commonly discussed through the broader concept of surface integrity or, when the emphasis is on machining-induced modification, as the surface-altered layer. Turning remains necessary to achieve the dimensions and surface conditions required in many titanium components, so process selection must account for both material-removal efficiency and the state left behind in the workpiece9,10. TC18 is a high-strength near-β titanium alloy used in lightweight, damage-tolerant, load-bearing structures11. Its alloy class and strength level distinguish it from Ti–6Al–4V, the α+β alloy that dominates the machining literature. Trends established for Ti–6Al–4V, therefore, provide useful hypotheses but cannot be assumed to transfer quantitatively to TC18. TC18-specific evidence is needed to determine how a practical turning process modifies the shallow subsurface and whether changes in cooling delivery are associated with shallower visible deformation without eliminating the hardness response.
The difficulty of machining titanium alloys arises from coupled thermal, mechanical, and tribological conditions in a small, rapidly renewed contact zone. Low thermal conductivity restricts heat flow away from the cutting edge, while affinity between titanium and common tool materials can promote adhesion and unstable tool–chip contact. Reviews consistently identify cutting temperature, contact stress, chip formation, tool condition, and surface integrity as mutually dependent outcomes rather than isolated variables12,13,14,15. Experimental and modeling studies likewise show that the final surface reflects competition between strain accumulation and temperature-dependent softening under transient loading16,17,18. Shear localization and segmented-chip formation add further spatial and temporal heterogeneity19,20,21. These studies provide a physical basis for expecting that both cutting parameters and coolant delivery influence the depth and mechanical character of the surface-altered layer, but they do not justify assigning a unique mechanism to an optical or hardness trend without direct evidence from temperature, force, tool condition, or crystallography. Feed rate is a particularly direct process variable because it changes the nominal undeformed chip thickness, the material engaged per revolution, and the feed marks left by the tool. Increasing feed can modify contact load, chip geometry, the strain imposed on the newly generated surface, and the geometrical contribution to roughness. Studies on Ti–6Al–4V have accordingly reported strong feed-related changes in surface morphology, roughness, and near-surface properties22,23. The magnitude and form of those responses nevertheless depend on alloy condition, tool geometry, cooling mode, and the tested process window, making a matched TC18 comparison more defensible than a universal feed law inferred from another alloy.
Cooling strategy provides a second route for modifying the cutting-zone boundary conditions. Surface-modification studies show that a shallow change in microstructure or mechanical properties can remain relevant even when no macroscopic damage is apparent24,25. Cryogenic and cryogenic-assisted machining have therefore been investigated as alternatives or supplements to conventional flood cooling. Comparative titanium studies have associated cryogenic assistance with reduced tool wear or roughness under certain turning and milling conditions26,27,28, while micromachining studies have reported improved burr control and surface quality29. Cooled-air-assisted lubrication can alter cutting force, tool degradation, and roughness, but the outcome depends on supplied temperature and the accompanying lubrication regime30. Studies using CO₂ and combined cooling-lubrication strategies further demonstrate that the response is alloy- and configuration-dependent31,32. Studies using vortex tube cooling with cold CO₂ gas have reported substantial reductions in cutting temperature (up to 35.6%) and surface roughness (up to 66.14%) during the turning of Ti6Al4V alloy, demonstrating that the cooling medium and delivery method can significantly influence surface quality. Collectively, this literature supports two points relevant to the present design. First, rapid heat extraction can affect several machining outcomes simultaneously, so a cooling strategy should be evaluated using multiple surface-integrity metrics. Second, the reported benefit cannot be detached from the medium and delivery system. Cryogenic cooling is not a single transferable treatment: medium, phase, temperature, pressure, impingement position, tool access, and lubrication all influence the comparison. Reviews consequently emphasize precise reporting of delivery conditions and interpretation of the tested material and process configuration33. The route examined here uses LN2 as a cold source and delivers a cryogenic N2 gas jet toward the rake-face tool-chip region. LN₂ at approximately −196 °C served as the cold source, while the measured N₂ gas-jet temperature before impingement was −169 °C. The recorded LN₂ consumption of 20 L over 7 min corresponded to approximately 3 L/min of liquid LN₂ consumption. Flood cooling contributes cooling, lubrication, and flushing, so the experiment evaluates the overall difference between two delivery modes and cannot separate thermal extraction from lubrication, jet momentum, or other interfacial effects.
This study establishes a reproducible comparison between two specific cooling-delivery configurations: the DRK-5011 flood system and the LN₂-derived cryogenic N₂ gas-jet system, with the nozzle, pressure, and delivery parameters specified in the Methods, during external turning of TC18. The primary experiment varies the feed rate at a fixed spindle speed and depth of cut, and measures three complementary elements of the surface-altered state: the depth of the visibly plastically deformed zone (P-zone), the near-surface microhardness profile and the derived hardened-layer thickness, and the arithmetic mean surface roughness (Ra). The P-zone and hardened-layer thickness are retained as separate endpoints because the former depends on an optical morphology boundary and the latter on recovery to the measured matrix hardness band. Two auxiliary cryogenic series vary cutting speed or depth of cut for roughness measurement only; their limited flood references are treated as isolated reference points rather than as complete paired series. A condition-by-condition paired design is appropriate for the available data because it preserves the direct contrast at each feed without implying an unmeasured interaction surface. It does not, however, estimate independent main effects across all parameters or identify a process optimum. The study also lacks a dry-machining group, a factorial or response-surface design, formal analysis of variance, cutting-force measurements, temperature–time histories, tool-wear measurements, or electron backscatter diffraction (EBSD) or transmission electron microscopy (TEM) characterization. Its contribution is therefore bound to the measured responses under the specified tool, material, cooling delivery, and process window, while providing quantitative observations and clearly framed hypotheses for a subsequent mechanism-resolving study. It was hypothesized that, under the matched turning conditions investigated here, the specified LN₂-derived cryogenic N₂ gas-jet condition would show distinct representative P-zone depths, near-surface microhardness profiles, hardened-layer thicknesses, and Ra values compared with flood cooling across the tested feed rates
Protocol
Workpiece material and cutting tool
An as-received TC18 near-β titanium-alloy bar with an initial diameter of 45 mm and a length of 275 mm was used. The batch-specific elemental composition of the tested TC18 bar is provided in Table 1 based on the supplier material certificate. Reference and batch-specific room-temperature mechanical properties are provided in Table 2. The material certificate for the tested bar is provided as Supplementary File 1. The bar was rigidly clamped in the same fixture arrangement for all conditions. External turning was performed with a WNMG080404-HL coated cemented carbide insert, while the same insert type, nominal geometry, holder orientation, and workpiece mounting were retained for both the flood and cryogenic trials. A freshly coated cemented carbide insert with an unused cutting edge was employed for each machining trial. No insert was reused across different cutting conditions. This ensured that the initial tool condition was consistent for all tests. Because the present study did not include a dedicated tool-wear analysis, progressive tool wear, including flank wear, crater wear, edge chipping, or built-up edge, was not quantitatively inspected or measured, as the objective of the study was to evaluate the surface-altered layer under defined initial tool conditions, not to compare tool life or wear behavior.
Table 1 reports the batch-specific elemental composition of the TC18 bar used in this study, with titanium as the balance. Table 2 reports the nominal room-temperature tensile strength, 0.2% proof stress, elongation at break, and reduction of area. These data located the workpiece within the strength range reported for TC18 and provided context for subsequent turning and hardness measurements; however, no batch-specific tensile test was performed in this study.
Cooling-system configuration and turning design
The turning tests were performed on a horizontal lathe equipped with the delivery system shown in Figure 1. The cryogenic system consisted of an LN2 storage vessel, an electric pump, a vaporization chamber, a pressure-control unit, connecting lines, and a dedicated nozzle. A T-type thermocouple was installed at the nozzle exit to measure the gas-jet temperature; the measured temperature 50 mm downstream of the nozzle exit, prior to impingement on the tool-chip region, was -169 °C. LN₂ at its nominal boiling temperature of approximately -196 °C served as the cold source; after vaporization, low-temperature N₂ gas was delivered toward the tool-chip contact region. The system adopted cryogenic-medium jet spraying to improve operational stability and safety of the cryogenic cutting system. The nozzle had a conical straight configuration with an outlet diameter of 2 mm. The jet was oriented nominally perpendicular to the rake face (90 degrees), and the nozzle end face was positioned 50 mm from the tool tip. A pressure gauge was installed between the pressure-control unit and the nozzle inlet; the supply pressure was maintained at 0.16 MPa ± 0.01 MPa during cutting. The system used a pressure-stabilizing device to suppress operational pressure fluctuations.
Continuous consumption of 20 L of LN2 over 7 min corresponded to an LN2 consumption rate of approximately 3 L/min. This value was treated as a liquid-consumption rate, not as the volumetric flow rate of the vaporized gas. The gas-jet arrangement was selected to reduce liquid retention and splashing near the cutting zone while providing a fixed impingement location. It was not compared directly with liquid impingement in the present experiment. LN₂ and cryogenic N₂ gas can cause severe cold burns and may displace oxygen in poorly ventilated areas. The delivery system was operated only in a well-ventilated area, while a face shield or safety goggles, insulated cryogenic gloves, a lab coat, long pants, and closed-toe shoes were worn, and institutional cryogenic-liquid handling procedures were followed.
For the primary paired experiment, the spindle speed was set to 135 r/min. At the initial workpiece diameter of 45 mm, this corresponded to a nominal cutting speed of approximately 19.1 m/min; it was identified as the initial-diameter value because the surface speed changed with the instantaneous diameter. The axial depth of cut (ap) was set to 0.60 mm, and feed rates (f) of 0.10, 0.15, 0.20, and 0.26 mm/rev were tested under both cooling modes.
For flood cooling, DRK-5011 semi-synthetic cutting fluid was diluted with water to a concentration of 5% (volume fraction) and delivered at 20 ± 2 °C via a temperature-controlled coolant circulation system. The coolant was supplied by a centrifugal pump with a rated flow rate of 20 L/min at a pump outlet pressure of 0.16 MPa; the nozzle outlet flow rate was measured at 20 L/min using a flowmeter installed in the delivery line. A single-round nozzle with an outlet diameter of 2 mm was used, oriented at a 30° angle to the rake face and positioned at a stand-off distance of 10 mm from the cutting zone. The flood coolant was applied continuously during each cutting pass, and the delivery conditions (flow rate and pressure) were verified before each test.
For cryogenic cooling, the fixed gas-jet configuration described above was used, and the pressure and delivery conditions were verified before cutting. The spindle setting, depth of cut, tool type, nominal geometry, workpiece mounting, and nozzle position were kept unchanged when pairing the modes. These eight feed-by-cooling conditions formed the matched dataset for P-zone depth, near-surface microhardness, hardened-layer thickness, and Ra.
The experiments were arranged by cooling mode: all flood-cooling trials were performed first at the four feed rates from low to high, followed by all cryogenic-cooling trials; within each cooling mode, the feed-rate order was from low (0.10 mm/rev) to high (0.26 mm/rev). This order was chosen for operational convenience, but it was not fully randomized. Because a fresh insert was used for each trial, the accumulated cutting time or distance before each test was zero, meaning that each trial started with an unworn edge. Every change in cutting condition, whether feed rate or cooling mode, was accompanied by a new insert with a fresh cutting edge.
For the auxiliary roughness series, cryogenic cutting speeds of 10.6, 14.1, and 19.1 m/min were tested at f = 0.15 mm/rev and ap = 0.60 mm. Separately, cryogenic depths of cut of 0.40, 0.60, 0.80, and 1.00 mm were tested at vc = 19.1 m/min and f = 0.15 mm/rev. Since flood measurements were only available for the baseline conditions of the present test, these datasets were analyzed to identify trends in cryogenic-mode results alongside discrete matched reference points, rather than via factorial design, interaction analysis, or response-surface experimental approaches. The cutting parameters and coolant-delivery conditions for the primary paired experiment and auxiliary cryogenic roughness tests are summarized in Table 3.
Table 3: Turning parameters and coolant-delivery conditions. Cutting parameters and the corresponding cooling conditions used in the primary paired feed-rate experiment are summarized. Please click here to download this Table.
Specimen preparation and surface characterization
After turning, 10 mm x 10 mm x 5 mm specimens were removed using wire electrical discharge machining so that the prepared cross-section included the machined surface and was aligned with the machining direction. An equivalent orientation was used for all conditions. Each specimen was resin-mounted, the cross-section was progressively ground, and it was polished to a mirror finish using the same preparation sequence throughout. Rounding at the machined edge was minimized because loss of the free-surface boundary could bias a depth measurement on the micrometer scale.
The polished cross-section was etched for 45 s with Kroll's reagent containing 2 vol% HF, 4 vol% HNO₃, and 94 vol% H₂O34, then rinsed and dried immediately. Kroll's reagent contains HF and HNO₃; HF is highly toxic and corrosive, and HNO₃ is strongly corrosive and oxidizing. The reagent was prepared, used, and disposed of only in a certified chemical fume hood, in accordance with approved institutional chemical safety procedures, using acid-resistant gloves, eye/face protection, and appropriate laboratory personal protective equipment.
The near-surface region was examined with a metallographic microscope at 500x magnification, using comparable illumination and contrast. The microscope was equipped with a 20-megapixel USB3.0 camera. Prior to measurement, pixel-to-length calibration was performed using a stage micrometer at the same magnification. Images were analyzed using Image analysis software.
The machined edge was surveyed before selection of the representative field, and preparation scratches, pull-out, and rounded-edge artifacts were excluded from boundary placement. The P-zone was defined as the band containing continuous, elongated, fibrous, or flow-like features, and its lower boundary was placed where these features disappeared, and matrix morphology was recovered. Depth was measured perpendicular to the surface. For each machining condition, at least three representative fields of view were examined along the cross-section. The P-zone boundary was delineated independently by two trained operators, and the reported depth values represented the mean of repeated measurements; where discrepancies exceeded 5%, the images were re-examined jointly to reach a consensus. The measurement uncertainty of the P-zone depth was estimated from the standard deviation of repeated boundary placements across multiple fields.
Vickers microhardness testing was performed on the polished cross-section with an HVS-1000Z tester at 50 gf (approximately 0.49 N) and a dwell time of 15 s. The first indentation was placed at the center, approximately 10 µm below the machined surface, and measurements continued at 10 µm depth intervals. This step size defined a depth resolution of ±10 µm for determining the hardened-layer thickness. In the transition region, where the measured hardness approached the matrix band (within 15 HV of the band limits), additional indentations were made at 5 µm intervals to improve the resolution of the boundary location. Given the 10 µm measurement step, the uncertainty in the reported hardened-layer thickness was conservatively estimated at ±10 µm, unless refined by the 5 µm measurements in the transition zone.
The first indentation center was positioned approximately 10 µm below the machined surface. With a test load of 50 gf and expected hardness values of approximately 376–446 HV, the estimated indentation diagonal was approximately 14.4–15.7 µm. According to ISO 6507-1, the distance from the indentation center to the specimen edge should be at least 2.5 times the mean diagonal length (approximately 38 µm). The 10 µm edge distance used in this study did not meet this requirement; therefore, the near-surface hardness values were interpreted as qualitative indicators of the hardness trend rather than as absolute measurements.
At each target depth, five separate indentations were made at laterally offset positions approximately 30 µm apart, and the mean value and standard deviation at each depth were derived from these five indentations. These five indentations represented spatial variation within a single cross-section. One metallographic cross-section was prepared from a single machined specimen per cutting condition (feed rate and cooling mode). Therefore, the standard deviation of the measured specimen hardness reflects the variation among five indentations on the same specimen, rather than the difference between different specimens. One specimen was machined for each cutting condition, and one cross-section was prepared from each specimen for metallographic observation and microhardness testing. The Vickers microhardness measurement layout is shown in Figure 2.
The matrix-hardness reference band of HV 376–388 was established by measuring the hardness at depths greater than 200 µm from the machined surface, where the hardness profile had stabilized. At each of five depths (separated by 20 µm) in this stable region, five independent indentations were made, yielding a total of 25 measurements. The matrix band was defined as the mean ± 2 standard deviations (HV 376–388), with a nominal central value of HV 384. Measurements were continued until the profile returned to the measured matrix-hardness band of HV 376–388, with a nominal center of HV 384. Hardened-layer thickness was defined as the first depth at which the profile returned to and remained within this measured band.
Surface roughness measurements were performed using a confocal microscope. This instrument was a non-contact optical measurement device that used a violet semiconductor laser at 405 nm as the light source. The vertical measurement accuracy was 0.05 nm, and the horizontal repeatability at the 3σ level was 10 nm. Roughness parameters were calculated from two-dimensional height data acquired by the confocal optical system. The evaluation length was 4.0 mm with a cutoff wavelength of 0.8 mm and a Gaussian filter, in accordance with ISO 4287.
For each specimen, five distinct measurement positions were examined on the machined surface. The mean and standard deviation were calculated from these five measurements. The measurement direction was perpendicular to the feed marks, i.e., along the cutting direction. The same acquisition procedure, sampling direction, instrument settings, and evaluation length were used for all specimens being compared. The paired feed experiment and the two auxiliary series were kept separate during roughness data collection. One specimen was machined per cutting condition, and the reported standard deviations represented measurement repeatability across five positions on that single specimen, rather than variation across independently machined specimens.
Near-surface microhardness and Ra were reported descriptively as mean ± SD where available, and P-zone depth and hardened-layer thickness were reported as descriptive depth values unless independent replicate-level measurements could be recovered.
Results
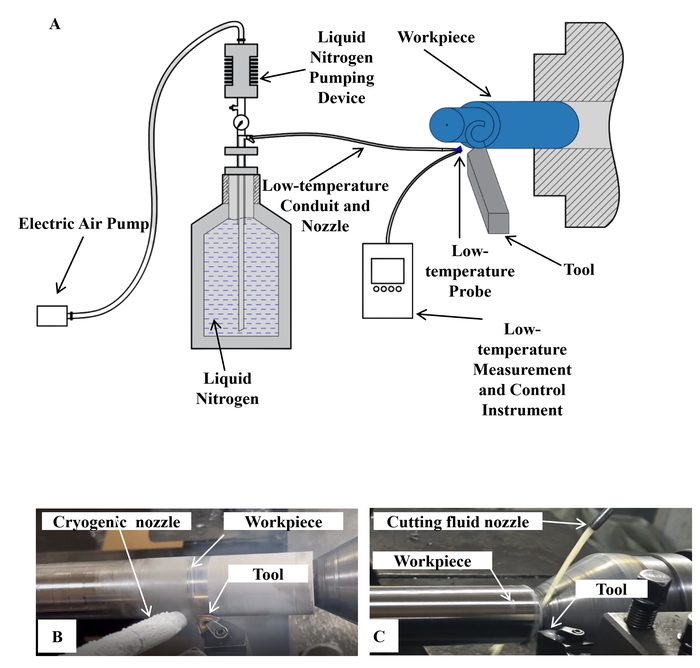
Figure 1: Experimental apparatus and coolant-delivery configurations used for
turning TC18 titanium alloy. (A) LN₂-derived cryogenic N₂ gas-jet system,
including the LN₂ reservoir, electric pump, delivery line, temperature probe, workpiece, and cutting tool.
(B) Cryogenic N₂ gas-jet nozzle directed toward the tool–chip contact region.
(C) Flood delivery of DRK-5011 semi-synthetic cutting fluid to the cutting zone. Please click here to view
a larger version of this figure.
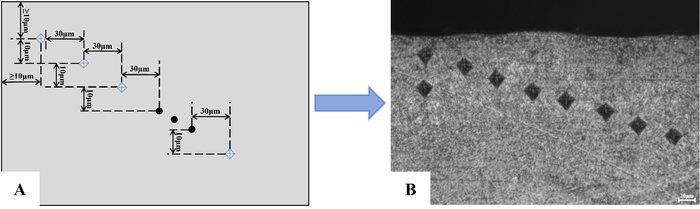
Figure 2: Vickers microhardness measurement layout and representative
indentation field in a polished TC18 cross-section. (A) Vickers microhardness
measurement layout. (B) Representative indentation field. The first indentation center was
approximately 10 µm below the machined surface, successive target depths were separated by 10 µm, and
adjacent impressions were offset laterally by approximately 30 µm. At each target depth, five separate
indentations were made at laterally offset positions, and the mean value at each depth was derived from these five
indentations. Scale bar = 20 µm. Please click here to view a larger version of this figure.
Plastically deformed zone
Cross-sectional micrographs first identified the visibly altered region immediately below the turned surface. Under flood cooling with semi-synthetic cutting fluid at 20 °C, each section contained a shallow band in which microstructural features were elongated and aligned approximately parallel to the machined surface (Figure 3). The boundary between this flow-like morphology and the underlying matrix was delineated in the micrographs, and the perpendicular distance from the machined surface to that boundary was reported as the P-zone depth. This optical quantity records the depth over which visible deformation features could be distinguished in the prepared section; it is not equivalent to the full depth of machining-induced strain. At feed rates of 0.10, 0.15, 0.20, and 0.26 mm/rev, the flood-cooled representative P-zone depths were 8.5, 9.7, 10.9, and 21.6 µm. The first three measurements increased in 1.2 µm steps, whereas the change from 0.20 to 0.26 mm/rev was 10.7 µm. Thus, most of the total 13.1 µm rise observed across the tested range occurred at the highest feed rate. The four-condition mean was 12.68 µm, but it is only a summary of the four displayed conditions and not a pooled replicate-level estimate.
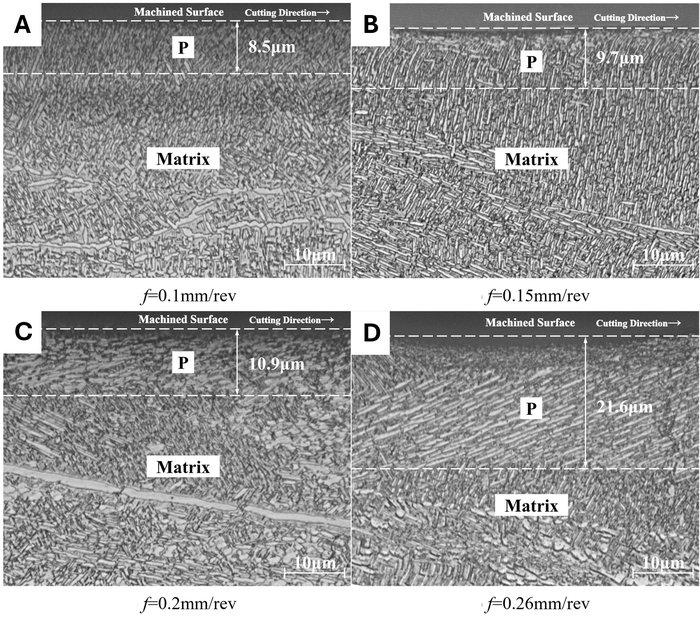
Figure 3: Near-surface microstructures of TC18 after turning under flood
cooling with DRK-5011 semi-synthetic cutting fluid at 20 °C. (A) Feed rates of
0.10 mm/rev. (B) Feed rates of 0.15 mm/rev. (C) Feed rates of 0.20 mm/rev.
(D) Feed rates of 0.26 mm/rev. The nominal cutting speed was 19.1 m/min, and the axial depth of cut
was 0.60 mm. Arrows indicate the cutting direction and the machined surface. Dashed lines delimit the visibly
plastically deformed zone (P-zone), and numerical labels indicate its depth from the machined surface. Scale bars =
10 µm. The micrographs shown are representative views selected from multiple fields of view examined in a
single cross-section for each cutting condition. The reported P-zone depths represent the mean of measurements from
at least three fields of view. Please click here to view a larger version of this figure.
The cryogenic N₂ gas-jet sections also contained a visibly deformed band, but its depth was 6.0, 8.2, 10.7, and 11.0 µm at the same four feed rates (Figure 4). Successive changes within this series were 2.2, 2.5, and 0.3 µm, producing a total range of 5.0 µm and a four-condition mean of 8.98 µm. Relative to flood cooling at each matched feed, cryogenic cooling was associated with a reduction in the annotated P-zone depth of approximately 29%, 15%, 2%, and 49%; the absolute differences were 2.5, 1.5, 0.2, and 10.6 µm. The separation between modes was therefore condition-dependent: it was almost absent at 0.20 mm/rev but largest at 0.26 mm/rev. Across the four displayed settings, the difference between the mode-specific means was 3.70 µm, equivalent to 29% of the flood mean. Because only a single machined specimen was evaluated per condition and replicate-level optical measurements with a pooled dispersion estimate were not available, all condition-specific and mean comparisons above are descriptive. Measurement-level repeatability (≥3 fields per condition, two independent boundary delineations, standard deviations from repeated placements) was used to gauge annotation scatter, but this does not represent inter-specimen variability. In particular, the 0.2 µm difference at 0.20 mm/rev is within the measurement uncertainty and cannot be treated as evidence of a reproducible cooling effect without additional sections and independent measurements.
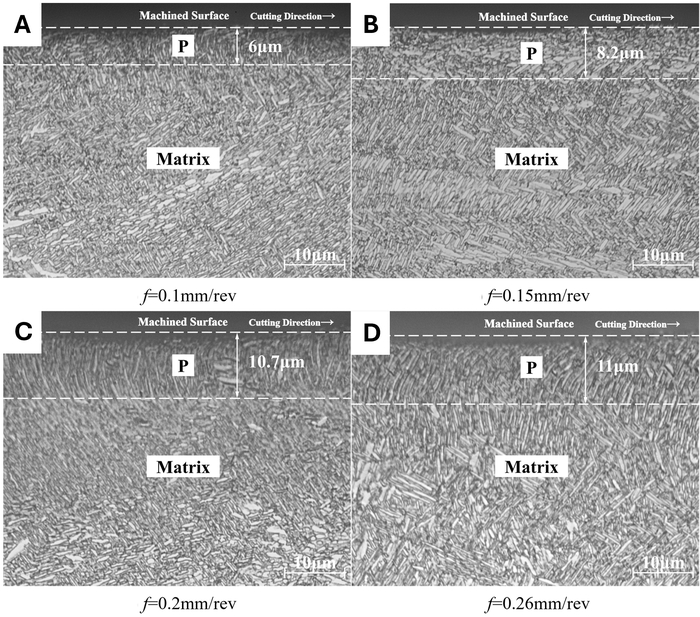
Figure 4: Near-surface microstructures of TC18 after turning under
LN₂-derived cryogenic N₂ gas-jet cooling. (A) Feed rates of 0.10 mm/rev.
(B) Feed rates of 0.15 mm/rev. (C) Feed rates of 0.20 mm/rev. (D)
Feed rates of 0.26 mm/rev. The nominal cutting speed was 19.1 m/min, and the axial depth of cut was 0.60 mm. Arrows
indicate the cutting direction and the machined surface. Dashed lines delimit the visibly plastically deformed zone
(P-zone), and numerical labels indicate its depth from the machined surface. Scale bars = 10 µm. The
micrographs shown are representative views selected from multiple fields of view examined in a single cross-section
for each cutting condition. The reported P-zone depths represent the mean of measurements from at least three fields
of view. Please click here
to view a larger version of this figure.
The representative cryogenic P-zone depth was numerically below the flood value at every feed, but the magnitude of the difference did not vary monotonically with feed. The flood series rose sharply at the final setting, whereas the cryogenic series changed only from 10.7 to 11.0 µm over the range 0.20 to 0.26 mm/rev. The images, therefore, show a feed-dependent numerical pattern rather than a constant percentage benefit or a statistical interaction. Moreover, the visible boundary does not quantify temperature, force, residual stress, crystallographic defect density, or the strain remaining beyond the optically recognizable band. Those quantities require separate measurements and are considered only as possible explanations in the Discussion.
Near-surface microhardness and hardened-layer thickness
Microhardness profiles were measured from approximately 10 µm below the machined surface toward the matrix (Figure 5). Across the conditions, the highest values occurred in the near-surface region, after which the profiles approached the measured matrix-hardness band of HV 376–388 (nominal center, HV 384). Under flood cooling, near-surface microhardness was 407.33 ± 2.52, 411.00 ± 4.58, 416.67 ± 4.51, and 424.67 ± 2.52 HV as feed increased from 0.10 to 0.26 mm/rev. Corresponding cryogenic values were 414.67 ± 3.79, 445.67 ± 3.51, 420.33 ± 5.77, and 429.33 ± 5.86 HV. These standard deviations were derived from five indentations at each depth on a single cross-section per cutting condition, reflecting spatial variation within that section rather than variation across independently machined specimens. The paired cryogenic-minus-flood differences were 7.34, 34.67, 3.66, and 4.66 HV. The largest surface value, 445.67 ± 3.51 HV, occurred at 0.15 mm/rev under cryogenic cooling; because the cryogenic series was non-monotonic, it is reported as the largest observed mean rather than an optimum. Averaging the four feed-rate means gave 414.92 HV under flood cooling and 427.50 HV under cryogenic cooling, a descriptive difference of approximately 3%. Most of that mean separation arose from the 34.67 HV difference at 0.15 mm/rev, whereas differences at 0.20 and 0.26 mm/rev were below 5 HV. Relative to the flood value at the same feed, the surface-hardness differences were approximately 1.80%, 8.44%, 0.88%, and 1.10%. This distribution illustrates why the four-condition mean should not be described as a uniform 3.03% increase across all feeds. All eight surface values were above the nominal matrix center of HV 384, but the depth profiles, rather than the first point alone, were required to determine how far the mechanical response extended below the surface.
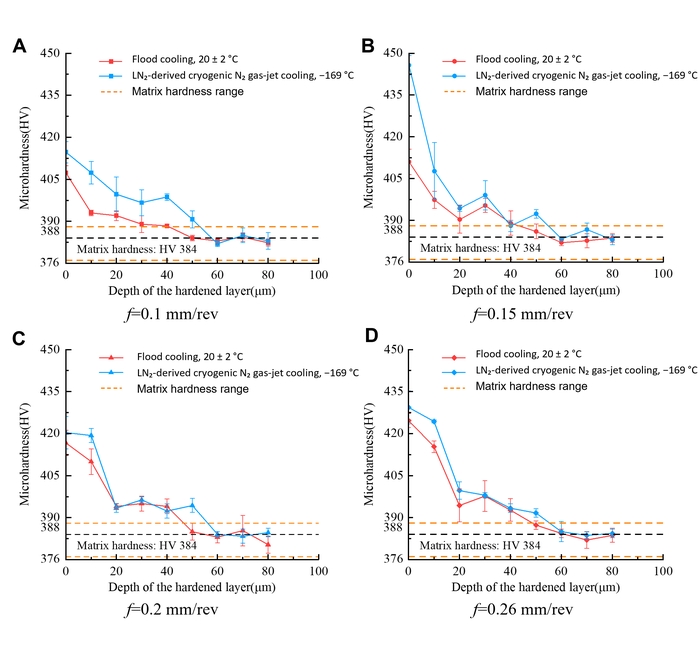
Figure 5: Near-surface microhardness profiles of TC18 under flood and
cryogenic N₂ gas-jet cooling. Microhardness profiles as a function of depth below the machined
surface at feed rates of (A) 0.10 mm/rev, (B) 0.15 mm/rev, (C)
0.20 mm/rev, and (D) 0.26 mm/rev. The nominal cutting speed was 19.1 m/min, and the axial depth of
cut was 0.60 mm. The first indentation center was positioned approximately 10 µm below the machined surface.
Error bars indicate the SD calculated from five indentations at each depth on a single cross-section for each
cutting condition and therefore represent measurement repeatability rather than variation among independently
machined specimens. The matrix-hardness reference band ranged from HV 376 to 388, with a nominal central value of HV
384. Please click here to
view a larger version of this figure.
Hardened-layer thickness was derived from the depth at which each profile returned to and remained within the measured matrix band (Table 4). Under flood cooling, the values were 30, 20, 50, and 50 µm at feed rates of 0.10, 0.15, 0.20, and 0.26 mm/rev, respectively. With a measurement step of 10 µm, these values carry an uncertainty of approximately ±10 µm. Under cryogenic cooling, the respective values were 50, 40, 60, and 60 µm (±10 µm). Averaging the four feed-rate values gave 37.5 µm under flood cooling and 52.5 µm under cryogenic cooling, a descriptive increase of approximately 40% rather than a precise 40.0%. Given the ±10 µm uncertainty, the effective ranges overlap considerably; the observed difference should therefore be interpreted as a trend rather than a precisely quantified effect. The optical P-zone and the hardness-defined layer did not vary in parallel, as expected from their definitions. P-zone depth ends where visible flow-like morphology is no longer distinguishable, whereas hardened-layer thickness ends where the mechanical profile returns to the matrix band. A shallower P-zone can therefore coexist with a thicker hardness response without contradiction. On a condition-by-condition basis, the thickness differences corresponded to descriptive increases that varied substantially with feed and, given the ±10 µm uncertainty, should be interpreted as qualitative trends rather than precise percentages. These percentages varied substantially with feed and do not support a feed-independent effect size.
Table 4: Surface-integrity metrics of TC18 under different cooling conditions. Near-surface microhardness, hardened-layer thickness, representative P-zone depth, and surface roughness are summarized for flood cooling and LN₂-derived cryogenic N₂ gas-jet cooling across the tested feed rates. Near-surface microhardness and Ra are reported as mean ± SD where available, whereas hardened-layer thickness and representative P-zone depth are reported as descriptive depth values. Please click here to download this Table.
Surface roughness
The complete matched feed-rate roughness comparison is listed in Table 4, with each value representing the mean and standard deviation from five measurement positions per specimen. Under flood cooling, Ra was 1.099 ± 0.100, 1.635 ± 0.120, 2.815 ± 0.130, and 3.529 ± 0.180 µm at feeds of 0.10, 0.15, 0.20, and 0.26 mm/rev. Under cryogenic cooling, the corresponding values were 0.841 ± 0.070, 1.304 ± 0.200, 2.491 ± 0.150, and 3.245 ± 0.250 µm. These standard deviations were calculated from five measurement positions on a single specimen per cutting condition and therefore represent measurement repeatability rather than specimen-to-specimen variation. Ra increased with feed in both series, and the cryogenic value was lower at each matched setting. Absolute differences were 0.258, 0.331, 0.324, and 0.284 µm, corresponding to descriptive relative differences of approximately 23%, 20%, 12%, and 8%. Thus, the absolute separation remained within a relatively narrow range, whereas the percentage reduction became smaller as the overall roughness level increased. Means and reported SDs are presented as supplied; without a documented inferential analysis, the between-mode differences remain descriptive. The similarity of the absolute reductions, despite the rising baseline Ra, explains the decline in relative percentage. From 0.10 to 0.26 mm/rev, flood-cooled Ra increased by 2.430 µm and cryogenic Ra by 2.404 µm. Thus, the primary feed-related rise was of comparable magnitude in the two series, while the cryogenic sequence remained offset toward lower values throughout the tested range.
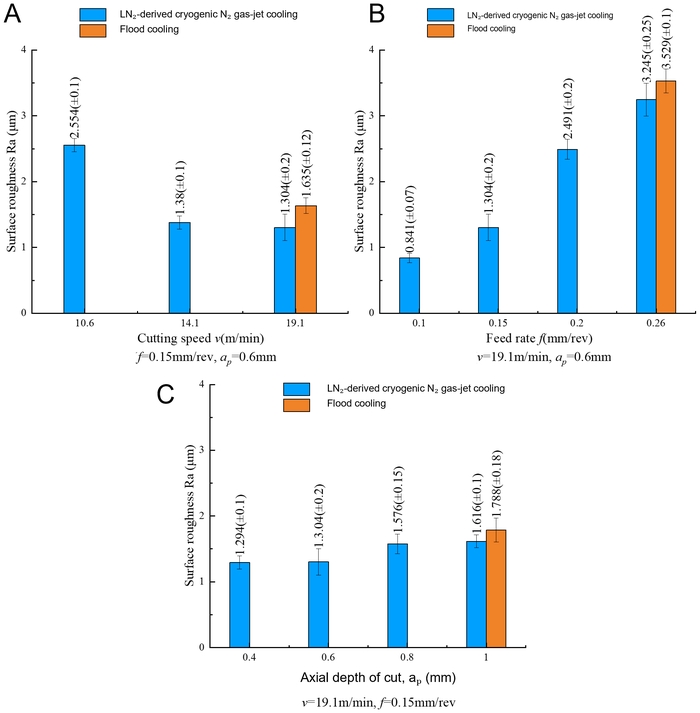
Figure 6: Arithmetic mean surface roughness of TC18 under flood and cryogenic
N₂ gas-jet cooling. Arithmetic mean surface roughness (R-a) as a function of (A)
cutting speed at f = 0.15 mm/rev and ap = 0.60 mm, (B) feed rate at
v₍c₎ = 19.1 m/min and ap = 0.60 mm, and (C) axial depth of cut
at v₍c₎ = 19.1 m/min and f = 0.15 mm/rev. Each panel shows the LN₂-derived
cryogenic N₂ gas-jet series together with the available flood-cooling reference: v₍c₎ =
19.1 m/min in (A), f = 0.26 mm/rev in (B), and ap = 1.00
mm in (C). The absence of a flood-cooling bar at other settings indicates that the corresponding
flood-cooling measurements were unavailable, not that the roughness was zero. Error bars indicate the SD calculated
from five measurement positions on a single specimen per cutting condition and represent measurement repeatability
rather than specimen-to-specimen variation. Please click here to view a larger version of this figure.
Figure 6 places the feed-rate series alongside two auxiliary single-factor cryogenic series. At cutting speeds of 10.6, 14.1, and 19.1 m/min, with f = 0.15 mm/rev and ap = 0.60 mm, cryogenic Ra was 2.554 ± 0.100, 1.380 ± 0.100, and 1.304 ± 0.200 µm. A flood reference was available only at 19.1 m/min, where Ra was 1.635 ± 0.120 µm. The speed panel, therefore, supports one matched comparison and a within-cryogenic trend, not a comparison across the complete speed range. At depths of cut of 0.40, 0.60, 0.80, and 1.00 mm, with vc = 19.1 m/min and f = 0.15 mm/rev, cryogenic Ra was 1.294 ± 0.100, 1.304 ± 0.200, 1.576 ± 0.150, and 1.616 ± 0.100 µm. The available flood reference at 1.00 mm was 1.788 ± 0.180 µm, 0.172 µm above the cryogenic value at the same setting. Flood bars were unavailable at the other three depths. The feed panel itself displays the cryogenic series and one flood reference bar at 0.26 mm/rev, whereas Table 4 contains the complete paired feed dataset. Omitted bars denote unavailable measurements rather than zero roughness. Taken together, the main dataset showed lower P-zone depth and Ra, but higher near-surface microhardness and hardened-layer thickness, under cryogenic cooling. The auxiliary series extends the description of Ra but cannot support a general cross-mode comparison. Across the cryogenic speed series, Ra showed a within-series decrease of 1.250 µm (48.9%) from 10.6 to 19.1 m/min; at the single matched point at 19.1 m/min, it was 20.2% below the flood reference. Across the cryogenic depth series, Ra showed a within-series increase of 0.322 µm (24.9%) from 0.40 to 1.00 mm; at the matched 1.00 mm point, it was 9.6% below the flood reference. These endpoint calculations summarize the observed within-cryogenic trends, but because flood references are available only at the endpoints, they cannot be interpreted as suggesting a cooling advantage across the full speed or depth range.
Data availability
The raw data generated and analyzed during this study, including surface roughness measurements, microhardness profiles, and metallographic images, have been deposited in the Science Data Bank (https://www.scidb.cn) under DOI: https://doi.org/10.57760/sciencedb.0115i.
Table 1: Batch-specific elemental composition of the TC18 titanium alloy used in this study. Values were obtained from the supplier material certificate for the TC18 bar used in the experiments (Certificate No. 20250268). Ti was reported as the balance. Please click here to download this Table.
Table 2: Room-temperature mechanical properties of TC18 titanium alloy. Supplier standard values are presented alongside the batch-specific mechanical-property values reported in the material certificate for the TC18 bar used in this study. Please click here to download this Table.
Supplementary File 1. Material certificate for the TC18 titanium alloy used in this study. Supplier-issued quality certificate for the TC18 titanium bar used in the experiments (Certificate No. 20250268; Shaanxi Huachen Titanium Co., Ltd.). The certificate provides batch-specific values for chemical composition, tensile strength, yield strength, elongation, reduction of area, and hardness for the tested material.Please click here to download this file.
Discussion
The main comparison revealed a coordinated but non-identical set of surface-integrity responses. Relative to flood cooling, the specified cryogenic N₂ gas jet was associated with a shallower optically delineated P-zone and lower Ra at every matched feed, while near-surface microhardness and hardened-layer thickness were numerically higher. These observations should be considered together, but they should not be collapsed into a single claim that cryogenic cooling simply reduced or increased the surface-altered layer. The optical measurement records where visible flow-like features end, the hardness profile records where a mechanical property returns to the matrix band, and Ra records height variation along the external surface. Their different responses indicate that the depth, mechanical state, and topography of the altered layer were not governed by one interchangeable metric. The strongest evidence comes from the paired feed-rate dataset; the auxiliary speed and depth series broaden the descriptive context for roughness but cannot carry the same comparative weight because most settings lack a matched flood value.
Feed-dependent P-zone depth provides the clearest example of condition specificity. A higher feed increases the nominal undeformed chip thickness and can alter the mechanical and contact conditions in titanium cutting, consistent with studies showing feed-rate effects on surface integrity and topography22,23. The flood P-zone increased gradually from 8.5 to 10.9 µm between 0.10 and 0.20 mm/rev and then rose to 21.6 µm at 0.26 mm/rev. Under cryogenic cooling, it increased from 6.0 to 10.7 µm over the first three feeds but changed only to 11.0 µm at the highest feed. One plausible interpretation is that the gas jet may have had limited near-surface thermal exposure or modified contact conditions at the highest feed rate. This is consistent with the established thermo-mechanical sensitivity of titanium machining12,15,17,18,19,20,21, but it was not tested directly. Cutting-zone temperature, force, chip contact, and interfacial behavior were not measured. Moreover, the mode difference was only 0.2 µm at 0.20 mm/rev, and no inter-specimen P-zone SD was available.
The hardness data raise a related but physically distinct question. The largest observed near-surface microhardness value, 445.67 ± 3.51 HV, occurred at f = 0.15 mm/rev under cryogenic cooling. This value was notably higher than the flood-cooling value at the same feed (411.00 ± 4.58 HV), representing a difference of 34.67 HV. One possible explanation is that the combination of the cryogenic gas jet and the specific undeformed chip thickness at this feed rate produced a thermo-mechanical condition that maximized strain hardening while minimizing thermal softening. At lower feeds, the strain imposed on the newly generated surface may have been insufficient to produce the same degree of hardening. At higher feeds, the increased heat generation may have partially counteracted the hardening effect through temperature-assisted recovery or softening, even with cryogenic cooling. However, this explanation remains speculative because cutting-zone temperature, cutting forces, and dislocation density were not measured. Cryogenic cooling was associated with a higher mean near-surface microhardness and a thicker hardness-defined layer, even though the visible P-zone was shallower. However, the overall mean difference was dominated by the large difference at 0.15 mm/rev, whereas the differences at 0.20 and 0.26 mm/rev were substantially smaller. Reduced thermal exposure could limit temperature-assisted softening or relaxation, allowing machining-induced hardening to remain detectable after visible flow-like morphology had disappeared. Previous cryogenic titanium studies likewise report changes in roughness, subsurface hardness, and other surface-integrity attributes, although direction and magnitude depend on material, medium, and delivery strategy26,27,28,29,30,31,32. In the present study, however, this explanation remains a hypothesis. No temperature history or direct defect-structure measurement was available, and optical microscopy cannot determine dislocation density, recovery, grain refinement, or phase-level changes. The cryogenic near-surface hardness series was non-monotonic across the tested feed range, and the 0.15 mm/rev condition should therefore be reported as the largest observed mean rather than an optimized condition. Furthermore, with a measurement step of 10 µm, the hardened-layer thickness values carry an uncertainty of ±10 µm, meaning that the reported ranges for flood cooling (20–50 µm) and cryogenic cooling (40–60 µm) overlap considerably. The observed differences between cooling modes should therefore be interpreted as a trend rather than a precisely quantified effect.
The roughness results are consistent with a strong contribution from feed-related surface formation. Ra increased from 1.099 to 3.529 µm under flood cooling and from 0.841 to 3.245 µm under cryogenic cooling as feed increased, in the same direction as prior reports that identify feed as an important determinant of titanium-alloy surface topography22,23. Although the absolute mode difference remained near 0.3 µm, its relative magnitude decreased from approximately 23% to 8% across the tested feed range. These numerical differences are descriptive and do not imply statistical significance, as independent replication of machining was not performed. One possible explanation is that the feed-associated geometric and material-displacement contributions become a larger fraction of the total Ra at higher feed, leaving less relative scope for a cooling-associated change. Another is that the gas jet modifies adhesion, chip evacuation, or secondary contact with the new surface. Such tribological explanations are plausible in titanium machining9,10,12,13,14,32, but built-up edge, tool wear, vibration, and chip morphology were not measured, and the alternatives cannot be distinguished. The speed and depth panels require particular restraint: they should be interpreted as cryogenic N₂ gas-jet trends with a single flood-cooling reference condition, rather than as complete cross-mode comparisons.
The present observations, therefore, represent a comparison between the specific DRK-5011 flood system and the LN₂-derived gas-jet system as configured in this study, rather than a generic comparison between flood and cryogenic cooling across all possible delivery conditions. Cooling-delivery details are central to comparison with earlier work. The present system used LN2 as a cold source and delivered a cryogenic N2 gas jet toward the cutting zone; it did not apply LN2 directly as a free liquid stream. LN₂ at approximately −196 °C served as the cold source, while the measured N₂ gas-jet temperature before impingement was −169 °C. Liquid LN₂ consumption was approximately 3 L/min, based on 20 L consumed over 7 min. Prior studies have examined liquid-nitrogen delivery, cooled air, CO2 snow, minimum-quantity-lubrication combinations, and other cryogenic arrangements26,27,28,29,30,31,32. Their outcomes cannot be quantitatively transferred because cooling capacity, impingement, lubrication, and chip-coolant interaction differ across systems. Flood cooling also provides lubricating and flushing functions that an N2 gas jet may not provide. The observed contrasts may therefore reflect a combination of heat extraction, fluid lubrication, jet momentum, and chip removal rather than temperature alone. The use of vaporized gas was motivated by stable delivery and reduced liquid retention or splashing, but the present experiment did not compare gas and direct-liquid delivery. No heat-transfer coefficient or complete temperature-time curve was obtained, so the thermal boundary condition is operationally described rather than fully quantified. The present observations, therefore, extend the cryogenic-machining literature to a defined TC18 gas-jet implementation rather than reproducing a generic LN2 comparison. The value of this specificity is methodological: another laboratory can reproduce the nominal pressure, nozzle geometry, stand-off, orientation, cold source, and consumption rate, and can then test whether the same condition-dependent surface responses persist with complete replication and metrology. These observations may be relevant to process selection for turning TC18 components in aerospace and other high-load applications in which near-surface integrity and roughness are important. The defined cryogenic N₂ gas-jet configuration also provides a reproducible experimental basis for future studies evaluating surface integrity and subsequent component performance.
Several design and reporting limitations define the evidential boundary. The most important limitation is the absence of independent machining replication. All comparisons are descriptive, and statistical significance cannot be assessed because machining-condition variability cannot be distinguished from measurement variability without independent replicates. The main experiment varied one factor and did not provide a factorial or response-surface analysis of interactions among cutting speed, feed, depth of cut, and cooling mode. The auxiliary speed and depth series each contain only one flood reference. Optical P-zone values are representative measurements without an inter-specimen SD, and operator blind measurements were not formally documented in the original experiment; future studies should incorporate a formal blind repeatability assessment. Representative images alone cannot establish the reproducibility of micrometer-scale boundary measurements; future studies should include multiple independently machined specimens and multiple cross-sections per condition to provide a robust assessment of reproducibility. And the near-surface hardness measurements were performed with the first indentation center approximately 10 µm below the machined surface. As noted in the Methods section, this edge distance does not satisfy the ISO 6507-1 requirement of at least 2.5 times the indentation diagonal (approximately 38 µm) from the specimen edge. The near-surface hardness values should therefore be interpreted as qualitative indicators of the hardness trend rather than as absolute measurements. Future studies should consider using a lower indentation load, Knoop microhardness testing, or a different near-surface measurement strategy to comply with ISO 6507-1 requirements for edge distance. Inferential testing was not considered valid because independent experimental replication was unavailable; therefore, all differences remain descriptive. Temperature histories, cutting forces, chip morphology, residual stress, and fatigue response were not measured. Although progressive tool wear was not a confounding factor in this study because a fresh cutting edge was used for each trial, detailed quantification of wear was not performed. Optical microscopy and hardness profiles were not complemented by EBSD or TEM. These omissions do not negate the condition-specific observations, but they preclude causal attribution and generalization beyond TC18, the stated tool-and-nozzle arrangement, and the tested process window. A follow-up study should use a structured multivariable design to estimate main effects and interactions35, include complete flood and dry controls, and incorporate independent spatial and specimen replication. Synchronous temperature and force acquisition, tool-state and chip assessment, residual-stress measurement, and crystallographic characterization would test the proposed thermal and tribological pathways before wear or fatigue implications are claimed.
This study established a defined comparison of flood cooling and LN₂-derived cryogenic N₂ gas-jet cooling during external turning of TC18. Surface-altered-layer behavior was evaluated with four complementary outcomes: optically delineated P-zone depth, near-surface microhardness, hardness-defined layer thickness, and Ra. Using distinct optical, mechanical, and topographical measurements enabled comparison of the responses without treating them as equivalent indicators of a single mechanism.
At feed rates of 0.10, 0.15, 0.20, and 0.26 mm/rev, the cryogenic condition was associated with a shallower representative P-zone depth by approximately 29%, 15%, 2%, and 49%, respectively. The near-zero separation at 0.20 mm/rev and the much larger separation at 0.26 mm/rev show that the magnitude of this descriptive difference depended on the feed setting and was not a constant response to cooling.
Near-surface microhardness was associated with descriptive differences between the two cooling modes, but the magnitude of these differences varied substantially with feed rate and should not be interpreted as a uniform cryogenic effect across all feeds. Hardened-layer thickness was also greater under cryogenic cooling, increasing from a flood-cooling range of 20–50 µm to 40–60 µm, with a four-condition mean increase of approximately 40%. A thinner visible P-zone together with a thicker hardened layer is not contradictory because the two depths were defined by different measurement endpoints. Ra was also lower under cryogenic cooling at all four matched feeds, with descriptive reductions of approximately 23%, 20%, 12%, and 8%, respectively.
Within the auxiliary cryogenic series, Ra showed a decreasing trend with increasing cutting speed over the tested range from 10.6 to 19.1 m/min and an increasing trend over the upper part of the depth-of-cut range. Only one flood reference was available in each auxiliary series, so these observations cannot be interpreted as evidence of a cooling advantage across the full speed or depth range. Overall, the evidence supports a bounded association between the specified gas-jet configuration and reduced visible deformation depth, retained near-surface hardening, and lower roughness. It does not identify a unique thermal or tribological mechanism, a globally optimal cutting condition, or improved wear or fatigue performance. Confirmation requires independent replication, complete paired controls, and measurements that directly resolve temperature, force, tool condition, and microstructural state.
Disclosures
The authors have no conflicts of interest to declare. No artificial intelligence tools were used in the preparation of the manuscript, figures, or data analysis.
Acknowledgements
This work was supported by the National Natural Science Foundation of China (No. 51905426) and the Innovative Talent Promotion Program, Science and Technology Innovation Team of Shaanxi Province, China (No. 2025RS-CXTD-037).
Materials
| Name | Company | Catalog Number | Comments |
|---|---|---|---|
| Coated Cemented-Carbide Turning Insert | Chengdu Qianhesheng Precision Tools Co., Ltd. | WNMG080404-HL | External cylindrical turning of TC18 titanium alloy |
| CW6163B Horizontal Lathe | ANYANG MACHINE TOOL WORKS | 20010089 | The lathe accommodates workpieces with a maximum turning diameter of 630 mm, a maximum length of 3,000 mm, and a maximum spindle rotational speed of 1,000 rpm. |
| Deionized Water H2O | Dongguan Hongwang Precision Technology Co., Ltd. | Volume fraction 94 vol% | Solvent for Kroll's etchant, specimen cleaning |
| DRK-5011 Semi-Synthetic Cutting Fluid | Dezhou Xincheng Special Oil Co., Ltd. | Used at 20 C, pH 9.1, density 1.02 g/cm3 | Cooling and lubricating medium for flood cooling experiments |
| Horizontal Lathe | Baoji Machine Tool Factory | CW6163B | External cylindrical turning experiments of TC18 titanium alloy |
| Hydrofluoric Acid HF | Dongguan Hongwang Precision Technology Co., Ltd. | Volume fraction 2 vol% | Component of Kroll's etchant, metallographic specimen etching |
| Image Analysis Software | Adobe, AOSVI | Photoshop, AOSVI | Metallographic image processing, P-zone depth measurement |
| Liquid Nitrogen LN2 | Xi'an Weiguang Gas Co., Ltd. | 20 L | Cold source for cryogenic N2 gas jet |
| LN2 Cryogenic Jet Delivery System | Xindabaihui Cryogenic Equipment Co., Ltd. | Customized: storage vessel, electric pump, vaporization chamber, pressure control unit, piping, nozzle (nozzle outlet diameter 2 mm) | Delivery of cryogenic N2 jet after LN2 vaporization, nozzle outlet diameter 2 mm, working supply pressure 0.16 MPa |
| Metallographic Microscope | Ossila | Ossila M230-3M180: equipped with a 20-megapixel industrial camera; resolution/FPS 45@2560x1920; 20@5120x3840; magnification: 500x optical, 5000x digital | Observation of near-surface plastically deformed zone (P-zone) at 500x, metallographic image acquisition and measurement |
| Mounting Resin | Guangzhou Pinyi Metallographic Technology Co., Ltd. | / | Hot mounting of metallographic specimens, specimen fixation |
| Nitric Acid HNO3 | Dongguan Hongwang Precision Technology Co., Ltd. | Volume fraction 4 vol% | Component of Kroll's etchant, metallographic specimen etching |
| OPTELICS HYBRID Confocal Microscope | Lasertec Corporation | Non-contact optical measurement device without a physical stylus; detection via confocal optical system. Key parameters: light source - violet semiconductor laser (405 nm); vertical measurement accuracy - 0.05 nm; horizontal repeatability (3 sigma) - 10 nm; roughness calculated from 2D height data, independent of scanning direction and point count; 3 sigma < 10 nm denotes three times the standard deviation, a statistical measure of data dispersion and repeatability | Measurement of arithmetic mean surface roughness Ra of machined surfaces |
| Plotting / Data Processing Software | OriginLab | Origin | Data statistics, plotting (Figures 3-6) |
| TC18 Near-beta Titanium Alloy Bar | Shaanxi Huachen Titanium Co., Ltd. | Diameter 45 mm, Length 275 mm | Workpiece for turning experiments |
| Vickers Microhardness Tester | Shenzhen Sannuo Instrument Equipment Factory | HVS-1000Z | Microhardness testing; test load 50 gf, dwell time 15 s |
| Wire Electrical Discharge Machine | Taizhou Ruite CNC Machine Tool Co., Ltd. | TRS-32 | Sampling after turning, cutting 10 mm x 10 mm x 5 mm metallographic specimens |
References
- Najafizadeh M, et al. Classification and applications of titanium and its alloys: a review. J Alloys Compd Commun. 2024;3:100019.
- Marin E, Lanzutti A. Biomedical applications of titanium alloys: a comprehensive review. Materials (Basel). 2023;17(1):114.
- Srivastava M, et al. Additive manufacturing of titanium alloy for aerospace applications: insights into the process, microstructure, and mechanical properties. Appl Mater Today. 2024;41:102481.
- Wu S, et al. Surface integrity in titanium alloy cutting: a comprehensive review. Chin J Aeronaut. 2025:103903.
- Wang Q, et al. Numerical simulation study of combined shot peening and laser shock peening on surface integrity of Ti-6Al-4V titanium alloy. Surf Coat Technol. 2024;487:130997.
- Shanmugam R, et al. Machining temperature, surface integrity and burr size investigation during coolant-free hole milling in Ti6Al4V titanium alloy. Lubricants. 2023;11(8):349.
- Zhang C, et al. The state of the art in machining additively manufactured titanium alloy Ti-6Al-4V. Materials (Basel). 2023;16(7):2583.
- Pramanik A, Basak AK. Laser beam machining of titanium alloy—a review. Metals (Basel). 2023;13(9):1536.
- Kumari S, et al. Effect of various lubricating strategies on machining of titanium alloys: a state-of-the-art review. Coatings. 2022;12(8):1178.
- Gupta MK, et al. Comparison of tool wear, surface morphology, specific cutting energy and cutting temperature in machining of titanium alloys under hybrid and green cooling strategies. Int J Precis Eng Manuf Green Technol. 2023;10(6):1393-406.
- Xie W, et al. Research on cutting force and surface integrity of TC18 titanium alloy by longitudinal ultrasonic vibration assisted milling. Int J Adv Manuf Technol. 2022;119(7-8):4745-55.
- Hourmand M, Sarhan AAD, Sayuti M, Hamdi M. A comprehensive review on machining of titanium alloys. Arab J Sci Eng. 2021;46(8):7087-123.
- Pramanik A. Problems and solutions in machining of titanium alloys. Int J Adv Manuf Technol. 2014;70(5-8):919-28.
- Oke SR, et al. An overview of conventional and non-conventional techniques for machining of titanium alloys. Manuf Rev. 2020;7:34.
- Liu W, et al. Advance in experimental research on cutting temperature of titanium alloys. Int J Adv Manuf Technol. 2023;126(5-6):1827-44.
- Matuszak J, Zaleski K, Zyśko A. Investigation of the impact of high-speed machining in the milling process of titanium alloy on tool wear, surface layer properties, and fatigue life of the machined object. Materials (Basel). 2023;16(15):5361.
- Zhang X, Luo M, Zhang D. High performance cutting of titanium alloy based on the thermo-mechanical coupling effect. Procedia CIRP. 2018;77:126-9.
- Liu Y, et al. Thermo-mechanical coupling during belt grinding and corresponding surface integrity of titanium alloy. Int J Adv Manuf Technol. 2022;121(9-10):6599-609.
- Miguélez MH, Soldani X, Molinari A. Analysis of adiabatic shear banding in orthogonal cutting of Ti alloy. Int J Mech Sci. 2013;75:212-22.
- Li A, Zang J, Zhao J. Effect of cutting parameters and tool rake angle on the chip formation and adiabatic shear characteristics in machining Ti-6Al-4V titanium alloy. Int J Adv Manuf Technol. 2020;107(7-8):3077-91.
- Li J, Xu B. Study on adiabatic shearing sensitivity of titanium alloy in the process of different cutting speeds. Int J Adv Manuf Technol. 2017;93(5-8):1859-65.
- Zha X, et al. Effect of cutting feed rate on machining performance and surface integrity in cutting process of Ti-6Al-4V alloy. Int J Adv Manuf Technol. 2024;131(5-6):2791-809.
- Yang D, Liu Z. Surface topography analysis and cutting parameters optimization for peripheral milling titanium alloy Ti-6Al-4V. Int J Refract Met Hard Mater. 2015;51:192-200.
- Zhang LC, Chen LY, Wang L. Surface modification of titanium and titanium alloys: technologies, developments, and future interests. Adv Eng Mater. 2020;22(5):1901258.
- Zammit A, et al. Enhancing surface integrity of titanium alloy through hybrid surface modification (HSM) treatments. Mater Chem Phys. 2022;279:125768.
- Arunprasath K, Thivagar A, Mathan P, Yuvanarasimman P. Cryogenic turning of titanium alloys: machinability characteristics and environmental consequences. Mater Today Proc. 2022;66:749-53.
- Shokrani A, Dhokia V, Newman ST. Investigation of the effects of cryogenic machining on surface integrity in CNC end milling of Ti-6Al-4V titanium alloy. J Manuf Process. 2016;21:172-9.
- Shokrani A, Dhokia V, Newman ST. Energy conscious cryogenic machining of Ti-6Al-4V titanium alloy. Proc Inst Mech Eng B J Eng Manuf. 2018;232(10):1690-706.
- Wang F, Pang Q, Yang Q, Han H. Effect of cryogenic cooling on micro-milling properties of titanium alloy. J Mater Eng Perform. 2025;34(8):6472-83.
- Yuan SM, Yan LT, Liu WD, Liu Q. Effects of cooling air temperature on cryogenic machining of Ti-6Al-4V alloy. J Mater Process Technol. 2011;211(3):356-62.
- Biermann D, Abrahams H, Metzger M. Experimental investigation of tool wear and chip formation in cryogenic machining of titanium alloys. Adv Manuf. 2015;3(4):292-9.
- Sıyambaş Y, Akdulum A. Prediction of surface roughness using different features in vortex cooled turning process of Ti6Al4V alloy. Measurement. 2024;237:115258.
- Sivarupan T, et al. A review of the use of cryogenic coolant during machining titanium alloys. Sustain Mater Technol. 2024;40:e00946.
- Zhang J, et al. Grain size characterization method of dual-phase titanium alloys with complex microstructure based on laser ultrasonic. Measurement. 2023;211:112670.
- Prakash C, Selva Kumar S, Manikandan D, Ramaswamy K. Investigation of micro turning process parameters for titanium alloy using response surface methodology. Discover Mater. 2026;6:10.