This protocol describes an ex vivo myocardial infarction model in the isolated crystalloid-perfused mouse heart. This approach bypasses systemic variables, thereby allowing researchers to evaluate directly cardiac effects in the absence of extrinsic factors that may confound cardiomyocyte survival and to test localized pharmaceutical interventions.
Method Article
Ex Vivo Myocardial Infarction Model in the Crystalloid-Perfused Mouse Heart
* These authors contributed equally
In This Article
Summary
Abstract
Experimental myocardial infarction (MI) is commonly modeled in animals through transient occlusion of the left anterior descending (LAD) coronary artery or, at the cellular level, by hypoxia–reoxygenation protocols. As an alternative organ-level model of ischemia, the Langendorff-perfused heart has remained a cornerstone tool for investigating the effects of physiological perturbations and pharmacological interventions on cardioprotection. Here, we present the basic methodology and fundamental rules required for establishing a regional myocardial ischemia/reperfusion model in the isolated mouse heart. In brief, following cardioplegic arrest, the LAD was ligated after a brief flush with ice-cold PBS. The heart was then mounted on a Langendorff apparatus and perfused with a nutrient-rich oxygenated buffer at 37°C under a constant perfusion pressure of 110 cmH₂O. The length of myocardial ischemia was induced for 30, 45, 60, 90 and 120 min followed by 90 min of reperfusion. Cardiomyocyte viability and infarct size were assessed by using microscopic 2,3,5-triphenyltetrazolium chloride (TTC) staining approach. We demonstrated that the ex vivo MI model reliably yielded reproducible myocardial injury, characterized by a progressive loss of viable cardiomyocytes within the infarct region as ischemic duration extended. In addition, at least 30 min of reperfusion was required to achieve clear TTC-based delineation of the infarcted myocardium. This approach bypasses systemic variables, thereby allowing researchers to evaluate directly cardiac effects in the absence of extrinsic regulatory influences, such as circulating humoral factors and immune cell infiltration, that may confound MI progression, and to test localized pharmaceutical interventions. Thus, the ex vivo MI model represents a useful platform for investigating cardioprotective mechanisms that act directly on cardiomyocytes.
Introduction
A myocardial infarction (MI) occurs when coronary blood flow halts, causing tissue death and severe functional impairment. While typically studied in whole organisms, the term can refer to regional MI restricted to specific heart structures, or to ex vivo, isolated heart laboratory models (e.g., Langendorff perfusion) used to study infarcts in the absence of systemic influence1. As such, the Langendorff-perfused heart has served as a robust and well-established experimental model for studying myocardial ischemic injury for more than 50 years2.
The ex vivo MI model in the isolated heart offers several advantages, including precise control of the experimental environment and the ability to evaluate the direct effects of interventions, such as pharmacological agents, on the myocardium independently of systemic influences, including circulating humoral factors, blood components, and neurohumoral regulation3. Through minimizing these confounding factors, the ex vivo model provides a more predictable and reproducible approach than in vivo models and, thus, facilitates rigorous investigation of the disease processes and molecular pathways involved in MI4.
In isolated hearts, myocardial ischemia can be induced either globally or regionally5. In the global MI model, perfusate flow through the entire coronary circulation is completely interrupted, whereas in the regional MI model, only the left anterior descending coronary artery (LAD) is transiently occluded by ligation, resulting in ischemic injury confined to the myocardium distal to the ligation site. Although the global MI model is technically straightforward to perform, it has several limitations that restrict its application in studies of cardioprotection6. One major limitation is that the length of ischemia is constrained by the durable tolerance of the whole heart, making prolonged ischemia difficult to induce, with a likelihood of transmural infarction comparable to in vivo situations7. Furthermore, although ex vivo models generally provide excellent reproducibility when ischemia and reperfusion durations are carefully controlled, these protocols vary considerably among laboratories. Such variability highlights the need for better standardization and characterization of the isolated mouse heart, particularly because many critical methodological details remain insufficiently described in the literature8.
On the other hand, the regional MI model is technically more challenging to establish. Here, we present several modifications and practical strategies to optimize the induction of reliable ex vivo MI in the isolated mouse heart, particularly for evaluating pharmacological interventions aimed at cardioprotection9,10. Thus, this modified ex vivo MI protocol using the Langendorff-perfused mouse heart provides an effective platform for directly assessing myocardial survival following therapeutic interventions.
Protocol
The isolated perfused heart model described here is an acute, non-survival experiment and was approved by the local authorities (O1019/25, LANUV of Nordrhein-Westfalen, Germany). All the procedures were conducted in accordance with the ARRIVE guidelines and the NIH Guide for the Care and Use of Laboratory Animals. The equipment and chemicals required for the experiments are listed in the Table of Materials.
1. Setting up a Langendorff retro-perfusion system for the isolated mouse heart
NOTE: A non-recirculating, gravity-driven system was designed to deliver oxygenated crystalloid perfusate (Krebs-Henseleit buffer, KHB) to the isolated mouse heart at a constant pressure of 110 cmH2O (Figure 1A).
- Clean the Langendorff glassware with 0.1 M/L HCl, 100% ethanol, and subsequently rinse with distilled water before assembling the system.
- Weigh all the chemicals required for preparation of 2 L of modified KHB according to the following final concentrations (mM): 116.02 NaCl, 4.63 KCl, 1.10 MgSO4·7H2O, 1.21 KH2PO4, 2.52 CaCl2·2H2O, 24.88 NaHCO3, 8.30 D-glucose, 2.0 sodium pyruvate.
- Dissolve all chemicals except CaCl₂ in double-distilled water in a 2 L flask while continuously bubbling with Carbogen (95% O₂/5% CO₂) for at least 10 min to equilibrate the pH to 7.4.
- Add CaCl₂ subsequently to the solution to avoid precipitation.
- Continue bubbling the solution with Carbogen for an additional 10 min.
- Filter the KHB solution under vacuum through a 0.2 µm membrane filter to eliminate small particles that may obstruct the coronary microvasculature.
- Transfer the filtered KHB solution into a 2 L glass reservoir placed in a prewarmed water bath maintained at 37 °C.
- Connect the KHB reservoir to the glass pressure column, allowing oxygenated KHB to continuously fill the column through the pressure generated by Carbogen gas in the reservoir.
- Ensure that the outflow tubing system is free of air bubbles.
- Equilibrate the KHB solution with Carbogen for an additional 30 min before the experiment starts.
2. Isolation and cannulation of the heart
NOTE: Male C57BL/6J mice weighing 20–25 g were used in the present experiments. All experimental procedures must be properly documented in accordance with local regulations, including the rationale, the date, and the method of euthanasia.
- Gently place the mouse in an induction chamber containing 5% isoflurane (v/v) for anesthesia induction.
- Confirm anesthetic depth by the complete absence of a response to a firm toe pinch, and then transfer to the operating table. Immediately euthanize the mouse by cervical dislocation, as indicated by the absence of respiration and loss of muscle tone in the lower body.
- Cut the rib cage bilaterally toward the sternum to fully expose the heart and ascending aorta.
- Grasp the extracardiac tissue with forceps and excise the heart.
- Place the heart in a small pre-cooled beaker containing 50 mL of ice-cold KHB solution for at least 30 s to induce cardioplegic arrest.
NOTE: Because cardiac activity is highly temperature-sensitive, the heart is completely arrested by immersion in ice-cold KHB solution. - Transfer the heart onto a pre-chilled, KHB-moistened cotton pad placed in a metal dish, where a cannula system connected to a three-way stopcock has been established. (Figure 1B).
NOTE: The perfusion system should be free of air bubbles. - Pre-position a loose half-square knot using a 5-0 silk thread on the distal end of the cannula.
- Carefully dissect away the thymus, connective tissue, and residual extracardiac tissues (including the lungs and esophagus) to expose and trim the aortic root.
NOTE: Ensure an adequate length of the ascending aorta for successful cannulation. - Mount the heart onto the cannula and secure it with a pre-placed suture.
- Rinse the heart with 5 mL of ice-cold PBS to flush out residual blood from the coronary circulation.
3 Ex vivo myocardial ischemia and reperfusion
NOTE: Global myocardial ischemia was induced by simply stopping perfusion of the heart, while regional myocardial ischemia was created by transient ligation of the LAD under a stereomicroscope.
- Position the LAD in the center of the field of view by gently rotating the heart through adjustment of the underlying cotton pad. The LAD became transparent and clearly distinguishable from the surrounding myocardium during perfusion of PBS.
- Pass a tapered needle carrying an 8–0 polypropylene suture underneath the LAD, 1 mm below the lower margin of the left atrium.
NOTE: Ensure that the LAD locates the middle between the two puncture sites to avoid vascular injury caused by ligation. - Place a piece of soft pledget over the LAD.
- Tighten firmly the suture to stop perfusion distal to the ligation site.
- Transfer the cannulated heart to the Langendorff apparatus and start a retrograde perfusion.
- Immerse the heart in the water-jacketed organ bath to maintain a constant temperature (37 °C) throughout the experimental period.
- Monitor the peak and steady-state coronary flow (Table 1).
- At the designated time points of myocardial ischemia (see results section), halt perfusion and remove the cannulated heart from the perfusion apparatus.
- Immediately immerse the heart in ice-cold KHB (4 °C) to completely arrest cardiac contraction.
- Place the heart back on the cotton pad in the pre-chilled metal dish and release the LAD ligation.
- For pharmacological intervention studies, inject 5 µL of Interleukin-6 (IL-6, 0.1 mg/mL) into the infarcted anterior wall using a 30 G insulin syringe at this stage.
- Remount the cannulated heart onto the perfusion apparatus and resume cardiac perfusion (reperfusion).
4. Assessment of myocardial injury and survival
NOTE: 2,3,5-Triphenyltetrazolium chloride (TTC) staining labels viable myocardium deep-red, whereas infarcted/necrotic tissue appears beige after fixation with Zamboni solution.
CAUTION: TTC is generally considered hazardous and requires careful handling as it may cause mild skin irritation, serious eye irritation, and is harmful if inhaled. Dispose of waste and residues in accordance with local authority requirements.
- Cease perfusion 90 min after reperfusion and immediately immerse the heart in ice-cold KHB to arrest cardiac contraction.
- Connect the cannula to a 3 mL syringe prefilled with TTC staining solution (1% TTC dissolved in PBS) via a three-way stopcock.
- Infuse 1 mL of TTC solution into the heart, repeat the infusion three times, and deliver a total volume of 3 mL over 15 min.
- Cover the heart with moist tissue paper to avoid surface drying.
- Place the heart in a centrifuge tube containing 3 mL TTC solution at 4 °C overnight.
- Make a tissue block with Optimal Cutting Temperature (OCT) compound.
NOTE: The tissue block may be stored at −80 °C for several months until further analysis. - Mount the tissue block onto a cryostat chuck using OCT compound.
- Cryosection the heart successively at a thickness of 50 µm and collect every 10th section; about 8 tissue slices per heart are generally obtained.
- Align all 8 slices on one microscope slide and dry it with a hairdryer for 2–3 min.
- Immerse the slices in a staining chamber containing Zamboni solution (a fixative containing 2% paraformaldehyde and 0.4 % picric acid, w/v) overnight at 4 °C.
CAUTION: Zamboni’s fixative may cause an allergic skin reaction and is suspected of causing genetic defects and carcinogenesis. Dispose of waste and residues in accordance with local authority regulations. - Wash the slices 3 times with PBS and cover the sections with mounting medium.
NOTE: TTC-stained heart sample can be stored at room temperature for several months. - Acquire heart images using a light microscope with a 1.25x objective using CellSens software.
- For quantification of infarct size, import the image files into the ImageJ platform.
- From the ImageJ menu, select Image -> Adjust -> Color Threshold to open the Color Threshold window (Figure 2B).
- Select a small region of interest (ROI) within the heart section and use the deep-red viable myocardium and beige infarcted/necrotic tissue as color references.
- Click on Sample in the Color Threshold window and fine-tune the saturation range until the selected region precisely matches the target color area.
- Click on Selection to delineate the area corresponding to the selected color.
- From the ImageJ menu, select Analyze -> Measure. The area of the selected region, reported in pixels, will be displayed in the Results window.
- Export the measurement data to an Excel spreadsheet for calculation of the planimetric infarct size.
- To quantify viable myocardium within the infarcted region, delineate the region of interest (ROI), primarily on the infarcted anterior ventricular wall, where IL-6 was injected.
- Open the ROI Manager from the ImageJ menu and click on Add to save the selected ROI to the ROI list (Figure 2C).
- Use the “Sample” and “Selection” functions as described above to delineate the viable myocardium (deep red).
- Add the selected viable area to the “ROI Manager” list, then select AND to obtain the overlap between the ROI and the viable myocardium.
- Measure the area of viable myocardium and calculate the cardiomyocyte survival rate within the selected ROI.
NOTE: The methodological details for TTC staining and infarct size quantification have been previously reported11.
Results
In the ex vivo MI platform, two ischemic protocols were evaluated in the isolated mouse heart. Global ischemia, which has been widely used in ex vivo MI studies, resulted in heterogeneous ischemic injury throughout the heart. Using a reliable and high-resolution microscopic TTC-based detection approach12, it was demonstrated that the atrial myocardium and apical region were relatively resistant to ischemia and remained viable after 45 min of global no-flow ischemia (Figure 2A, upper panel). In contrast, regional MI induced localized ischemic injury in the myocardium distal to the LAD ligation site. Under these conditions, portions of the subepicardial myocardium remained TTC-positive, indicating preservation of viable tissue (Figure 2A, lower panel). These findings reveal distinct patterns of myocardial survival between the two ischemic protocols.
The minimal duration of ischemia and reperfusion required to reliably and reproducibly induce myocardial infarction was further investigated in the isolated mouse heart. Myocardial injury progressively increased as the duration of ischemia was extended from 30 min to 120 min (Figure 3A). Notably, the infarct size more than doubled between 30 min (n = 3) and 45 min (n = 5) of ischemia and seemingly reached a plateau as ischemic duration was extended to 60 min (n = 5), 90 min (n = 4), and 120 min (n = 3) (Figure 3B). These findings indicate that myocardial viability is highly sensitive to ischemic duration beyond 30 min. Compared with the in vivo MI (ivMI, n = 5) model, the ex vivo MI (evMI, n = 8) model produced nearly identical infarct sizes under comparable ischemic and reperfusion durations (36.88% ± 3.91% vs. 37.8% ± 2.17%, p = 0.27), suggesting that myocardial injury was not substantially affected by crystalloid perfusion. Nevertheless, evMI hearts exhibited thicker ventricular walls and a reduced ventricular lumen, likely due to myocardial edema associated with crystalloid perfusion (Figure 3C).
Taking advantage of the relatively controlled environment, free from extracardiac influences, the cardioprotective effects of intramyocardial IL-6 delivery were evaluated. In control hearts treated with PBS, scattered but measurable viable cardiomyocytes (viable CMs; deep red) remained detectable within the infarcted/necrotic region (beige), even after 45 min of ischemia (Figure 4; 1.05% ± 0.44%, SEM, n = 4). Notably, intramyocardial delivery of IL-6 (i.m.; arrows) significantly increased the amount of viable CMs, which were predominantly localized around the injection site within the region of interest (ROI; 4.08% ± 0.99%, SEM, n = 6; p = 0.005, Student’s t-test). These findings suggest that IL-6 may enhance cardiomyocyte survival following ischemic injury.
Finally, the current ex vivo MI model has several potential pitfalls that may affect the reproducibility of experimental outcomes. As demonstrated in Figure 5, ligature slip may result in inadequate LAD occlusion and extensive myocardial survival (4/168), and, in the meantime, incomplete reperfusion may occur when branches of the LAD are damaged (12/168). In addition, air embolization during the aortic cannulation can also cause myocardial injury (arrows, 7/168), making it difficult to distinguish ischemic injury from embolic injury for quantification. Finally, inadequate TTC staining may occur when the heart is excessively perfused (11/168), which substantially hampers the delineation of the infarct area.
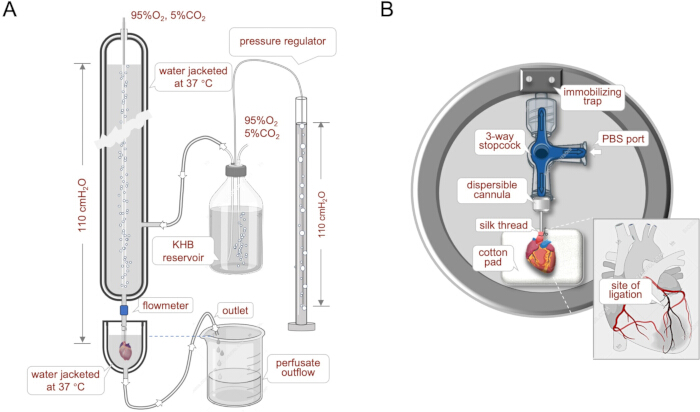
Figure 1: Schematic of experimental setup. The non-recirculating, gravity-driven constant-pressure Langendorff system was designed to deliver nutrient-rich, oxygenated Krebs–Henseleit buffer (KHB) at a constant hydrostatic pressure of 110 cmH₂O. KHB was first prewarmed to 37 °C in a reservoir and fed to a water-jacketed pressure column, where a constant hydrostatic pressure of 110 cmH2O was maintained via a pressure regulator. The perfused heart was immersed in a height-adjustable, water-jacketed organ bath to maintain a constant temperature of 37 °C throughout the experimental period (A). Myocardial infarction was induced by transient ligation of the left anterior descending (LAD) coronary artery following cardioplegic arrest on the cotton pad within a pre-chilled metal dish (B). The procedure was performed under a stereomicroscope. Please click here to view a larger version of this figure.
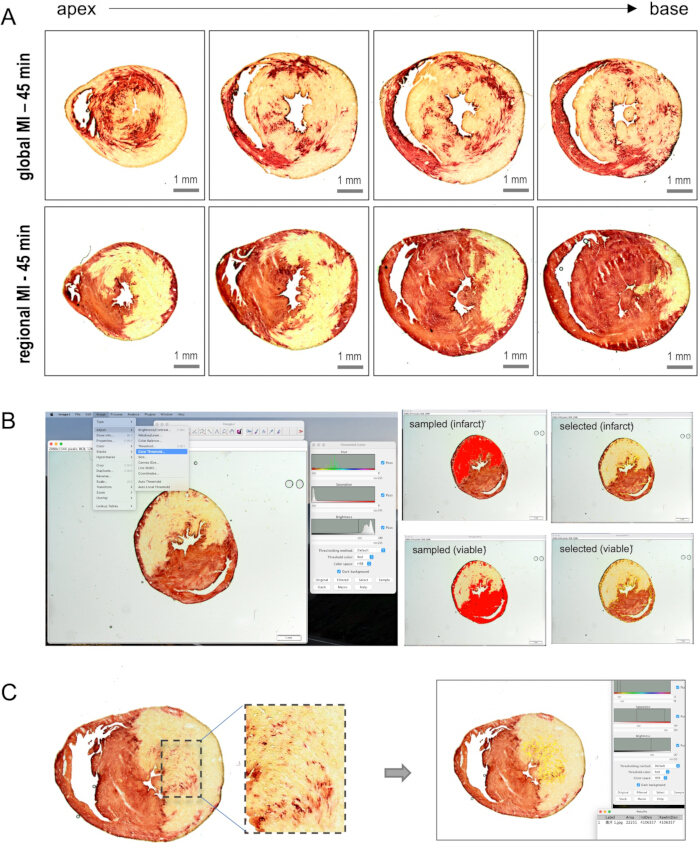
Figure 2: Regional versus global myocardial infarction (MI) and infarct size determination. Global MI induces ischemic injury throughout the heart, as indicated by the yellow staining in microscopic TTC images. The atrial myocardium and the apical region appeared to be more resistant to ischemia and remained viable after 45 min of global no-flow ischemia (upper panel in A). Regional MI induces ischemic injury in the myocardium distal to the LAD ligation site. In this setting, portions of the subepicardial myocardium are stained red, suggesting preservation of viable tissue (lower panel in A). Infarct size was quantified using ImageJ, with the infarcted/necrotic area and viable myocardium delineated based on their distinct staining colors (B). Cardiomyocyte survival within the region of interest (ROI) was calculated by determining the percentage of the deep-red staining in the selected ROI (C). Scale bars: 1 mm. Please click here to view a larger version of this figure.
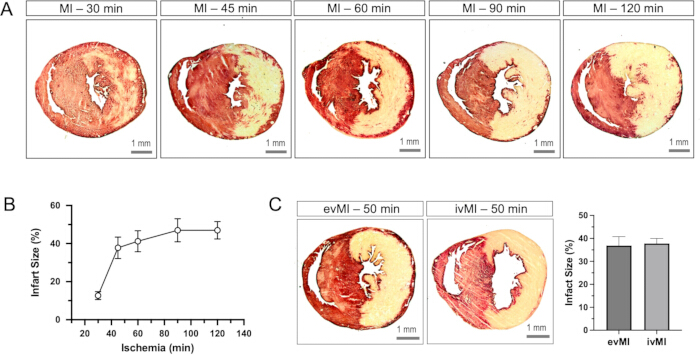
Figure 3: Impact of ischemic length on infarct size. Myocardial injury progressively aggravated as the duration of ischemia was extended from 30 min to 120 min (A). The infarct size more than doubled between 30 min (n = 3) and 45 min (n = 5) of ischemia and seemingly reached a plateau as ischemic duration was extended to 60 min (n = 5), 90 min (n = 4), and 120 min (n = 3) (B). Compared with the in vivo MI (ivMI, n = 5) model, the ex vivo MI (evMI, n = 8) produced nearly identical infarct sizes under comparable ischemic durations (36.88% ± 3.91% vs. 37.8% ± 2.17%, p = 0.27, Student’s t-Test). The evMI hearts exhibited a thicker ventricular wall and a reduced ventricular lumen, likely due to myocardial edema associated with crystalloid perfusion (C). Error bars represent the standard deviation of the mean (SDM). Scale bars: 1 mm. Please click here to view a larger version of this figure.
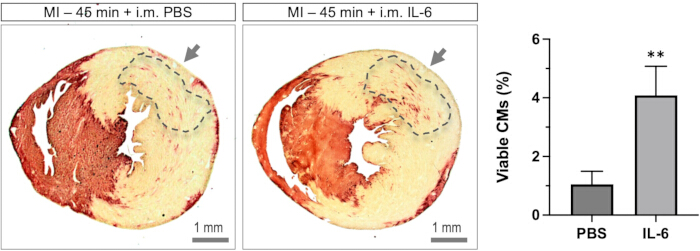
Figure 4: IL-6 enhanced cardiomyocyte survival following ischemic injury. Intramyocardial (i.m.) delivery of IL-6 in the evMI model yielded a measurable number of viable cardiomyocytes (viable CMs; deep red) within the infarcted/necrotic region (beige), predominantly localized around the IL-6 injection site (arrows, left panel). Quantification of viable CMs within the region of interest (ROI, indicated by dash lines) revealed that PBS injection resulted in only a small fraction of viable myocardium (1.05% ± 0.44%, SEM, n = 4), whereas injection of IL-6 significantly increased the amount of viable CMs within the ROI (4.08% ± 0.99%, SEM, n = 6; p = 0.005, Student’s t-test). Error bars represent the standard deviation of the mean (SDM). Please click here to view a larger version of this figure.
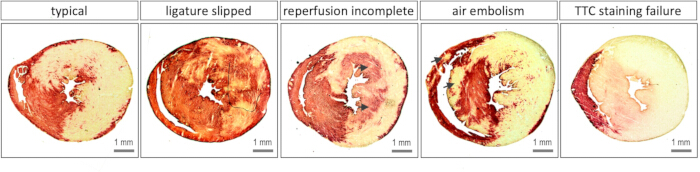
Figure 5: Unsatisfactory or unsuccessful outcomes caused by technical failure. As illustrated by the representative myocardial injury in the ex vivo MI model (left), viable and necrotic myocardium can generally be clearly distinguished in the typical TTC staining. However, several technical failures may result in unsatisfactory or uninterpretable outcomes. Inadequate LAD ligation caused by suture slippage may result in extensive myocardial survival despite prolonged ischemia. Incomplete reperfusion may occur when branches of the LAD are damaged during ligation and subsequently become poorly perfused, producing a pattern resembling the “no-reflow” phenomenon observed clinically. Such regions may exhibit a pinkish coloration (arrows). Microvascular embolization by air bubbles entering the coronary circulation during the cannulation procedure can also cause myocardial injury (arrows), making it difficult to distinguish ischemic injury from embolic injury for quantification. Finally, inadequate TTC staining may occur when the heart is excessively perfused, which may cause myocardial injury apart from ischemia. Scale bars: 1 mm. Please click here to view a larger version of this figure.
| F-peak (n = 19) | F-steady (n = 19) | RF-peak (n = 19) | RF-steady (n = 19) | |
| Means (mL/min) | 2.54 | 0.78 | 2 | 0.99 |
| SD | 0.59 | 0.29 | 0.56 | 0.53 |
Table 1: Coronary flow at the maximal (F-peak) and steady-state (F-steady) levels during ischemia and reperfusion (RF-peak and RF-steady).
Discussion
The current ex vivo MI model is primarily based on sophisticated Langendorff-perfused heart systems2. A common pitfall during preparation is the introduction of air bubbles into the coronary circulation, which may cause embolic injury and confound the assessment of ischemic injury. To prevent this issue, meticulous inspection of the perfusion system immediately before each experiment is essential. If small air bubbles become trapped within the tubing system, retrograde flushing with KHB to displace the bubbles back into the pressure column may help resolve the problem.
The pivotal step in this protocol is ligation of the LAD coronary artery. Firstly, accurate visual identification of the LAD is therefore critical. In most cases, the coronary vessels become translucent after the heart is flushed with ice-cold PBS, making the LAD clearly distinguishable from the surrounding myocardium. Furthermore, a proper and skillful ligation technique is equally important, as excessive tension on the 8-0 Polypropylene suture may cut through the LAD, making subsequent reperfusion impossible. To minimize this risk, a suitably sized soft pledget should be placed between the suture and the vessel to distribute the ligation force and protect the coronary artery from mechanical injury. Nevertheless, minor ligation-induced myocardial injury is unavoidable but generally does not impair coronary perfusion or affect the outcome of the experiment. Finally, because myocardial injury is highly temperature-sensitive13, a constant temperature throughout the experiment is critically important. Particularly under constant-pressure perfusion conditions, heat loss may likely occur between the perfusion column and the heart and varies dynamically upon coronary flow rate14. Thus, fluctuations can potentially lead to changes in myocardial temperature. In this setting, a water-jacketed organ bath is highly desirable to maintain stable thermal conditions (Figure 1A).
Once these technical challenges are overcome, the ex vivo MI model provides a reliable and reproducible platform for inducing myocardial injury in the isolated mouse heart (Figure 3A). It, therefore, represents a valuable experimental system for investigating post-MI myocardial survival, evaluating locally delivered therapeutic interventions, and performing high-resolution imaging without interference from respiratory or cardiac motion. Although the global MI protocol is technically straightforward and has been widely used in previous studies4, its major limitation is that the duration of global ischemia is generally restricted to less than 45 min3. Consequently, unlike the regional MI model, it rarely produces a transmural infarction (Figure 2).
One unique feature of the ex vivo MI model is the absence of systemic influences, including neural regulation and circulating blood components, which enables researchers to evaluate the direct local effects of therapeutic interventions on the myocardium8. This is particularly relevant for cytokines such as IL-6 and the downstream PI3K/AKT signaling, which have been shown to be cardioprotective in isolated cardiomyocytes15. In vivo, however, the cardiac effects of IL-6 are often inconsistent or even contradictory because IL-6 simultaneously activates immune cells and promotes inflammatory responses that may offset its direct cardioprotective actions16. Consistent with this concept, our ex vivo model convincingly demonstrated that local intramyocardial delivery of IL-6 significantly preserved myocardial viability following ischemic injury17,18, supporting a direct cardioprotective effect of IL-6 on cardiomyocytes (Figure 4).
We acknowledge several limitations of the present ex vivo MI model. In the present setup, cardiac contractile function was not evaluated in the present protocol3. This was because the primary objective was to characterize myocardial survival in a regional MI model, and because contractile dysfunction reflects functional impairment following ischemic injury but does not necessarily indicate cardiomyocyte death8. Furthermore, the ex vivo MI model inherently excludes circulating blood components, immune cells, and neurohumoral influences that may substantially contribute to MI progression and cardiac remodeling in vivo. Although this reduction in systemic complexity is a major advantage of the ex vivo MI model, it also limits its broad use in mimicking the inflammatory, vascular, neural, and endocrine responses that may occur in vivo. Finally, crystalloid perfusion was found to associate with myocardial edema, as evidenced by increased ventricular wall thickness and reduced ventricular lumen compared with in vivo MI hearts. The notorious occurrence of edema may alter myocardial architecture, tissue diffusion, and potentially cellular viability. Therefore, the present model should be regarded as a controlled platform for investigating myocardial injury and cardiomyocyte-specific mechanisms.
Nevertheless, the ex vivo MI model described here is a simple, cost-effective platform for evaluating myocardial survival in the absence of extrinsic regulatory influences. Given the increasing use of genetically modified mouse models, this approach may be particularly valuable for investigating cardioprotective mechanisms using advanced imaging, electrophysiological recording, and molecular analyses. In addition, the model could be adapted to systematically test localized pharmacological or gene-based interventions and to dissect cardiomyocyte-specific mechanisms without systemic confounding factors. Thus, the ex vivo MI model provides a complementary experimental platform to facilitate the identification and mechanistic investigation of cardiac-protective pathways.
Disclosures
The authors declare that they have no conflicts of interest. The authors declare that no artificial intelligence (AI) tools or generative AI-assisted technologies were used in the drafting, data analysis, figure generation, or validation of this work.
Acknowledgements
This work was supported by the the General Project of Jiangsu Geriatrics Society (JGS2026MS019 to WO), Social Development Foundation of the Science and Technology Department of Zhenjiang City (grant nos. SH2023023 to H.Z. and SH2023057 to X.L.), the FoKo Program (grant no. 23/2013 to ZD), and the Cardiovascular Research Institute Düsseldorf (CARID).
Materials
| Name | Company | Catalog Number | Comments |
|---|---|---|---|
| 2,3,5-triphenyltetrazolium chloride | Milipore | 1.08380.0100 | Chemicals |
| Aortic cannula | BD | 305895 (20 G) | Retro-perfusion |
| Aquamount | BDH | 362262H | Cryosection |
| Balance | Ohaus | - | Weighing chemicals |
| Big forceps | AESCULAP | - | Surgical instruments |
| Blood gas analyzers | Radiometer | ABL90 FLEX PLUS | Gas analyzer |
| Calcium chloride dihydrate | Fluka | 21097 | Chemicals |
| Carbogen | Linde | 4040152 | Langendorff apparatus |
| CellSens | Olympus | Version 3.1.1 | Imaging software |
| Cotton pads | BEESana | PZN-1330900 | Surgical instruments |
| Cover slips | Epredia | BB02400500A113MN20 | Cryosection |
| Cryostat | Leica | M850 | Cryosection |
| D(+)-Glucose anhydrous | Merck | 8337.1000 | Chemicals |
| Double distilled water | Milipore | - | Dissolving chemicals |
| Ethanol (100%) | Merck | 64-17-5 | Cleaning tubings |
| Ethanol (70%) | VWR | UN1170 | Cleaning tubings |
| Filter membrane (0.2 µm) | Thermo Scientific | 8-000-230511 | Langendorff apparatus |
| Flowmeter | Transonic | T4S410 | Langendorff apparatus |
| Glass microscope slides | Engelbrecht | 11102 | Cryosection |
| Glass water column | Homemade | - | Langendorff apparatus |
| Hydrochloric acid | Roth | P074.1 | Chemicals |
| ImageJ | NIH | version 1.54g | Software |
| Interleukin-6 | Biolegend | 570804 | Chemicals |
| Isoflurane | Piramal | 14150097146754 | Chemicals |
| Light microscope | Olympus | BX61 | Imaging |
| Magnesium sulphate heptahydrate | Merck | 5886.1000 | Chemicals |
| Medical flow probe | Transonic | 3PXN | Langendorff apparatus |
| Metal dish | Homemade | - | Surgical instruments |
| Micro-Fine syringe | BD | 30G / 0.3 mL | Langendorff apparatus |
| Mouse | Janvier | C57BL/6J | Animals |
| Objective (x 1.25) | Olympus | PlanApo 1.25X/0.04 | Imaging |
| OCT compound | Sakura | 4583 | Chemicals |
| Petri dish | Thermo Scientific | 172931 | Langendorff apparatus |
| Phosphate buffered saline | Roth | 9143.1 | Chemicals |
| Potassium chloride | Merck | 4936.1000 | Chemicals |
| Potassium dihydrogen phosphate | Merck | 4873.1000 | Chemicals |
| Silk suture | F.S.T | 18020-60 | Surgical instruments |
| Sodium chloride | Sigmaaldrich | SZBD0810V | Chemicals |
| Sodium hydrogen carbonate | Roth | 6885.2 | Chemicals |
| Sodium pyruvate | Sigmaaldrich | 113-24-6 | Chemicals |
| Soft pledget | Deknatel | L-705 | Surgical instruments |
| Stainless forceps (8m/m) | F.S.T | 11052-10 | Surgical instruments |
| Stainless scissors | AESCULAP | BC702R | Surgical instruments |
| Stainless scissors | AESCULAP | BC257R | Surgical instruments |
| Stereomicroscope | Leica | MZ6 | Surgical instruments |
| Suture (8-0) | Ethicon | TG-108 | Surgical instruments |
| Syringe (3 mL) | B. Braun | 4617100V | Retro-perfusion |
| Three-way stopcock | B. Braun | 16494C | Retro-perfusion |
| Tubing | Tygon | T3304-23 | Langendorff apparatus |
| Water bath | HAAKE | DC1/B3 | Langendorff apparatus |
| Zamboni solution | Morphisto | 12773.0050 | Chemicals |
References
- Pendexter CA, et al. Modified Langendorff perfusion method for extended perfusion times of rodent cardiac grafts. J Vis Exp. 2024;(208):66815.
- Bell RM, Mocanu MM, Yellon DM. Retrograde heart perfusion: the Langendorff technique of isolated heart perfusion. J Mol Cell Cardiol. 2011;50(6):940-950.
- Rossello X, Hall AR, Bell RM, Yellon DM. Characterization of the Langendorff perfused isolated mouse heart model of global ischemia-reperfusion injury: impact of ischemia and reperfusion length on infarct size and LDH release. J Cardiovasc Pharmacol Ther. 2016;21(3):286-295.
- Yang T, et al. Isolated perfused hearts for cardiovascular research: an old dog with new tricks. J Cardiovasc Transl Res. 2024;17(5):1207-1217.
- Martin TP, et al. Preclinical models of myocardial infarction: from mechanism to translation. Br J Pharmacol. 2022;179(5):770-791.
- Hurt CM, et al. Transient receptor potential vanilloid 1 regulates mitochondrial membrane potential and myocardial reperfusion injury. J Am Heart Assoc. 2016;5(9):3774.
- Herr DJ, Aune SE, Menick DR. Induction and assessment of ischemia-reperfusion injury in Langendorff-perfused rat hearts. J Vis Exp. 2015;(101):52908.
- Lindsey ML, et al. Guidelines for experimental models of myocardial ischemia and infarction. Am J Physiol Heart Circ Physiol. 2018;314(4):H812-H838.
- Zhu H, et al. Sfrp1 as a pivotal paracrine factor in the trained pericardial stem cells that foster reparative activity. Stem Cells Transl Med. 2023;12(12):137-150.
- Ouyang W, et al. An immunostaining-based approach for assessing myocardial viability in the infarcted mouse hearts. Front Cardiovasc Med. 2025;12:1598314.
- Ding Z, Zhang H, Bouvain P, Ding Z, Flögel U. A microscopic 2,3,5-triphenyltetrazolium chloride assay for accurate and reliable analysis of myocardial injury. J Vis Exp. 2025;(225):68596.
- Ding Z, et al. A refined TTC assay precisely detects cardiac injury and cellular viability in the infarcted mouse heart. Sci Rep. 2024;14(1):25214.
- El Farissi M, et al. Hypothermia for reduction of myocardial reperfusion injury in acute myocardial infarction: closing the translational gap. Circ Cardiovasc Interv. 2021;14(8):010326.
- Ding Z, Gödecke A, Schrader J. Contribution of cytochrome P450 metabolites to bradykinin-induced vasodilation in endothelial NO synthase deficient mouse hearts. Br J Pharmacol. 2002;135(3):631-638.
- Smart N, et al. IL-6 induces PI 3-kinase and nitric oxide-dependent protection and preserves mitochondrial function in cardiomyocytes. Cardiovasc Res. 2006;69(1):164-177.
- Broch K, et al. Randomized trial of interleukin-6 receptor inhibition in patients with acute ST-segment elevation myocardial infarction. J Am Coll Cardiol. 2021;77(15):1845-1855.
- Fontes JA, Rose NR, Čiháková D. The varying faces of IL-6: from cardiac protection to cardiac failure. Cytokine. 2015;74(1):62-68.
- Preda A, et al. IL-6 in the spotlight: from cardiovascular pathophysiology to therapy. Eur J Clin Invest. 2026;56(1):e70161.
Reprints and Permissions
This article has been published
Video Coming Soon