This study describes a protocol for quantifying biogenic amines in Drosophila brains using high-performance liquid chromatography coupled with electrochemical detection (HPLC-ECD). Leveraging the genetic tractability of Drosophila and HPLC-ECD, this approach can help researchers elucidate the molecular and genetic mechanisms underlying changes in biogenic amines in brain disorders.
Method Article
Using High-Performance Liquid Chromatography to Study Alterations in Biogenic Amines in Drosophila Models of Brain Disorders
* These authors contributed equally
In This Article
Summary
Abstract
Many neuropsychiatric and neurodegenerative disorders are characterized by disruptions in brain neurotransmitters, including alterations in the levels of the biogenic amines (BAs) dopamine (DA) and serotonin (5-hydroxytryptamine; 5-HT), as well as in their release or reuptake. These neurochemical changes correlate with distinct key behavioral phenotypes, such as locomotor deficits, sleep fragmentation, and altered stress responses, among others. Because the principal BA systems interact, disease models frequently show coordinated shifts across multiple amines rather than isolated changes in a single neurotransmitter. Therefore, accurate, simultaneous quantification of several BAs is essential for interpreting behavioral and genetic findings. Drosophila melanogaster offers a genetically tractable system for modeling such disorders and neurotransmitter changes, but BAs occur in fly brain tissue at very low, nanomolar-to-femtomolar concentrations, and the small size of the Drosophila central nervous system makes their detection technically challenging. This study describes a protocol to detect and quantify DA, 5-HT, and octopamine in fly brains using high-performance liquid chromatography coupled with electrochemical detection (HPLC-ECD). HPLC-ECD was applied to detect changes in brain DA and 5-HT in a fly model of Parkinson's disease based on dopaminergic overexpression of human alpha-synuclein. Applying this protocol to the alpha-synuclein Parkinson's disease model reveals significantly elevated dopamine, but unchanged serotonin, relative to controls, consistent with early compensatory dopaminergic mechanisms. This approach provides a sensitive, low-cost, and readily accessible method for multiplexed BA quantification from limited Drosophila tissue. It also enables systematic screening of genetic modifiers and candidate therapeutics targeting monoaminergic pathways relevant to human brain disorders.
Introduction
Monoamine neurotransmitters, also known as biogenic amines (BAs), are known to regulate several key neurological and behavioral features across animal taxa, including but not limited to motivational states, sleep, learning, memory, and mood regulation1,2,3,4. Dysregulation of BAs, such as dopamine (DA) and serotonin (5-hydroxytryptamine; 5-HT), is a critical feature of neurodegenerative disorders such as Parkinson's disease as well as psychiatric disorders like schizophrenia3,5. However, the relationship between disease progression and specific neurochemical changes across brain regions and neuronal subtypes has yet to be fully mapped. Answering such questions requires a model system that is not only genetically tractable but also capable of recapitulating disease-relevant physiological and behavioral phenotypes. Drosophila melanogaster has emerged as a powerful model system for this purpose6,7. The fruit fly possesses discrete, well-characterized populations of dopaminergic and serotonergic neurons7,8, and the biosynthetic pathways, transporters, and receptor families that govern these systems and are functionally conserved relative to their mammalian counterparts9. Such conservation provides a mechanistic basis for translating neurochemical findings in the fly to the broader context of human disease.
The utility of flies for modeling neurological and psychiatric disorders extends well beyond genetic homology. As a genetically tractable system, tools in flies enable cell-specific screening of genes and pathways, revealing factors that either exacerbate or reverse disease-relevant symptoms, facilitating the discovery of novel therapeutic targets10. Furthermore, binary expression systems can target not only specific monoaminergic neuronal subtypes but also particular developmental windows11, thereby providing remarkable spatial and temporal precision. The fruit fly model system also provides a repertoire of quantifiable behaviors that can be used to assess the recapitulation of disease-relevant symptoms as well as to test intervention strategies for their rescue7. For instance, well-established genetic models of Parkinson's disease in flies include animals carrying Pink1 and parkin loss-of-function mutations, as well as flies overexpressing wild-type or point-mutated versions of human α-synuclein (α-syn), SNCA12,13,14. All these fly models exhibit some of the most important hallmarks of the disease, including locomotor deficits, degeneration of dopaminergic neurons, mitochondrial dysfunction, and α-syn aggregation in flies carrying the human sequence15,16,17,18,19. On the other hand, neurodevelopmental disruptions and aberrant dopamine signaling are also considered to be among the underlying causes of disorders like schizophrenia20. Consistent with this, Drosophila has been used to model schizophrenia-like symptoms, including hyperactivity, altered sensory responsiveness, and reduced arousal in adult flies21,22,23,24,25. Together, these models demonstrate that Drosophila can capture both the progression of neurodegenerative disorders and the developmental origins of psychiatric disorders.
Associating behavioral changes in genetic models with neurochemical changes requires accurate, reproducible quantitative measurements of BAs. Also, in several diseases, monoamine dysregulation is not restricted to a single neurotransmitter system. In Pink1B9 mutant flies, serotonin content is reduced, and serotonin transporter activity is impaired before motor dysfunction emerges26. Early pharmacological rescue of serotonergic signaling prevents the subsequent loss of affected dopaminergic neurons in Pink1B9 mutant flies. Serotonergic changes can thus precede and causally contribute to dopaminergic pathology, which is a relationship that would be invisible to behavioral readouts or single-analyte measurements. Likewise, changes in the serotonergic system are observed in models of schizophrenia22,27,28. Furthermore, the principal biogenic amines in Drosophila interact in partly redundant and partly antagonistic ways, such that the state of one system is a poor proxy for the others29. Therefore, quantifying individual BAs in these models is paramount.
Biogenic amines are electrochemically active monoamines (e.g., catecholamines, indoleamines) present at low nanomolar to femtomolar concentrations in biological tissue, making their simultaneous detection technically demanding30,31. Addressing questions about the genetic and molecular basis of BA changes in disease thus requires an analytical method capable of resolving multiple structurally similar amines. This method must also detect biologically relevant concentrations in the small tissue volumes available from Drosophila central nervous system preparations. High-performance liquid chromatography (HPLC) coupled with electrochemical detection (ECD) meets these demands. HPLC is an analytical technique that allows for the separation of different molecules within a sample based on their physicochemical features. Coupling the chromatographic system with an electrochemical detector enables rapid, high-sensitivity analysis of electrochemically active analytes such as biogenic amines. Electrochemical detectors work by inducing oxidation as analytes emerge from the column, converting interactions at the electrode surface into a quantifiable electrical signal. Other techniques, such as mass spectrometry, may offer comparable selectivity and sensitivity32,33. However, the low cost per sample and reliability of HPLC-ECD make it ideal for routine, accessible detection of biogenic amines in biology research labs. Combining this technique with the power of Drosophila genetics enables fast, straightforward analysis of the genetic and molecular basis of changes in aminergic systems.
This study uses a genetic Parkinson’s model based on α-syn overexpression to present a protocol for determining differences in BA content in Drosophila brain samples. The article also describes how this approach can be used to study the molecular basis of brain disorders.
Protocol
Raw data presented in this work are available at https://doi.org/10.6084/m9.figshare.33868519.
The reagents and the equipment used are listed in the Table of Materials.
1. Fly entrainment and collection
- Entrain the flies of interest under constant cycles of 12 h of light and 12 h of darkness, at a constant 25 °C, for 3 days before collection. To ensure enough flies are prepared per genotype/condition, entrain 3–9 biological replicates of 5 flies each.
- On the day of collection, place 1.5 mL tubes on dry ice. Use one tube per fly genotype/condition. Using a funnel, dump the flies directly into the tubes to flash-freeze them.
NOTE: Collecting directly on dry ice allows collection at different times of day without the potentially noxious effects of anesthesia. At this point, samples can be stored at -80 °C indefinitely or processed immediately. Collect experimental and control groups at the same time to avoid any confounding effects of time-of-day variations. In the current representative results, the flies were collected 3 h after the lights-on transition.
2. Brain dissection and sample preparation
- To prepare for tissue dissection, use a low-profile container, like the lid of a pipette tip box, and fill it with ice. Place a 30 mm Petri dish on top to act as a dissection platform. Performing the tissue dissection on ice, especially when using a stereoscope with warm lighting, prevents tissue degradation.
- Put a 200 µL droplet of ice-cold 1x Phosphate-Buffered Saline (PBS) on the dish and, under a stereoscope, dissect each fly using fine, sharp forceps.
- To dissect the brain, grab one fly by the abdomen using one pair of forceps and submerge it in the PBS droplet. Without releasing the fly, remove the head by grabbing the connection between the head and the body.
- Both the body and head will float on PBS. Remove the body from the droplet and discard it. Using a pair of forceps, grab the head by the proboscis to push it back inside the PBS droplet.
- Using the free pair of forceps, grab the edge of the eye to hold the head and remove the proboscis.
- Grab the tissue around the aperture that was generated by removing the proboscis and pull. The brain should be exposed.
- Clean the brain gently to remove any head debris, as any leftover tissue might affect quantification. Also, take one fly at a time from the tube on dry ice to prevent sample degradation.
- Using a pipette tip, transfer a small volume containing the dissected brain directly into a tube with ice-cold 1x PBS. Repeat this step until a total of five brains per biological replicate is reached. To prevent the brain from sticking to the pipette tip, condition it with the solution from the dissection plate first by pipetting up and down several times.
- Once the dissection is complete, perform a brief 10-s centrifugation at 2,000 x g to collect the brains at the bottom of the tube.
- Carefully replace the 1x PBS with 50 µL of 0.2 N Perchloric Acid (PCA) on ice.
CAUTION: PCA is highly corrosive. Prepare the aliquots under a fume hood beforehand and use appropriate Personal Protective Equipment while handling. This includes chemical-resistant goggles, heavy-duty neoprene gloves, and a rubber apron.
NOTE: Alternatively, brains may also be collected immediately in 50 µL of 0.2 N PCA. If this is the case, use a needle to transfer the brains to avoid unwanted transfer of PBS. - Use an ultrasonic homogenizer to homogenize the tissue. Control the amplitude to avoid heat generation. Here we use 10 kHz with cycles of short 3-s pulses followed by 3 s on ice.
- Centrifuge the sample for 15 min at 15,000 x g and 4 °C. Collect 40 µL of the supernatant in a new tube stored on ice. Keeping the samples in PCA prevents BA oxidation. Avoid collecting tissue in this step since it will likely clog the system. If some tissue is collected, syringe filters can be used, but sample recovery will be negatively affected.
- Right before running the samples, add 8 µL of 1 M Sodium Acetate. This brings the sample pH closer to the mobile-phase pH of 3.5, preserving peak shape as the sample passes through the detector. Samples are ready to be injected.
3. Preparation of mobile phase
- Prepare 1 L of citrate-acetate mobile phase by adding 870 mL of ultrapure water into a glass bottle.
- Add 5.61 g of sodium acetate trihydrate and 8.79 g of citric acid anhydrous to the glassware and mix until dissolved. Ensure the pH is 3.5; if not, adjust accordingly.
- In a fume hood, add 130 mL of HPLC-grade methanol.
- Add 130 mg of sodium 1-octanesulfonate hydrate and mix thoroughly.
- Vacuum filter the solution using a 0.2 µm filter while stirring for 1 h. Stirring allows trapped gas to escape the solution, and the vacuum helps with that and with filtration.
- Sonicate the solution in an ultrasonic bath (42 kHz) for 30 min to remove air bubbles.
- Wrap the container in aluminum foil and label appropriately.
NOTE: Reagent quality greatly affects retention times. Using HPLC-grade reagents helps keep consistency across runs. Using the same reagents when re-making the mobile phase also maintains consistency in results.
4. Preparation of standards
- To prepare standards, individually weigh 10 mg of OA, DA, and 5-HT on weigh paper.
- Place the weighed amount in separate 125 mL glass bottles to make individual stock solutions. Re-weigh the empty paper to calculate the exact amount of OA, DA, or 5-HT that made it to the bottles.
- Calculate the amount of solvent to add to reach a concentration of 100 ng/µL of the analyte. If the complete 10 mg were added, use 100 mL of solvent. For OA and DA, use 0.1 M Hydrochloric acid as the solvent. For 5-HT, use 0.1 M acetic acid instead.
- Supplement the standards with 2Na-EDTA to a final concentration of 1 mg/mL. Thoroughly mix until completely dissolved. Wrap the bottle in aluminum foil to protect from light and store at 4 °C.
NOTE: Standards can be stored for up to 3 months under these conditions.
5. Preparation of calibration solutions
NOTE: To make a calibration curve, prepare three standards with mixed BAs at different concentrations. In this example, we use 0.03 ng/µL, 0.01 ng/µL, and 0.001 ng/µL working solutions. Injecting 10 µL will yield standard amounts of 0.3 ng, 0.1 ng, and 0.01 ng, respectively.
- Start by preparing a 1 ng/µL stock mix by adding 1 µL of each 100 ng/µL BA stock to 97 µL of 0.02 M Acetic Acid-1 mg/mL 2Na-EDTA. Mix thoroughly.
- Take 2 µL of the 1 ng/µL stock and add it to 64.6 µL of 0.02 M Acetic Acid-1 mg/mL 2Na-EDTA. Mix thoroughly. This is the 0.03 ng/µL working solution.
- Take 2 µL of the 1 ng/µL stock and add it to 18 µL of 0.02 M Acetic Acid-1 mg/mL 2Na-EDTA. Mix thoroughly. This is the 0.1 ng/µL working solution. This solution is not injected in this protocol. Instead it is only used for serial dilutions.
- Take 4 µL of the 0.1 ng/µL stock and add it to 36 µL of 0.02 M Acetic Acid-1 mg/mL 2Na-EDTA. Mix thoroughly. This is the 0.01 ng/µL working solution.
- Finally, take 4 µL of the 0.01 ng/µL stock and add it to 36 µL of 0.02 M Acetic Acid-1 mg/mL 2Na-EDTA. Mix thoroughly. This is the 0.001 ng/µL working solution.
NOTE: Place these standards in a box protected from light. All working solution standards need to be prepared fresh.
6. Injection setup and run
NOTE: All the HPLC systems operate under the same principles. However, differences in the hardware can make a big difference in retention time and run length. Moreover, the sensitivity of the ECD will render different detection limits. These will need to be defined empirically. This study used a high-performance liquid chromatography (HPLC) system equipped with a reverse-phase C18 column.
- Turn on the HPLC equipment, including the pump and the electrochemical detector. Set the flow rate to 100 µL/min and allow the electrochemical detector to reach a stable baseline. This should take 10 min to 30 min.
- Once samples are ready to be injected, set the flow rate to 500 µL/min. Let the system stabilize for 5 min. In the meantime, flush a 20 µL Hamilton syringe three times with ultrapure water.
- Draw 10–20 µL of sample into the syringe. The volume will depend on the sample loop capacity. Refer to the manual of the sample loop for more information.
- Ensure no bubbles are present in the syringe when injecting. Any gas trapped will interfere with the correct mobile phase pumping or ECD measurements. If bubbles are present, return the sample and try to load the syringe again.
- Insert the needle completely into the injection port. Set the lever to the load position and inject the sample by pushing the syringe plunger until all the liquid has exited the syringe. Lower the lever of the injector to the “inject” position. The run has started and, under these conditions, should be completed in 30–35 min.
- If there are more samples to run, let the system run for 10–15 min at 500 µL/min before injecting the next one.
NOTE: If there are consistent fluctuations of the ECD signal, check for changes in the system pressure. Gas trapped in the system can cause uneven flow and a higher-than-normal background. Purge the system with a fresh solution at high speed, bypassing the ECD, to resolve this issue.
7. Data retrieval and analysis
NOTE: There are several available analog-to-digital converters and software to collect and analyze this type of data. They may differ in how they process data; however, they share general principles. This study used data conversion software and chromatography data acquisition and analysis software, respectively.
- Changes in current/voltage derived by the oxidation of the BAs, captured by the ECD, will be converted by the analog-to-digital converter. The BA concentration is proportional to the change in current/voltage.
- Use the area under the curve obtained from the current vs time graphs from the BAs standard runs to estimate a calibration curve. Values will be represented by a linear regression in a Current/Voltage (nA or mV) vs Amount (ng) graph.
- Using the linear equation, calculate the concentration of BAs in your sample.
Results
Biological compounds are oxidized at different voltages. In a complex matrix, such as brain tissues, choosing the appropriate ECD potential will enable cleaner, more accurate quantification. Here, we chose two different voltages to show the impact of this factor on the identification and quantification of OA, DA, and 5-HT in Drosophila brain samples. Using 950 mV, we can readily detect these 3 amines in a mixture (Figure 1A), while only dopamine and serotonin are observed at 650 mV (Figure 1B). This is consistent with the oxidation voltages for these compounds: 900–1000 mV for OA, 600–700 mV for DA, and 5-HT. The retention times for OA, DA, and 5-HT are 6 min, 11 min, and 29 min, respectively. Quantifying three different amounts, 0.01 ng, 0.1 ng, and 0.3 ng, yields comparable calibration curves for 950 mV or 650 mV (Figure 1C,D, respectively). These curves demonstrate the linearity and sensitivity of the assay for each analyte across the tested concentration range at each detection potential.
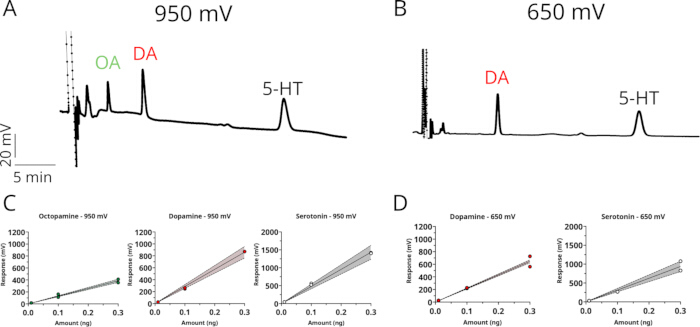
Figure 1: Detection and quantification of biogenic amines by HPLC-ECD at two oxidation potentials. (A,B) Representative chromatograms showing separation of octopamine (OA), dopamine (DA), and serotonin (5-HT) standards detected at an applied potential of (A) 950 mV or (B) 650 mV. Vertical axis: response (mV); horizontal axis: retention time (5 min per tick, indicated by the scale bar). (C,D) Calibration curves for each analyte at (C) 950 mV and (D) 650 mV, plotting peak response (mV) against standard amounts (ng; 0.01–0.3 ng). Solid lines represent linear regression fits, shaded bands indicate 95% confidence intervals, and filled/open circles represent 2 individual standard injections per concentration. Please click here to view a larger version of this figure.
Complex samples like those from brain extracts are usually responsible for a substantial biological background. Following the protocol described here, we set out to determine the effect of the electrode voltage on the detection and quantification of BAs in brain samples. Adult male flies were collected when the lights were switched on after 2 full days of entrainment, and brains were dissected in ice-cold PBS and then placed in 0.2 N PCA on ice. After tissue dissociation and centrifugation, the supernatant was equilibrated with 1 M sodium acetate, and 10 µL was injected. Setting the electrode potential to 950 mV gives peaks for octopamine, dopamine, and serotonin at the respective retention times (Figure 2A, black trace). Their identities were further confirmed by analyzing a sample spiked with known amounts (0.01 ng each) of each BA (Figure 2A, red trace). However, several additional peaks are observed near the analytes of interest, which can complicate quantification. Setting the electrode potential to 650 mV solves this problem at the expense of octopamine detection (Figure 2B). As in Figure 1, OA is not resolved at 650 mV, consistent with its higher oxidation potential.
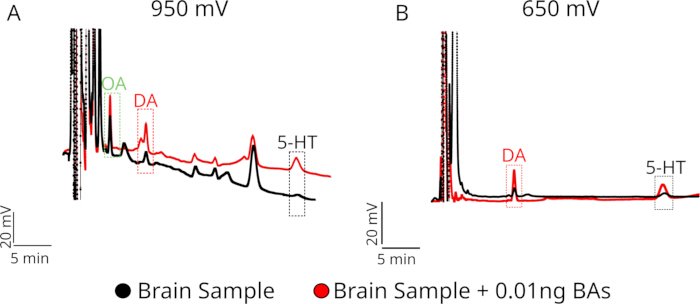
Figure 2: Identification of endogenous biogenic amines in brain samples by peak enhancement (spike-in) at two oxidation potentials. (A,B) Representative chromatograms of a brain tissue extract analyzed by HPLC-ECD at an applied potential of (A) 950 mV or (B) 650 mV, shown before (black trace, "Brain Sample") and after (red trace, "Brain Sample + 0.01 ng BAs") spiking with a known amount (0.01 ng) of octopamine (OA), dopamine (DA), and serotonin (5-HT) standards. Dashed boxes indicate the retention time windows for each analyte. Vertical axis: response (20 mV, indicated by scale); horizontal axis: retention time (5 min, indicated by scale bar). Please click here to view a larger version of this figure.
Following the same protocol, we used HPLC-ECD to detect differences in biogenic amine content in the brains of flies expressing α-synuclein in dopaminergic neurons (TH-T2A-GAL4 > UAS-SNCA.J34), a fly model of Parkinson’s disease. Previous studies using a PD model based on mutations in the gene Pink1 have shown differences in dopamine levels in flies as young as 0-3 days old35. Here, 3–6-day-old flies were used to compare dopamine and serotonin levels. Dopamine levels were significantly elevated in PD flies, as compared to control flies (Figure 3A), while serotonin levels were unchanged (Figure 3B). Elevated dopamine levels in the early stages may reflect compensatory mechanisms prior to the onset of PD symptoms in this model (Reviewed in Blesa J et al.36).
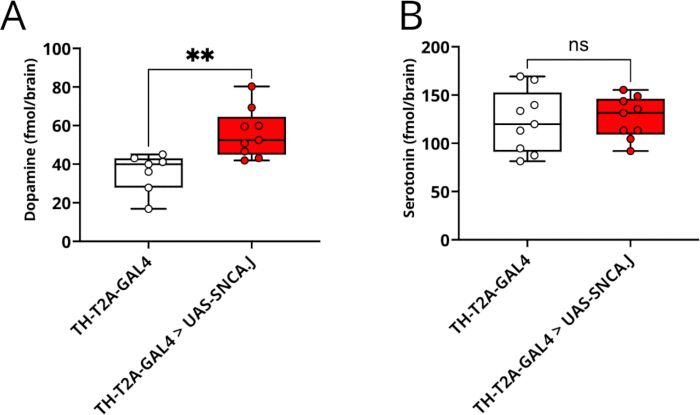
Figure 3: Quantification of dopamine and serotonin levels in a Drosophila model of Parkinson's disease by HPLC-ECD. Whole-brain tissue levels of dopamine (A) and serotonin (B), expressed as fmol/brain, in control (TH-T2A-GAL4, n = 7 in A and n = 9 in B) and Parkinson's disease model (TH-T2A-GAL4 > UAS-SNCA.J, n = 9) flies. In this model, the codon-optimized human α-synuclein sequence (SNCA.J) is selectively overexpressed in dopaminergic neurons under control of the TH-T2A-GAL4 driver. Data are presented as box-and-whisker plots (median, interquartile range, and min–max) overlaid with individual data points, each representing one biological replicate (n) comprising 5 pooled brains. Statistical significance was determined by the unpaired t-test (**p < 0.01, ns, not significant). Please click here to view a larger version of this figure.
Discussion
HPLC is a highly customizable separation technique. As such, many steps of this protocol can be modified. Reliable results depend on careful attention and consistency of these modifications. The relative polarity of the stationary and mobile phases defines the separation mode: normal phase pairs a polar stationary phase with a non-polar mobile phase, while reverse phase pairs a non-polar stationary phase with a polar mobile phase. Biogenic amine analysis in biological tissue typically uses reverse-phase conditions. This study used a citrate-acetate mobile phase with methanol as the main solvent; however, similar measurements were successfully run with a phosphate buffer with acetonitrile as the solvent22,26,35. Thus, buffer composition can change depending on the desired peak resolution and shape. Changing mobile-phase composition would likely change elution times37. This might cause peak overlap, making quantification difficult or impossible. To troubleshoot, pH changes are the most effective solution because analyte interaction with the column depends heavily on their pKa38.
Amines can undergo oxidative degradation, so the tissue collection and treatment are important points in the protocol. Collecting samples on dry ice and keeping them at -80 °C until processing is an important step. Once dissected, samples must be homogenized quickly in acidic conditions. This prevents the decomposition of the BAs30,39,40. In this context, other acids may be useful if access to PCA is limited. A combination of formic acid, a non-explosive oxidizer alternative to PCA, and methanol might also be used for extraction; however, we have not tested this in Drosophila brain samples41.
The choice of detector determines what can be measured and at what sensitivity; common options include UV/visible, fluorescence, and mass spectrometry detectors, each suited to different analyte properties and sensitivity requirements. Electrochemical detection is particularly well-suited to catecholamines and indolamines such as DA and 5-HT, which are oxidized directly at the working electrode to generate a current proportional to their concentration. ECD has been cited as a simpler and more accurate technique compared to alternative detection methods such as fluorescence detection and ultraviolet detection, both of which often require more steps before samples can be analyzed, making them more complex or time-consuming42,43. HPLC-ECD offers outstanding sensitivity as it can detect analytes in biological samples at femtomolar concentrations44. Given that a single Drosophila brain provides only a very small quantity of tissue, this level of sensitivity is essential. Critically, HPLC-ECD also allows the simultaneous quantification of multiple biogenic amines from a single sample, meaning that the complete monoamine profile of a Drosophila central nervous system preparation can be captured in a single analytical run.
The method does have inherent limitations that define its scope. While this method is highly sensitive, quantifying BAs from Drosophila samples requires pooling brains. Thus, no single-brain detection has been reported, as with other approaches45. Another drawback is electrode fouling. Electrode fouling can occur over time as oxidative byproducts form a thin insulating layer over the surface, affecting sensitivity and causing signal drift46. This is particularly evident in our results when using a higher oxidation voltage (Figure 2).To account for such changes, replicating standard injections after a few runs can be helpful. Standard injections would also need to be repeated every time a change is made to the mobile phase or detection potential to account for any shifts in the peaks observed. Cleaning the electrode periodically can help with this issue. Another drawback is that HPLC-ECD provides a bulk, static measurement of amine content integrated across the tissue submitted for analysis. It gives no information about where in the brain those amines are located, nor the relative contributions of specific neuronal populations. Non-electroactive compounds such as GABA and glutamate are not detectable under standard ECD conditions and require separate assays. Perhaps most importantly, HPLC-ECD is a targeted method. It cannot be used to identify unknown molecules that may be correlated with a behavioral phenotype because it relies entirely on comparing retention times with known, well-characterized standards. For untargeted discovery of neurochemical correlates of behavior, techniques like LC-MS/MS would be better suited, however, at a higher cost.
Within these boundaries, HPLC-ECD addresses a well-defined and biologically meaningful set of questions in Drosophila disorder models. It can determine whether a genotype or treatment alters steady-state amine levels and whether such changes are selective to one transmitter system or affect the broader monoamine profile. It can track neurochemical changes across developmental stages or disease progression, providing evidence for presymptomatic biochemical states that precede detectable behavioral phenotypes47. It is also well-suited for evaluating whether a pharmacological or genetic intervention normalizes, overshoots, or fails to rescue amine deficits in a given model26. Addressing questions such as at what stage each amine shifts, whether fixing one system perturbs another, and whether a developmental perturbation leaves a lasting neurochemical trace are precisely what a bulk, sensitive, multi-amine method is built for. Used alongside the behavioral assays and genetic tools available in Drosophila, HPLC-ECD provides a quantitative biochemical layer that substantially broadens the interpretive scope of these disorder models.
Disclosures
The authors declare no conflicts of interest.
Acknowledgements
This work was supported by National Institutes of Health grant R00NS133470 (S.H.). The content is solely the responsibility of the authors and does not necessarily represent the official views of the National Institutes of Health. R.V.Z is supported by Subvención a la Instalación en la Academia (SIA) N°85250142, and J.M.C. is supported by FONDECYT 1231556, Agencia Nacional de Investigación y Desarrollo, Chile.
Materials
| Name | Company | Catalog Number | Comments |
|---|---|---|---|
| (+-) Octopamine Hydrochloride | Sigma Aldrich | 770-05-8 | |
| 500 mL Filter Unit | Thermo Scientific | FB12566504 | 0.2 um aPES Membrane, 75 mm diameter |
| Acetic Acid, Glacial | Fisher Scientific | 64-19-7 | |
| Citric Acid Anhydrous | USB | 77-92-9 | |
| Clarity Chromatography Software | Data Apex | Version 10.1 | |
| Colibrick Data Converter | Data Apex | A/D converter | |
| Dopamine Hydrochloride | Sigma Aldrich | 62-31-7 | |
| Dumont #5 forceps (Dumoxel Biology) | Fine Science Tools | 11252-30 | Dissection forceps |
| EDTA, Disodium Salt, Dihydrate, Crystal (2Na-EDTA) | J.T Baker | 6381-92-6 | |
| EICOMPAK-5ODS | Eicom | 680.060.00 | Reverse Phase Separation Column |
| EMD Milipore Synergy UV-R Ultrapure (Type 1) Water | Milipore | ||
| Hamilton Syringe 25ul (22s/2"/3) | Hamilton | 80465 | |
| HTEC-600 | Eicom | HPLC Machine | |
| Hydrochloric Acid | Sigma Aldrich | 7647-01-0 | |
| Light Duty Tissue Wipes | VWR | 82003-820 | |
| Methanol HPLC Grade | Fisher Scientific | 67-56-1 | 0.2 micron filtered |
| Perchloric Acid, 70% in water | Fisher Scientific | AC424032500 | Use for 0.2 N PCA |
| Serotonin Hydrochloride 98% | Fisher Scientific | 153-98-0 | |
| Sodium 1-octanesulfonate hydrate, HPLC grade, 99+% | Thermo Scientific | 5324-84-5 | |
| Sodium Acetate, Trihydrate, Crystal | J.T Baker | 6131-90-4 | |
| Sonicator 1510 Bransonic Ultrasonic Cleaner | Branson | Model #: 1510R-MT | Sonicator |
| Ultrasonic Processor Sonicator | Fisherbrand | Model FB50 | With CL18 probe |
References
- Barron AB, Søvik E, Cornish JL. The roles of dopamine and related compounds in reward-seeking behavior across animal phyla. Front Behav Neurosci. 2010;4:163.
- Cardozo Pinto DF, et al. Opponent control of reinforcement by striatal dopamine and serotonin. Nature. 2025;639(8053):143-152.
- Jiang Y, et al. Monoamine neurotransmitters control basic emotions and affect major depressive disorders. Pharmaceuticals (Basel). 2022;15(10):1203.
- Swallow JG, Bubak AN, Grace JL. The role of monoamines in modulating behavior. Curr Zool. 2016;62(3):253-255.
- Ramesh S, Arachchige ASPM. Depletion of dopamine in Parkinson's disease and relevant therapeutic options: A review of the literature. AIMS Neurosci. 2023;10(3):200-231.
- Elgueta-Reyes M, Hidalgo S, Campusano JM. Beyond vertebrates: Drosophila melanogaster as a model to study negative symptoms of schizophrenia. Front Psychiatry. 2025;16:1622281.
- Kasture AS, Hummel T, Sucic S, Freissmuth M. Big lessons from tiny flies: Drosophila melanogaster as a model to explore dysfunction of dopaminergic and serotonergic neurotransmitter systems. Int J Mol Sci. 2018;19(6):1788.
- Owald D, Lin S, Waddell S. Light, heat, action: Neural control of fruit fly behaviour. Philos Trans R Soc Lond B Biol Sci. 2015;370(1677):20140211.
- Rosikon KD, Bone MC, Lawal HO. Regulation and modulation of biogenic amine neurotransmission in Drosophila and Caenorhabditis elegans. Front Physiol. 2023;14:970405.
- Pandey UB, Nichols CD. Human disease models in Drosophila melanogaster and the role of the fly in therapeutic drug discovery. Pharmacol Rev. 2011;63(2):411-436.
- Duffy JB. GAL4 system in Drosophila: A fly geneticist's Swiss army knife. Genesis. 2002;34(1-2):1-15.
- Feany MB, Bender WW. A Drosophila model of Parkinson's disease. Nature. 2000;404(6776):394-398.
- Narwal S, Singh A, Tare M. Analysis of α-syn and parkin interaction in mediating neuronal death in Drosophila model of Parkinson's disease. Front Cell Neurosci. 2024;17:1295805.
- Park J, et al. Mitochondrial dysfunction in Drosophila PINK1 mutants is complemented by parkin. Nature. 2006;441(7097):1157-1161.
- Aryal B, Lee Y. Disease model organism for Parkinson disease: Drosophila melanogaster. BMB Rep. 2019;52(4):250-258.
- Clark IE, et al. Drosophila pink1 is required for mitochondrial function and interacts genetically with parkin. Nature. 2006;441(7097):1162-1166.
- Park S, Kozhushko N, Wight TH, Whitworth AJ. Insights into PINK1/Parkin function and dysfunction from Drosophila models. Biochem J. 2025;483(1):BCJ20253459.
- Mohite GM, et al. Parkinson's disease associated α-synuclein familial mutants promote dopaminergic neuronal death in Drosophila melanogaster. ACS Chem Neurosci. 2018;9(11):2628-2638.
- Ordonez DG, Lee MK, Feany MB. α-Synuclein induces mitochondrial dysfunction through spectrin and the actin cytoskeleton. Neuron. 2018;97(1):108-124.e6.
- Eyles D, Feldon J, Meyer U. Schizophrenia: Do all roads lead to dopamine or is this where they start? Evidence from two epidemiologically informed developmental rodent models. Transl Psychiatry. 2012;2(2):e81.
- Calcagno B, Eyles D, van Alphen B, van Swinderen B. Transient activation of dopaminergic neurons during development modulates visual responsiveness, locomotion and brain activity in a dopamine ontogeny model of schizophrenia. Transl Psychiatry. 2013;3(1):e206.
- Hidalgo S, et al. The behavioral and neurochemical characterization of a Drosophila dysbindin mutant supports the contribution of serotonin to schizophrenia negative symptoms. Neurochem Int. 2020;138:104753.
- Hidalgo S, Campusano JM, Hodge JJL. Assessing olfactory, memory, social and circadian phenotypes associated with schizophrenia in a genetic model based on Rim. Transl Psychiatry. 2021;11(1):292.
- Hidalgo S, Campusano JM, Hodge JJL. The Drosophila orthologs of the schizophrenia-associated CACNA1A and CACNA1B voltage-gated calcium channels regulate memory, sleep and circadian rhythms. Neurobiol Dis. 2021;155:105394.
- Shao L, et al. Schizophrenia susceptibility gene dysbindin regulates glutamatergic and dopaminergic functions via distinctive mechanisms in Drosophila. Proc Natl Acad Sci U S A. 2011;108(46):18831-18836.
- Zárate RV, et al. An early disturbance in serotonergic neurotransmission contributes to the onset of Parkinsonian phenotypes in Drosophila melanogaster. Cells. 2022;11(9):1544.
- Nakao K, et al. 5-HT2A receptor dysregulation in a schizophrenia relevant mouse model of NMDA receptor hypofunction. Transl Psychiatry. 2022;12(1):168.
- Zhou W, et al. DISC1 mutant macaques capture behavioral and neural hallmarks of psychiatric disease. Natl Sci Rev. 2026;13(8):nwag200.
- Chen A, et al. Dispensable, redundant, complementary, and cooperative roles of dopamine, octopamine, and serotonin in Drosophila melanogaster. Genetics. 2013;193(1):159-176.
- Plenis A, Olędzka I, Kowalski P, Miękus N, Bączek T. Recent trends in the quantification of biogenic amines in biofluids as biomarkers of various disorders: a review. J Clin Med. 2019;8(5):640.
- Fredj Z, Sawan M. Advanced nanomaterials-based electrochemical biosensors for catecholamines detection: challenges and trends. Biosensors (Basel). 2023;13(2):211.
- Hori A, Nitta T, Inamori Kichiro, Kanoh H, Kuraishi T. High-throughput single-fly LC-MS/MS for quantitative profiling of biogenic amines in Drosophila. PLoS One. 2026;21(1):e0341188.
- Davla S, et al. An LC-MS/MS method for simultaneous analysis of up to six monoamines from brain tissues. J Chromatogr B. 2023;1216:123604.
- Chouhan AK, et al. Uncoupling neuronal death and dysfunction in Drosophila models of neurodegenerative disease. Acta Neuropathol Commun. 2016;4(1):62.
- Molina-Mateo D, et al. Characterization of a presymptomatic stage in a Drosophila Parkinson's disease model: unveiling dopaminergic compensatory mechanisms. Biochim Biophys Acta Mol Basis Dis. 2017;1863(11):2882-2890.
- Blesa J, et al. Compensatory mechanisms in Parkinson's disease: circuits adaptations and role in disease modification. Exp Neurol. 2017;298(Pt B):148-161.
- Snyder LR, Quarry MA, Glajch JL. Solvent-strength selectivity in reversed-phase HPLC. Chromatographia. 1987;24(1):33-44.
- Lewis JA, et al. Computer simulation for the prediction of separation as a function of pH for reversed-phase high-performance liquid chromatography: I. Accuracy of a theory-based model. J Chromatogr A. 1992;592(1):183-195.
- Chan EC, Wee PY, Ho PC. Evaluation of degradation of urinary catecholamines and metanephrines and deconjugation of their sulfoconjugates using stability-indicating reversed-phase ion-pair HPLC with electrochemical detection. J Pharm Biomed Anal. 2000;22(3):515-526.
- Bicker J, Fortuna A, Alves G, Falcão A. Liquid chromatographic methods for the quantification of catecholamines and their metabolites in several biological samples: a review. Anal Chim Acta. 2013;768:12-34.
- Miękus N, et al. Comparison of three extraction approaches for the isolation of neurotransmitters from rat brain samples. Int J Mol Sci. 2018;19(6):1560.
- Van Dam D, Vermeiren Y, Aerts T, De Deyn PP. Novel and sensitive reversed-phase high-pressure liquid chromatography method with electrochemical detection for the simultaneous and fast determination of eight biogenic amines and metabolites in human brain tissue. J Chromatogr A. 2014;1353:28-39.
- Han S, et al. A sensitive HPLC-ECD method for detecting serotonin released by RBL-2H3 cells stimulated by potential allergens. Anal Methods. 2015;7(20):8918-8924.
- Guiard BP, Gotti G. The high-precision liquid chromatography with electrochemical detection (HPLC-ECD) for monoamines neurotransmitters and their metabolites: a review. Molecules. 2024;29(2):496.
- Fang H, Vickrey TL, Venton BJ. Analysis of biogenic amines in a single Drosophila larva brain by capillary electrophoresis with fast-scan cyclic voltammetry detection. Anal Chem. 2011;83(6):2258-2264.
- Hanssen BL, Siraj S, Wong DKY. Recent strategies to minimise fouling in electrochemical detection systems. Rev Anal Chem. 2016;35(1):1-28.
- Meissner WG. When does Parkinson's disease begin? From prodromal disease to motor signs. Rev Neurol (Paris). 2012;168(11):809-814.
Reprints and Permissions
This article has been published
Video Coming Soon