This workflow integrates bulk and single-cell transcriptomics with preliminary patient tissue assays to prioritize MMP1 in diabetic foot ulcer. MMP1 showed a fibroblast-centered expression pattern and higher tissue abundance, supporting an association with matrix remodeling while leaving causality and clinical utility unresolved.
Research Article
Integrative Bulk and Single-Cell Transcriptomics with Tissue Validation Prioritizes MMP1 in Diabetic Foot Ulcer
* These authors contributed equally
In This Article
Summary
Abstract
Cellular sources of reproducible transcriptomic changes in diabetic foot ulcer (DFU) remain incompletely defined. This study integrated differential-expression analysis, weighted gene co-expression network analysis (WGCNA), diabetic peripheral neuropathy (DPN) gene screening, exploratory machine-learning feature selection, two external bulk-transcriptomic datasets, single-cell analysis, traditional Chinese medicine (TCM) network analysis, and patient-tissue quantitative polymerase chain reaction (qPCR) and western blotting. In GSE199939 (10 DFU and 11 control samples), 3,691 differentially expressed genes were identified, and the WGCNA blue module was strongly associated with DFU (r = 0.97, p = 5 × 10-13). Intersecting the differentially expressed genes, blue-module hub genes, and 1,062 DPN-related genes yielded 77 candidates. CCL7, CHEK1, MKI67, MMP1, MMP13, and TRPV2 were supported by at least two feature-selection methods; complete separation in support vector machine recursive feature elimination raised concerns about discovery-cohort overfitting. MMP1 showed the largest discovery-cohort expression change (log2 fold change = 9.854; adjusted p = 1.24 × 10⁻²⁹). In the merged GSE68183/GSE80178 matrix, MMP1 had an adjusted p of 0.0159 and an area under the receiver operating characteristic curve (AUC) of 0.981. In GSE134431, MMP1 expression was nominally higher in DFU than in non-ulcerated diabetic foot skin (p = 0.0225; adjusted p = 0.135; AUC = 0.808). Analysis of 69,944 cells from 24 samples showed the highest mean MMP1 expression in fibroblasts, with higher sample-level expression in DFU fibroblasts, keratinocytes, and endothelial cells. Patient-tissue assays showed higher MMP1 mRNA abundance in four matched pairs (paired test on ΔCq, p = 3.04 × 10⁻⁵) and higher protein abundance in three matched pairs (paired p = 0.0107). Statistical replication was incomplete. Findings suggest a fibroblast-centered matrix-remodeling association, subject to limitations from transcripts per million (TPM) input in count-based discovery analysis, incomplete single-cell preprocessing records, and small tissue-assay cohorts. Causality and clinical utility remain unestablished.
Introduction
Diabetic foot ulcer is a severe and recurrent complication of diabetes that arises from the convergence of neuropathy, repetitive mechanical loading, peripheral arterial disease, infection susceptibility, and impaired tissue repair. Contemporary estimates indicate that millions of people are affected worldwide each year, and healing is often prolonged, with substantial risks of recurrence, hospitalization, lower-extremity amputation, and death1. Prevention and management therefore depend not only on local wound care but also on identifying loss of protective sensation, reducing plantar pressure, treating infection and ischemia, and addressing systemic risk factors1,2. Diabetic peripheral neuropathy is particularly relevant because progressive sensory dysfunction can reduce awareness of pressure, trauma, and tissue breakdown, while motor and autonomic abnormalities may further alter foot biomechanics and skin integrity2,3. At the tissue level, neuropathic injury may coexist with neuroinflammation, microvascular dysfunction, metabolic stress, and defective repair, creating a wound environment in which injury persists despite standard care1,3.
Successful cutaneous healing requires coordinated inflammation, re-epithelialization, angiogenesis, fibroblast activation, extracellular matrix (ECM) deposition, and subsequent matrix remodeling. In diabetes, these processes may become temporally disorganized: inflammatory signals can remain active, keratinocyte migration may be impaired, endothelial responses may be insufficient, and fibroblasts may produce or organize an abnormal matrix. Fibroblasts are central to the stromal phase of repair because they synthesize matrix proteins, regulate collagen architecture, communicate with immune and epithelial cells, and contribute to wound contraction. Studies using patient-derived DFU fibroblasts have shown persistent abnormalities in ECM-related transcription and matrix assembly, supporting the view that fibroblast state is an important component of chronic wound biology4. Matrix metalloproteinases (MMPs) participate in this process by cleaving ECM substrates and enabling cell migration, tissue turnover, and remodeling; however, their effects depend on location, timing, substrate availability, and regulation by tissue inhibitors of metalloproteinases (TIMPs)5. An imbalance between proteolysis and matrix replacement may therefore be compatible with impaired repair, but increased expression of an individual MMP does not by itself establish a harmful or beneficial role. Matrix metalloproteinase 1 (MMP1), an interstitial collagenase capable of participating in fibrillar collagen turnover, has been reported as altered in DFU tissue, and prior clinical studies have linked MMP/TIMP profiles with wound status or healing trajectories6,7. These observations support further investigation of MMP1 in DFU.
Transcriptomic profiling provides a systematic approach for identifying molecular programs associated with DFU, but several methodological limitations complicate interpretation. Bulk-tissue datasets average signals across keratinocytes, fibroblasts, endothelial cells, immune cells, and other compartments, making it difficult to determine whether a candidate reflects altered expression within a cell type, shifts in cellular composition, or both. Comparability across datasets can also be reduced by differences in platforms, normalization strategies, tissue sampling locations, ulcer severity, infection status, disease stage, and reference tissue. Importantly, non-ulcerated diabetic foot skin represents a clinically relevant diabetic tissue comparator but is not interchangeable with healthy skin. Single-cell RNA sequencing can partially address the cellular-source problem by resolving heterogeneous cell populations and their transcriptional states. A previous single-cell and spatial transcriptomic study of DFU identified distinct fibroblast populations and demonstrated that fibroblast programs differ according to wound context and healing status8. These findings support the use of cell-resolved analysis to complement bulk transcriptomic data.
Feature-selection methods may help prioritize candidates from high-dimensional expression data, yet small-sample biomedical studies are particularly vulnerable to optimistic estimates and unstable gene selection. When the number of measured variables greatly exceeds the number of biological samples, apparent perfect separation can occur even when generalizable predictive information is limited. Reusing the same observations for feature selection, tuning, and performance assessment further inflates the AUC, making nested cross-validation, locked models, and genuinely independent test cohorts essential for evaluating predictive performance9,10. These concerns are relevant to DFU studies because publicly available cohorts are often small and heterogeneous. Traditional Chinese medicine ingredient-target-herb databases were additionally used only for hypothesis generation.
This study integrated bulk transcriptomics, WGCNA, DPN-related gene screening, machine-learning feature selection, external dataset assessment, single-cell analysis, TCM network analysis, and patient-tissue validation. Candidate genes identified in the discovery cohort were evaluated across additional transcriptomic datasets, and the leading candidate was localized to specific cell types using single-cell data. MMP1 was then examined at the mRNA and protein levels in patient tissue by qPCR and western blotting. This framework was designed to identify a reproducible DFU-associated candidate and characterize its cellular and biological context.
Protocol
Study design and data sources
The study, including the collection and use of patient tissue specimens for qPCR and western blot validation, was reviewed and approved by the Ethics Committee of Wuhan Fourth Hospital (approval No. KY2024-161-01). All procedures involving human tissue were conducted in accordance with the approved protocol and applicable ethical principles. The transcriptomic component of the study used publicly available, de-identified datasets. Written informed consent was obtained from all participants whose tissue specimens were used for the experimental validation. The publicly available transcriptomic datasets were analyzed in de-identified form, and consent procedures for the original data-generating studies were handled by the respective institutions.
This study integrated bulk transcriptomics, network analysis, feature selection, single-cell analysis, TCM network prediction, and patient-tissue validation. The discovery cohort was Gene Expression Omnibus (GEO) dataset GSE199939 (10 DFU and 11 control samples). External bulk-transcriptomic assessment included a merged GSE68183/GSE80178 matrix (9 DFU and 6 control samples) and GSE134431 (13 DFU and 8 non-ulcerated diabetic foot skin [DFS] samples). Single-cell analysis used a preprocessed, SingleR-annotated Seurat object derived from GSE165816, comprising 69,944 cells from 24 samples (14 DFU and 10 controls). Tissue assessment included four matched DFU–periwound patient pairs for qPCR and three matched pairs for western blotting, based on recovered assay records and author-confirmed pairing. All materials and equipment used in this study are listed in the Table of Materials.
Construction of the DPN-related gene set
DPN-related genes were retrieved from the National Center for Biotechnology Information (NCBI) Gene database using rentrez. Search terms included “diabetic peripheral neuropathy”, “diabetic neuropathy”, “diabetic polyneuropathy”, “painful diabetic neuropathy”, and “diabetic sensorimotor polyneuropathy”, restricted to Homo sapiens. Returned identifiers were mapped to official gene symbols, converted to uppercase, cleaned, and deduplicated. The database-derived genes were combined with a literature-curated DPN gene list and deduplicated, yielding 1,062 DPN-related genes. The complete search strings and identifier-cleaning code are included in the accompanying scripts; they also include diabetic neuropathies, diabetes combined with distal symmetric/symmetrical polyneuropathy or peripheral neuropathy, and the Diabetic Neuropathies MeSH term. The literature-derived component still requires citation-level provenance.
Discovery-cohort preprocessing and differential-expression analysis
The GSE199939 expression matrix was aligned to the phenotype table by sample identifier. Duplicate gene identifiers were made unique. The archived discovery analysis rounded the expression values and fitted a negative-binomial model using DESeq2 (version 1.48.2), with group as the design factor and DFU versus control as the contrast. Genes with missing adjusted p values were excluded. Multiple testing was controlled using the Benjamini–Hochberg (BH) procedure. The archived differentially expressed gene (DEG) list used an absolute log2 fold change greater than 1 and BH-adjusted p < 0.05. Comparison with the public GEO source confirmed that the input was TPM, rather than raw read counts. Rounding TPM does not meet the raw-count requirement of DESeq2. The original estimates are retained, but the validity of the discovery statistics and dependent WGCNA and feature-selection results remains unresolved pending appropriate reanalysis. The source comparison is documented in the supplementary archive.
For visualization, the DESeq2 variance-stabilizing transformation (VST) was applied with blind = FALSE. Principal component analysis (PCA) was performed on the VST expression matrix. The heatmap used row-wise z scores for the 50 genes with the smallest adjusted p values. The PCA implementation centered and scaled gene-wise transformed values using prcomp with scale. = TRUE.
Weighted gene co-expression network analysis
For WGCNA, genes with counts greater than 5 in at least three GSE199939 samples were retained. Size factors were estimated with DESeq2, VST was applied with blind = TRUE, and the 5,000 genes with the largest across-sample variance were selected. Sample and gene quality was assessed using goodSamplesGenes, and average-linkage hierarchical clustering was used for sample-level quality assessment.
A signed network was constructed with WGCNA (version 1.74). Candidate powers of 1–10 and 12–30 in increments of 2 were evaluated using pickSoftThreshold; a scale-free topology fit target of 0.85 was used, and the selected soft-thresholding power was 18. Modules were identified with blockwiseModules using a signed adjacency and signed topological overlap matrix, Pearson correlation, minimum module size of 30, merge cut height of 0.25, reassignment threshold of 1 × 10⁻⁶, pamRespectsDendro = FALSE, and maximum block size of 10,000.
Module eigengenes were correlated with a binary DFU trait. Non-gray modules with |r| > 0.5 and p < 0.05 were considered DFU-associated. For each associated module, gene significance (GS) was defined as the Pearson correlation between gene expression and DFU status, and module membership (MM) as the Pearson correlation between gene expression and the corresponding module eigengene. Hub genes were defined by |MM| > 0.8 and |GS| > 0.5. The blue module, which showed the strongest positive association with DFU, was carried forward. Its hub genes were intersected with the DEGs and the DPN-related gene set. The reported hub threshold therefore uses the absolute values of both MM and GS, regardless of correlation sign.
Machine-learning-based feature prioritization
The 77 genes shared by the DEG, blue-module hub-gene, and DPN-related gene sets were evaluated in GSE199939. Duplicate gene symbols were collapsed by their mean expression. The candidate-gene matrix was log2-transformed as when the maximum value exceeded 50, zero-variance features were removed, and retained features were standardized. A random seed of 123 was used. The implemented sequence was cohort-wide candidate screening, duplicate-symbol collapsing, conditional log transformation, zero-variance filtering, full-cohort centering and scaling, and algorithm-specific feature selection. DEG and WGCNA screening used the full discovery cohort before algorithm-level cross-validation. The reported workflow therefore does not establish leakage-free nested validation, and its internal AUCs cannot be used as unbiased estimates of predictive performance.
Three feature-selection procedures were applied. First, least absolute shrinkage and selection operator (LASSO) logistic regression was fitted with glmnet (version 5.0), binomial family, alpha = 1, classification error as the cross-validation measure, no additional standardization, and five-fold cross-validation constrained by the smaller class size. Features at lambda.1se were selected; lambda.min was used only if lambda.1se selected no gene. Second, a random forest with 1,000 trees was fitted using randomForest (version 4.7-1.2); genes with a mean decrease in Gini at least as large as the mean importance across candidate genes were retained. Third, linear support vector machine recursive feature elimination (SVM-RFE) was implemented with e1071 (version 1.7-17), ranking features by the squared linear weight on the full cohort before evaluating progressively smaller feature subsets by leave-one-out cross-validation (LOOCV) AUC. The ranking was not recomputed within each training fold. Linear SVM fitting used scale = FALSE and probability = TRUE without an explicit cost-tuning grid. LASSO penalty selection used its internal cross-validation without a separate outer evaluation loop, and random-forest importance was calculated from the full cohort.
No gene was selected by all three methods; therefore, genes supported by at least two methods were retained. SVM-RFE produced an AUC of 1.00 across all evaluated subset sizes, and the smallest tied subset was selected. Because this complete separation raised concerns about overfitting and optimistic assessment in the small discovery cohort, the SVM-RFE AUC was not interpreted as an estimate of clinical performance. No locked multigene model was tested in an external cohort; external receiver operating characteristic (ROC) analyses assessed individual candidate-gene expression. Inspection of the analysis script confirmed that preprocessing and SVM feature ranking were not confined to training folds. The same LOOCV results were used to choose the subset size, without an outer evaluation loop. Consequently, this workflow contains information leakage and supports exploratory feature prioritization only.
Functional enrichment analysis
Gene Ontology (GO) and Kyoto Encyclopedia of Genes and Genomes (KEGG) over-representation analyses were performed on the six-gene panel. Gene symbols were mapped to Entrez identifiers with org.Hs.eg.db (version 3.21.0). GO analysis was performed with clusterProfiler (version 4.16.0) across biological process, cellular component, and molecular function ontologies. KEGG enrichment used the human organism code (hsa). Significant terms were defined as nominal p < 0.05 and BH-adjusted p < 0.05. Because only six genes were included, enrichment analysis was used primarily for functional annotation. The KEGG script used local KEGG.db annotations with enrichKEGG(use_internal_data = TRUE); the annotation release must be documented. The GO and KEGG scripts did not supply a custom universe, so the annotation databases defined the default backgrounds.
External bulk-transcriptomic assessment
For the merged GSE68183/GSE80178 matrix, gene symbols were standardized and duplicate symbols were collapsed by mean expression across matching rows. The six candidate genes were aligned to the phenotype file. Because the available files did not fully document the upstream merging and batch-correction procedure, this dataset was analyzed as provided and interpreted cautiously. Consequently, neither the removal of batch effects nor the independence of the group signal from study effects can be established from the supplied processing record. This matrix provides exploratory cross-dataset support rather than definitive replication.
For GSE134431, the six candidate genes were extracted from the reads per kilobase per million mapped reads (RPKM) matrix and transformed as log2(RPKM + 1). DFS was used as the reference group and DFU as the comparison group. DFS represents non-ulcerated diabetic foot skin. The originally submitted Figure 4C plotted raw RPKM; the revised panel uses the stated log2(RPKM + 1) scale. Two-sided Wilcoxon tests with the normal approximation and continuity correction and automatically oriented ROC analyses were verified on both scales and gave identical p values and AUCs because the transformation is strictly monotonic.
Within each bulk validation dataset, between-group expression differences were tested using two-sided Wilcoxon rank-sum tests, and BH correction was applied across the six genes. ROC curves were calculated with pROC (version 1.19.0.1), using direction selected automatically by the package. AUCs and corresponding 95% confidence intervals (CIs) were calculated to compare discriminatory patterns across datasets. Automatically selecting ROC direction from each assessment dataset may give optimistic discrimination; these single-gene AUCs are descriptive and do not validate a prespecified clinical prediction model.
Single-cell localization and sample-level analysis
Single-cell analysis used the saved Seurat object biofsci_SingleR_annotated_MMP1_analyzed.rds from GSE165816, containing 22,889 genes and 69,944 cells in the RNA assay. The RNA assay retained a non-negative integer counts layer and a data layer generated by LogNormalize with a scale factor of 10,000 followed by log1p transformation; the latter was not TPM. The object contained 2,000 variable genes selected using the vst method (loess.span = 0.3; 20 equal-width bins), scaled expression for all retained genes (centering and scaling enabled; scale.max = 10), and 50 principal components calculated from the variable features with seed 42. The saved command history used Harmony dimensions 1–20 for nearest-neighbor construction and uniform manifold approximation and projection (UMAP). Neighbor settings included k = 20, Annoy with 50 trees and Euclidean distance, and a shared nearest-neighbor (SNN) pruning threshold of 1/15. Clustering used resolution 0.8, algorithm 1, n.start = 10, n.iter = 10, and random.seed = 0. UMAP used the uwot implementation, 30 neighbors, two output dimensions, a cosine distance metric, min.dist = 0.3, spread = 1, learning.rate = 1, and seed 42. The object retained a Harmony reduction, but the original quality-control cutoffs, complete RunHarmony call including the batch covariates, and SingleR reference and annotation settings for this analyzed object could not be recovered. Cell-type labels, group labels, and sample identifiers were stored in SingleR_label, Group, and orig.ident, respectively. Ten annotated cell types were retained: B cells, CD8+ T cells, endothelial cells, epithelial cells, fibroblasts, hematopoietic stem cells, keratinocytes, macrophages, monocytes, and neurons.
MMP1 expression was summarized by cell type. Cells with normalized MMP1 expression greater than zero were classified as MMP1-positive. For sample-level analysis, mean normalized expression was calculated for each sample-cell-type combination. DFU and control samples were compared within each cell type using two-sided Wilcoxon rank-sum tests followed by BH correction across all tested cell types. The GEO sample accession, rather than the individual cell, was the unit used in these reported comparisons. The 24 accessions were not treated as proof of 24 independent donors. The saved object did not contain a verified donor identifier, and repeated tissue sampling within donors was not modeled; the sample-level tests are consequently interpreted as exploratory. These summaries average normalized expression within sample and cell type; they are not count-summed pseudobulk differential-expression models.
Ten functional gene sets were scored with Seurat AddModuleScore. Spearman correlations between per-cell MMP1 expression and module scores were calculated and BH-corrected. For exploratory MMP1-high analysis, the three cell types with the highest mean MMP1 expression among cell types containing at least 50 cells were selected. A global cutoff was defined as the median expression among MMP1-positive cells when more than 10 positive cells were available; the script otherwise used the overall 75th percentile. Cells above this cutoff were assigned to the MMP1-high group and the remaining cells to the MMP1-low group. FindMarkers used a Wilcoxon test, logfc.threshold = 0.25, and min.pct = 0.1. Upregulated genes with adjusted p < 0.05 were subjected to GO biological-process enrichment. Because the groups were defined by MMP1 expression, this analysis was used to describe pathways associated with the MMP1-high state. Per-cell correlations, their adjusted p values, and MMP1-high versus MMP1-low enrichment are descriptive because within-sample dependence was not modeled. Individual cells were not interpreted as independent biological replicates.
TCM ingredient-target-herb prediction
The six prioritized genes were matched to column 4 of the local Comparative Toxicogenomics Database (CTD) chemical-gene interaction table. Records were restricted to Homo sapiens in column 7. Ingredient names were trimmed and normalized to lowercase for matching, and duplicate ingredient-target and herb-ingredient mappings were removed. Ingredients were linked to herbs using the herb-ingredient reference table. Database enrichment used nominal p < 0.05 and adjusted p < 0.05. Duplicate herb-ingredient-target records were removed before coverage-based summarization. Herb enrichment used clusterProfiler::enricher with the herb-ingredient mapping as TERM2GENE, minGSSize = 1, maxGSSize = 500, pvalueCutoff = 1, and qvalueCutoff = 1 before applying the nominal and BH-adjusted significance thresholds. These database links may describe changes in expression or activity and do not establish direct binding or a uniform direction of effect.
Herbs were ranked using the following coverage score:
S = 3R + 5L +2T + 3C + 2I + N (1)
Here, R is the MMP1 record count, L is the number of MMP1-linked ingredients, T is the number of covered targets, C is the core-ingredient count, I is the matrix-axis indicator, and N is the total number of ingredients.
Core ingredients were quercetin, luteolin, and berberine. The matrix-axis indicator was set to 1 when an herb covered both MMP1 and MMP13 and to 0 otherwise. Candidate herbs were required to contain at least one MMP1-linked record and either at least two MMP1-linked ingredients or at least four targets plus one core ingredient. The score was used to summarize database coverage and was not treated as a pharmacologic efficacy measure. The coefficients define a custom, heuristic coverage rule that emphasizes MMP1-linked records and ingredients, broader target coverage, the three designated ingredients, and joint MMP1/MMP13 coverage. They were not fitted to clinical outcomes or experimentally validated, and alternative weights could change herb rankings.
Patient tissue collection and preliminary qPCR and western blot assessment
Patients with clinically diagnosed diabetic foot ulcers who underwent clinically indicated debridement or surgery at Wuhan Fourth Hospital were eligible when foot tissue was available and written informed consent had been obtained. Exclusion criteria were malignancy at the sampling site, a non-diabetic cause of the ulcer, or insufficient tissue quantity or quality for the planned assays. DFU tissue and non-ulcerated tissue surrounding the wound were obtained from the same patient under the approved study protocol. The latter served as a matched periwound comparator; it was not healthy non-diabetic skin. The qPCR assessment comprised four matched pairs (four DFU specimens and four corresponding periwound specimens), and western blotting comprised three matched pairs. Matching was confirmed by the authors for each assay; cross-assay identity was not used in the statistical comparisons. Each patient was the biological unit, and technical PCR wells were repeated measurements within a specimen. These preliminary assays were intended to assess tissue-level expression of MMP1 and were not designed to establish diagnostic performance, causality, or generalizability across DFU phenotypes.
For qPCR validation, total RNA was extracted from patient-derived tissue specimens using a total RNA extraction reagent according to the manufacturer's instructions. RNA concentration and purity were assessed spectrophotometrically, and samples with an A260/A280 ratio of 1.8–2.1 were used for subsequent analyses. Total RNA (1 µg) was reverse transcribed using a Moloney murine leukemia virus (M-MLV) reverse-transcription kit in a final reaction volume of 20 µL. The available instrument project identifies a real-time PCR system. Quantitative PCR was reported using 2x SYBR Green PCR master mix in a 20 µL reaction containing 10 µL of 2x SYBR Green master mix, 0.4 µL each of the forward and reverse primers, 2 µL of complementary DNA (cDNA), and 7.2 µL of nuclease-free water. The amplification program consisted of an initial denaturation at 95 °C for 30 s, followed by 40 cycles of 95 °C for 5 s and 60 °C for 30 s. A melting-curve analysis was performed to verify amplification specificity. MMP1 transcript abundance was measured with β-actin (ACTB) as the reference gene. Primer sequences are listed in Table 1. For the revised paired analysis, the five technical wells per target within each specimen were averaged before ΔCq calculation, and relative MMP1 expression was calculated using the 2-ΔΔCq method, with the non-ulcerated periwound tissue group used as the calibrator. The recovered sample pairs were NC–DFU, NC1–DFU1, NC2–DFU2, and NC3–DFU3, confirmed by the authors as four patient-matched pairs. The previous qPCR plot used five technical-well values from only NC and DFU; the revised plot shows one specimen-level value after averaging technical wells for each of the four pairs. Paired inference used ΔCq = mean Cq(MMP1) − mean Cq(ACTB), rather than well-level fold-change values. The archived instrument project also differs from the reported reaction volume and cycling program, and its correspondence to the plotted experiment remains unresolved.
For western blot (WB) validation, tissue specimens were homogenized in ice-cold radioimmunoprecipitation assay buffer supplemented with protease inhibitors. Lysates were incubated on ice for 30 min and centrifuged at 12,000 x g for 15 min at 4 °C. The supernatants were collected, and protein concentrations were determined using a bicinchoninic acid assay. Equal amounts of protein (20 µg per lane) were separated on 4%–20% gradient sodium dodecyl sulfate-polyacrylamide gels and transferred onto 0.22 µm polyvinylidene difluoride membranes. Membranes were blocked with 5% nonfat milk in Tris-buffered saline containing 0.1% Tween-20 for 1 h at room temperature and incubated overnight at 4 °C with an MMP1 polyclonal antibody (1:1,000) and a cofilin polyclonal antibody (1:6,000). After three washes with Tris-buffered saline containing 0.1% Tween-20, membranes were incubated with horseradish peroxidase-conjugated goat anti-rabbit immunoglobulin G (IgG) (1:5,000) for 1 h at room temperature. Protein bands were visualized using an enhanced chemiluminescent substrate and imaged with a chemiluminescence imaging system using the associated operating software (version 1.2.0), as recorded in the image metadata. Bands were quantified using ImageJ software. Cofilin was used as the loading control, and MMP1 protein abundance was normalized to cofilin for between-group comparison.
Statistical analysis and software
All tests were two-sided unless otherwise stated. BH-adjusted p < 0.05 was used as the primary multiple-testing threshold. Exact sample sizes varied by dataset and, for the single-cell sample-level analysis, by the presence of a given cell type in each sample. Continuous expression summaries are shown as individual observations with boxplots displaying the median and interquartile range; whiskers extend to 1.5 times the interquartile range. For western blotting, the six recovered MMP1-to-cofilin ratios were analyzed using a two-sided paired t-test on three author-confirmed patient pairs (df = 2; p = 0.0107). For qPCR, five ACTB and five MMP1 Cq values were averaged separately within each specimen before ΔCq calculation. A two-sided paired t-test compared DFU and matched periwound ΔCq values across four author-confirmed patient pairs (df = 3; p = 3.04 × 10⁻⁵). The mean periwound ΔCq was used as the common calibrator for the relative-expression display. The geometric mean within-patient fold change and its 95% CI were obtained by back-transforming the mean paired ΔCq difference and its t-based CI. Individual biological observations are shown with lines joining matched tissues; technical wells do not increase the biological sample size. Tissue-assay p values are nominal and exploratory. With three or four patients, normality of paired differences cannot be assessed reliably, and the assays remain preliminary. Bioinformatic analyses and figure generation were performed in R 4.5.2 on Windows 11. Core package versions included DESeq2 1.48.2, WGCNA 1.74, glmnet 5.0, randomForest 4.7-1.2, e1071 1.7-17, pROC 1.19.0.1, clusterProfiler 4.16.0, Seurat 5.5.0, SingleR 2.10.0, rentrez 1.2.4, and ggplot2 4.0.3. A consolidated software, database, and parameter inventory is provided in Supplementary Table 1.
Results
Discovery transcriptomics identifies a broad DFU-associated expression program
GSE199939 served as the discovery cohort and included 10 DFU and 11 control samples (Figure 1A). Principal component analysis of VST-normalized expression showed clear group separation; principal components 1 and 2 explained 34.8% and 15.1% of the total variance, respectively (Figure 1B).
Using |log2 fold change| > 1 and BH-adjusted p < 0.05, differential-expression analysis identified 3,691 DEGs, including 1,247 genes upregulated in DFU and 2,444 genes downregulated in DFU (Figure 1C). The top 50 DEGs formed a strongly group-structured expression pattern (Figure 1D). Among the six genes subsequently selected, MMP1 showed the largest discovery-cohort change (log2 fold change = 9.854; adjusted p = 1.24 × 10⁻²⁹).
A DFU-associated co-expression module converges with DEGs and DPN-related genes
WGCNA was performed on the 5,000 most variable VST-transformed genes. A soft-thresholding power of 18 was selected for the signed network, balancing scale-free topology fit and connectivity (Figure 2A). Hierarchical clustering and dynamic module detection identified multiple co-expression modules (Figure 2B). The blue module had the strongest positive association with DFU (Pearson r = 0.97, p = 5 × 10-13; Figure 2C). Corresponding sample-clustering and module-size quality-control summaries are provided in Supplementary Figure 1A,B.
Within the blue module, 689 genes met the hub criteria |MM| > 0.8 and |GS| > 0.5 (Figure 2D). Intersecting the 3,691 DEGs, 689 blue-module hub genes, and 1,062 DPN-related genes yielded 77 shared candidate genes (Figure 2E). A sparsified view of the blue-module hub network and the highest-ranked hub statistics are shown in Supplementary Figure 2A,B.
Multi-method feature selection prioritizes six genes but shows discovery-cohort overfitting
The 77 intersecting genes were analyzed by LASSO, random forest, and SVM-RFE. LASSO retained seven genes at the selected penalty: MMP1, MMP13, TRPV2, CCL7, AURKA, MKI67, and CHEK1 (Figure 3A). Random-forest filtering retained 41 genes with importance at or above the mean, including five members of the final panel among the most highly ranked features (Figure 3B). SVM-RFE produced an AUC of 1.00 for every evaluated nested subset; under the minimum-size tie rule, CHEK1 was selected as the one-gene subset (Figure 3C), raising concerns about overfitting and optimistic assessment in the discovery cohort. Corresponding discovery-cohort expression, heatmap, and ROC displays are shown in Supplementary Figure 3A–C.
No gene was selected by all three methods. Retaining genes supported by at least two methods yielded CCL7, CHEK1, MKI67, MMP1, MMP13, and TRPV2 (Figure 3D). GO annotation of these six genes highlighted extracellular-matrix disassembly, collagen catabolic and metabolic processes, condensed chromosome, and metalloendopeptidase-related functions (all BH-adjusted p < 0.05; Figure 3E). KEGG analysis identified interleukin-17 (IL-17) signaling (CCL7/MMP1/MMP13; adjusted p = 1.81 × 10⁻⁴) and relaxin signaling (MMP1/MMP13; adjusted p = 0.0175; Figure 3F). These enrichment results were used to characterize the biological functions represented by the six-gene panel.
Cross-dataset assessment shows heterogeneous support for MMP1
In the merged GSE68183/GSE80178 matrix (9 DFU and 6 controls), CCL7, MMP1, and MMP13 differed between groups after BH correction across the six genes (adjusted p = 0.0168, 0.0159, and 0.0431, respectively; Figure 4A). CHEK1, MKI67, and TRPV2 did not reach the adjusted significance threshold (adjusted p = 0.259, 0.680, and 0.259). Single-gene ROC analysis produced AUCs of 0.944 for CCL7 (95% CI, 0.825–1.000), 0.704 for CHEK1 (0.403–1.000), 0.574 for MKI67 (0.243–0.905), 0.981 for MMP1 (0.930–1.000), 0.870 for MMP13 (0.686–1.000), and 0.722 for TRPV2 (0.447–0.997; Figure 4B). These ROC values were considered exploratory because the upstream merging and batch-correction procedure was not fully documented.
In GSE134431 (13 DFU and 8 non-ulcerated DFS samples), MMP1 expression was higher in DFU than in DFS on Wilcoxon testing at the nominal significance level (p = 0.0225), although this association did not remain significant after BH correction (adjusted p = 0.135; Figure 4C). The other five genes showed no significant between-group differences. MMP1 also showed the highest descriptive AUC, with an AUC of 0.808 (95% CI, 0.589–1.000), whereas the AUCs of the other candidates ranged from 0.529 to 0.635 (Figure 4D). Overall, MMP1 showed the most consistent descriptive pattern among the six candidates, but statistical replication was incomplete.
Single-cell analysis localizes MMP1 predominantly to fibroblasts
The single-cell dataset contained 69,944 cells from 24 samples (14 DFU and 10 controls) and comprised 10 annotated cell types (Figure 5A). UMAP feature visualization localized MMP1 expression to restricted cellular regions rather than showing uniform expression across the atlas (Figure 5B). Overall, 3,799 cells (5.43%) had normalized MMP1 expression greater than zero. Fibroblasts had the highest mean normalized expression (0.181) and the largest overall MMP1-positive fraction (7.88%; Figure 5C).
At the sample level, mean MMP1 expression was higher in DFU samples than in control samples in keratinocytes, fibroblasts, and endothelial cells. After BH correction across all tested cell types, each of these comparisons had an adjusted p of 0.0214 (keratinocytes: 9 control and 14 DFU samples; fibroblasts: 10 and 14; endothelial cells: 10 and 14; Figure 5D). The MMP1-positive fraction increased from 5.86% to 9.29% in fibroblasts, from 0.026% to 6.68% in keratinocytes, and from 0.29% to 2.67% in endothelial cells (Figure 5E).
Per-cell module-score correlations were modest. The largest positive correlation was observed for the senescence/senescence-associated secretory phenotype (SASP) module score (Spearman rho = 0.274), followed by extracellular-matrix remodeling (rho = 0.240), ferroptosis (rho = 0.197), and fibroblast activation (rho = 0.170; Figure 5F). Comparison of MMP1-high and MMP1-low fibroblasts showed enrichment for extracellular-matrix organization, extracellular-structure organization, collagen fibril organization, glycoprotein processing, and protein-folding terms (Figure 5G). These descriptive findings linked the MMP1-high fibroblast state to matrix-remodeling-related processes. Additional group-level UMAP, all-cell-type sample summaries, and functional-score context are provided in Supplementary Figure 4A–C. Individual-cell associations were not treated as donor-independent evidence.
Network coverage prioritizes MMP1-linked ingredients and candidate herbs
The filtered herb-ingredient-target relation table contained 561 unique records linking 99 herbs, 14 ingredients, and five of the six candidate targets. MMP1 was the most frequent target, with 156 records, followed by CHEK1 (120), MMP13 (102), MKI67 (100), and TRPV2 (83; Figure 6A). Among ingredients, quercetin and luteolin had the widest herb coverage and were linked to 83 and 62 herbs, respectively. Berberine was linked to 10 herbs; these three ingredients were used as core ingredients in the prioritization rule (Figure 6B).
The coverage score ranked Guanhuangbo, Mahuang, and Niuxi jointly highest (score = 38 each; Figure 6C). Each covered all five available targets and contained two MMP1-linked ingredients. The ingredient-target matrix showed that quercetin provided the broadest coverage across the target panel, whereas luteolin and berberine supplied additional MMP1-centered connectivity (Figure 6D). A focused network linked the leading herbs to representative ingredients and the five available targets (Figure 6E). These results identified herb-ingredient-target combinations with high database coverage for further evaluation. Supporting herb-target and core-ingredient coverage matrices are shown in Supplementary Figure 5A,B.
Preliminary paired tissue assays show higher MMP1 mRNA and protein abundance
Western blot assessment showed higher MMP1 abundance in DFU specimens than in their matched non-ulcerated periwound specimens (Figure 7A,B). The three matched pairs had a mean DFU-minus-periwound difference in MMP1/cofilin ratio of 0.3553 (95% CI, 0.1959–0.5147; two-sided paired t-test, t(2) = 9.592, p = 0.0107). Each patient's paired measurements are displayed in Figure 7B. After averaging five technical wells per gene per specimen, qPCR showed higher normalized MMP1 mRNA abundance in each of the four DFU specimens than in its matched periwound specimen (Figure 7C). The mean within-patient DFU-minus-periwound ΔCq difference was −2.6035 (95% CI, −2.8024 to −2.4046; two-sided paired t-test, t(3) = −41.663, p = 3.04 × 10⁻⁵), corresponding to a geometric mean 6.08-fold increase (95% CI, 5.30–6.98). These small-sample observations are preliminary and do not establish a functional effect.
Across the discovery and external bulk datasets, MMP1 had the most consistent descriptive pattern among the six prioritized genes, although statistical replication was incomplete. Single-cell summaries showed the highest mean expression in fibroblasts, and paired WB measurements from three patients and paired qPCR measurements from four patients showed higher MMP1 abundance. These observations support MMP1 as a DFU-associated candidate for further investigation. The overall computational-to-tissue assessment workflow is summarized in Supplementary Figure 6.
DATA AVAILABILITY:
The public transcriptomic datasets are available from the NCBI Gene Expression Omnibus under accession numbers GSE199939, GSE68183, GSE80178, GSE134431, and GSE165816. Available analysis and figure-generation scripts, processed expression and result tables, quantitative figure source tables, statistical output tables, the original qPCR workbook and instrument project, and supplied uncropped western blot images are included in Supplementary File 1. The archive also contains extracted cell metadata and command history from the recovered single-cell object, matrix-type verification reports, and a file manifest. Supplementary File 1 retains historical source files and includes an R2_Updates folder containing the revised paired-assay source tables, statistical outputs, figure-generation code, and corrected parameter inventory. The full analyzed Seurat RDS is identified in the archive documentation but is not embedded in this supplementary ZIP. The complete bulk-merging history, original single-cell filtering and annotation settings, and original blot background-subtraction and lane-to-quantification details are not fully available; these limitations are described in the protocol and discussion. The locally recovered RDS has not been deposited in a public repository.
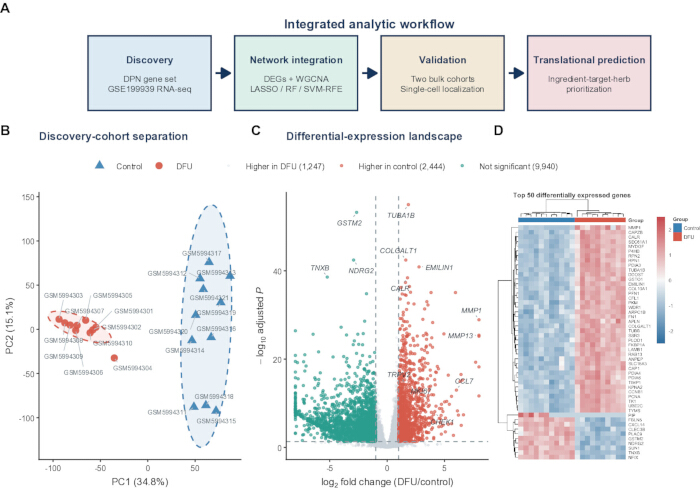
Figure 1: Discovery transcriptomics identifies a DFU-associated expression program. (A) Overview of the computational workflow, comprising DPN gene-set construction and GSE199939 discovery analysis, network and machine-learning integration, bulk and single-cell assessment, and TCM ingredient-target-herb prediction. (B) Principal component analysis of variance-stabilized GSE199939 expression profiles from 10 DFU and 11 control samples. Ellipses indicate 90% group regions; percentages denote the variance explained by each component. (C) Volcano plot of DESeq2 differential-expression results for DFU versus control. Red and teal points denote genes upregulated in DFU and control, respectively, using |log2 fold change| > 1 and BH-adjusted p < 0.05; gray points did not meet both thresholds. (D) Row-wise z-score heatmap of the 50 genes with the smallest adjusted p values. Columns are biological samples and the annotation bar denotes group. DEGs, differentially expressed genes; DFU, diabetic foot ulcer; DPN, diabetic peripheral neuropathy; VST, variance-stabilizing transformation. The final experimental assessment is described in the protocol and Figure 7. qPCR, quantitative polymerase chain reaction; TCM, traditional Chinese medicine; RF, random forest; LASSO, least absolute shrinkage and selection operator; SVM-RFE, support vector machine recursive feature elimination. Please click here to view a larger version of this figure.
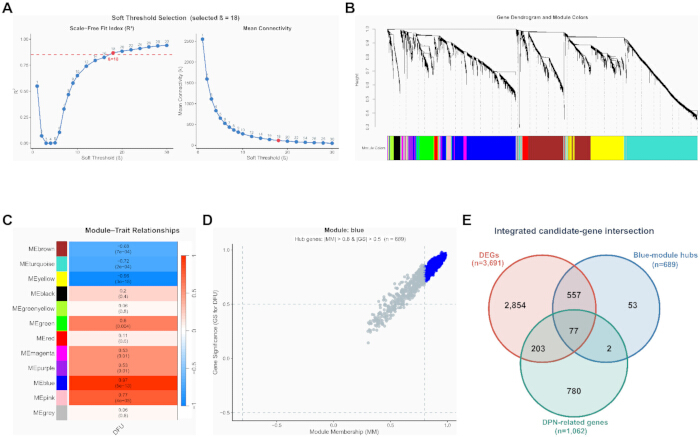
Figure 2: WGCNA and prior DPN knowledge converge on 77 candidate genes. (A) Signed-network soft-threshold assessment for the 5,000 most variable VST-transformed genes. The selected power was beta = 18; the dashed line marks the target scale-free topology fit of 0.85. (B) Average-linkage gene dendrogram with dynamic module color assignments. (C) Pearson correlations between module eigengenes and the binary DFU trait. Each cell shows the correlation coefficient and corresponding two-sided p value; color indicates direction and magnitude. (D) Gene significance for DFU versus module membership in the blue module. Blue points satisfy |module membership| > 0.8 and |gene significance| > 0.5; n = 689 hub genes. (E) Three-set intersection of 3,691 DEGs, 689 blue-module hub genes, and 1,062 DPN-related genes, yielding 77 shared candidates. DFU, diabetic foot ulcer; DPN, diabetic peripheral neuropathy; GS, gene significance; MM, module membership; WGCNA, weighted gene co-expression network analysis. The discovery cohort contained 21 samples (10 DFU and 11 controls). The Figure 2D annotation uses |MM| > 0.8 and |GS| > 0.5, matching the absolute-value criterion verified in the original selection code. Please click here to view a larger version of this figure.
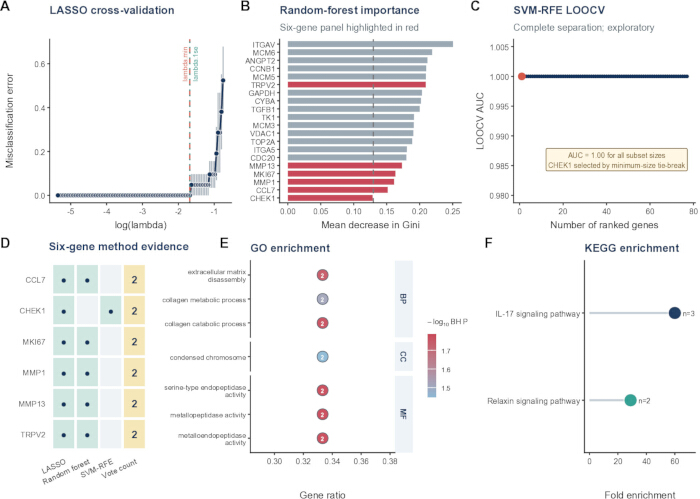
Figure 3: Multi-method feature prioritization yields a six-gene panel. (A) Five-fold cross-validation curve for binomial LASSO regression. Vertical dashed lines denote lambda.min and lambda.1se; the selected non-zero features were taken at lambda.1se unless that penalty yielded no feature. (B) Random-forest mean decrease in Gini for the 20 highest-ranked genes from a 1,000-tree model. Red bars identify members of the final six-gene panel; the dashed line marks the mean importance used as the retention threshold across the full candidate set. (C) Linear SVM-RFE LOOCV AUC across nested feature subsets. All subset sizes produced AUC = 1.00; CHEK1 was selected by the minimum-size tie rule, indicating overfitting in the discovery cohort. (D) Method-support matrix for CCL7, CHEK1, MKI67, MMP1, MMP13, and TRPV2. Dots denote selection by LASSO, random forest, or SVM-RFE; the last column gives the number of supporting methods. (E) Selected Gene Ontology terms enriched among the six genes. Point position shows gene ratio, point labels show the number of mapped genes, color shows -log10 BH-adjusted p, and the side strip denotes ontology. (F) KEGG pathways enriched among mapped genes. Point position shows fold enrichment, point size labels show mapped-gene count, and color distinguishes pathways. Enrichment required nominal p < 0.05 and BH-adjusted p < 0.05. AUC, area under the receiver operating characteristic curve; BH, Benjamini-Hochberg; BP, biological process; CC, cellular component; KEGG, Kyoto Encyclopedia of Genes and Genomes; LOOCV, leave-one-out cross-validation; MF, molecular function; SVM-RFE, support-vector-machine recursive feature elimination. LASSO, least absolute shrinkage and selection operator. Panels A–D use the 21 discovery samples (10 DFU and 11 controls). In panel A, error bars denote the standard error of the cross-validation error. Please click here to view a larger version of this figure.
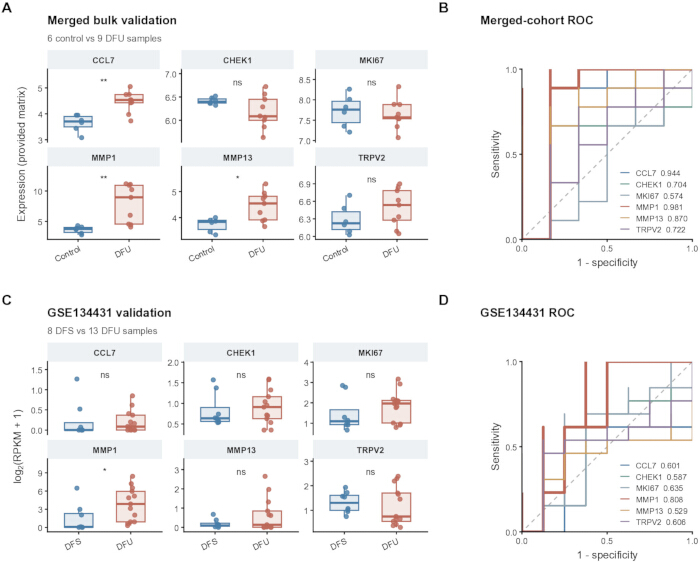
Figure 4: Cross-dataset bulk-transcriptomic assessment of the six-gene panel. (A) Expression of the six genes in the merged GSE68183/GSE80178 matrix (6 controls and 9 DFU samples). (B) Corresponding single-gene ROC curves with AUC values; 95% confidence intervals are provided in the source-data table. Because upstream merging and batch correction were not fully documented, these results were interpreted as exploratory. (C) log2(RPKM + 1) expression in GSE134431 (8 non-ulcerated DFS and 13 DFU samples). (D) Corresponding single-gene ROC curves and AUC values. In (A) and (C), boxes show the median and interquartile range, whiskers extend to 1.5 times the interquartile range, and points represent biological samples. Asterisks indicate nominal significance from two-sided Wilcoxon rank-sum tests (*p < 0.05, **p < 0.01); BH-adjusted p values across the six genes are reported in the text and source-data table. ROC direction was selected automatically by pROC. AUC, area under the receiver operating characteristic curve; DFS, non-ulcerated diabetic foot skin; DFU, diabetic foot ulcer; RPKM, reads per kilobase per million mapped reads; ROC, receiver operating characteristic. Please click here to view a larger version of this figure.
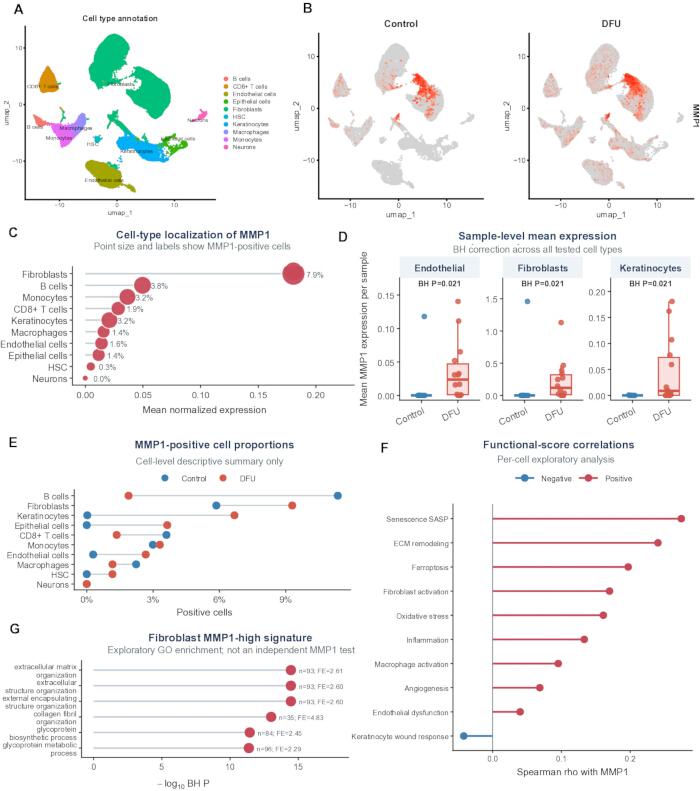
Figure 5: Single-cell localization links MMP1 to fibroblast- and matrix-remodeling signals. (A) UMAP of 69,944 cells from 24 samples (10 controls and 14 DFU samples), colored by the 10 SingleR-derived cell-type annotations. (B) UMAP feature plots showing normalized MMP1 expression in control and DFU cells. (C) Cell-type summary of mean normalized MMP1 expression; point size and labels denote the overall MMP1-positive fraction, defined as normalized expression > 0. (D) Sample-level mean MMP1 expression in endothelial cells, fibroblasts, and keratinocytes. Boxes show the median and interquartile range; points are biological samples. Two-sided Wilcoxon rank-sum tests were followed by BH correction across all tested cell types. Available sample counts were 10 controls and 14 DFU for endothelial cells and fibroblasts, and 9 controls and 14 DFU for keratinocytes. (E) MMP1-positive cell fractions by group and cell type. (F) Per-cell Spearman correlations between MMP1 expression and functional module scores. (G) GO biological-process enrichment among genes upregulated in MMP1-high versus MMP1-low fibroblasts. BH, Benjamini-Hochberg; DFU, diabetic foot ulcer; ECM, extracellular matrix; GO, Gene Ontology; HSC, hematopoietic stem cells; UMAP, uniform manifold approximation and projection. Per-cell correlations and expression-conditioned enrichment in panels F and G are exploratory descriptions, without donor-aware confirmatory inference. Sample-level independence requires verification of donor identifiers. Please click here to view a larger version of this figure.
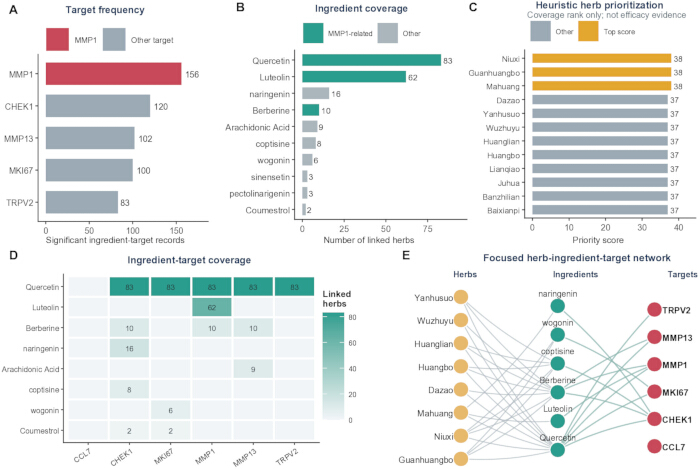
Figure 6: Coverage-based TCM ingredient-target-herb prediction centered on MMP1. (A) Number of filtered database herb-ingredient-target records for each available candidate target. (B) Number of linked herbs for the most frequent ingredients; teal denotes ingredients linked to MMP1. (C) Leading herbs ranked by the coverage score; gold bars mark the three joint-highest scores. (D) Ingredient-target matrix for representative high-coverage ingredients. Cell values show the number of linked herbs; empty cells indicate no record in the filtered relation table. (E) Focused network connecting representative high-ranked herbs, ingredients, and candidate targets. Node color denotes entity type; gray herb-ingredient edges denote containment and teal ingredient-target edges denote database links. The filtered relation table contained 561 unique records, 99 herbs, 14 ingredients, and five targets with qualifying links; CCL7 is displayed as an isolated sixth candidate node. TCM, traditional Chinese medicine. Please click here to view a larger version of this figure.
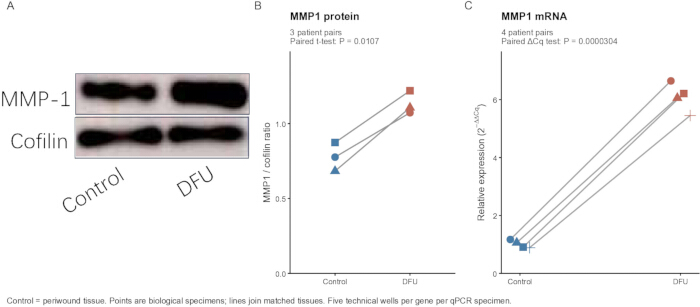
Figure 7: Preliminary patient tissue qPCR and western blot assessment of MMP1 expression in DFU. (A) Previously supplied representative western blot showing MMP1 protein abundance in non-ulcerated periwound and DFU tissue, with cofilin as the loading control. (B) MMP1-to-cofilin ratios recovered from the original plotting project. Symbols show individual biological measurements from three patient pairs; lines join matched periwound and DFU specimens. The two-sided paired t-test gave t(2) = 9.592 and p = 0.0107. (C) Relative MMP1 mRNA abundance in four author-confirmed matched patient pairs: NC–DFU, NC1–DFU1, NC2–DFU2, and NC3–DFU3. Five technical ACTB wells and five technical MMP1 wells were averaged separately within each specimen before ΔCq calculation. Relative expression was calculated by the 2−ΔΔCq method using the mean periwound ΔCq as a common calibrator. Each symbol represents one biological specimen; lines connect matched tissues. The two-sided paired t-test used specimen-level ΔCq values (t(3) = −41.663; p = 3.04 × 10⁻⁵), not technical-well fold changes. No significance stars are used. Technical wells are not biological replicates. Control denotes non-ulcerated periwound tissue. Cq, quantification cycle. Tissue-assay p values are nominal and exploratory. Please click here to view a larger version of this figure.
| Gene | RefSeq accession | Forward primer 5 prime to 3 prime | Reverse primer 5 prime to 3 prime |
| MMP1 | NM_002421 | ATGAAGCAGCCCAGATGTGGAG | TGGTCCACATCTGCTCTTGGCA |
| ACTB | NM_001101.5 | CACCATTGGCAATGAGCGGTTC | AGGTCTTTGCGGATGTCCACGT |
Table 1: Primer sequences for quantitative PCR validation of MMP1. Forward and reverse oligonucleotide sequences (5′–3′) and NCBI RefSeq transcript accessions are given for human MMP1 (NM_002421) and ACTB (NM_001101.5). ACTB (β-actin) was used as the reference gene for relative MMP1 expression.
Supplementary Figure 1: WGCNA quality-control summaries. (A) Average-linkage hierarchical clustering of GSE199939 samples based on the 5,000 most variable variance-stabilized genes. Sample labels are colored by group; the dashed horizontal line is the 95th-percentile dendrogram-height guide used for visual outlier assessment. (B) Number of genes assigned to each WGCNA module. Teal bars denote the eight non-gray modules meeting the DFU-association criterion; gray bars denote other modules. DFU, diabetic foot ulcer; VST, variance-stabilizing transformation; WGCNA, weighted gene co-expression network analysis. Please click here to download this file.
Supplementary Figure 2: Blue-module co-expression support. (A) Simplified co-expression network of the 25 highest-ranked blue-module hub genes. Among pairwise correlations with |r| > 0.70, the displayed network contains the union of each gene's two strongest links. Node size denotes degree within this displayed, sparsified network, and node fill denotes gene significance for DFU. (B) Gene significance and blue-module membership for the 15 highest-ranked hubs. The edge subset was selected for readability and does not represent all qualifying correlations. DFU, diabetic foot ulcer; GS, gene significance; MM, module membership. Please click here to download this file.
Supplementary Figure 3: Internal discovery-cohort machine-learning displays. (A) Scaled expression of CCL7, CHEK1, MKI67, MMP1, MMP13, and TRPV2 in the GSE199939 discovery cohort. Boxes show the median and interquartile range, and points represent biological samples. (B) Sample-level row-z-score heatmap of the same six genes. Short sample labels are mapped to GEO identifiers in the source-data key. (C) ROC curve of the fitted multigene discovery-cohort model. The AUC of 1.00 was obtained by fitting and assessing the model on the same 21 samples, indicating overfitting in the discovery cohort. AUC, area under the receiver operating characteristic curve; ROC, receiver operating characteristic. The discovery cohort contained 21 samples (10 DFU and 11 controls). Please click here to download this file.
Supplementary Figure 4: Single-cell expression context. (A) UMAP of 69,944 cells colored by control and DFU group. (B) Biological-sample-level mean MMP1 expression across all 10 cell-type annotations; points represent samples, and the x-axis uses a square-root transformation for display. (C) Heatmap of functional module scores summarized across cells within each annotated cell type and standardized within each module. DFU, diabetic foot ulcer; UMAP, uniform manifold approximation and projection. Please click here to download this file.
Supplementary Figure 5: Supporting TCM coverage matrices. (A) Database herb-target record counts for the 18 highest-ranked herbs with MMP1-linked coverage and the five candidate targets represented in the filtered relation table. (B) Database record counts linking the same herbs with the core ingredients quercetin, luteolin, and berberine. Cell values denote unique database records after deduplication. TCM, traditional Chinese medicine. Please click here to download this file.
Supplementary Figure 6: Computational and tissue assessment workflow. The schematic summarizes the discovery input, DEG/WGCNA intersection, exploratory feature selection, external bulk assessment, single-cell context, TCM extension, and matched tissue-expression assessment. qPCR used four matched patient pairs and western blotting used three matched patient pairs. Candidate counts and reported computational results are retained from the original analysis. TPM input in the count-based discovery workflow, incomplete original single-cell preprocessing records, and small tissue-assay cohorts remain limitations. The schematic does not imply that the discovery analyses have been revalidated. Please click here to download this file.
Supplementary Table 1: Analysis software, database, parameter, and limitation inventory. This workbook documents 26 analysis steps, with the analysis step, tool or database, reported version, input, major parameters, output, and missing information or limitations. It covers discovery transcriptomics, WGCNA, gene screening and feature selection, enrichment, external bulk and single-cell analyses, TCM network analysis, and tissue-assay reporting. The table records the available methodological information and does not itself establish independent reproducibility. Please click here to download this file.
Supplementary File 1: Data, analysis code, figure-source, and assay-source archive. This archive contains available analysis and figure-generation scripts, processed expression and result tables, quantitative figures and statistical source data, the original qPCR workbook and instrument project, supplied uncropped western blot images, extracted single-cell metadata and command history, matrix-type verification reports, and a file manifest. Historical files are preserved; the R2_Updates folder provides the corrected paired-assay analysis, updated figure sources, and revised parameter inventory. Please click here to download this file.
Discussion
This integrative workflow prioritized MMP1 from bulk transcriptomics, WGCNA, DPN-related gene screening, and exploratory feature selection, then examined its cellular context and tissue expression. Six genes were supported by at least two selection methods, and MMP1 showed the largest discovery-cohort expression change. External evidence was heterogeneous: MMP1 remained significant in the merged GSE68183/GSE80178 matrix, whereas its association in GSE134431 was nominal (p = 0.0225) and did not survive BH correction (adjusted p = 0.135). The AUC of 0.808 in GSE134431 is descriptive, particularly because ROC direction was selected within the assessment dataset. Accordingly, “most consistent” describes the observed pattern among the six candidates and does not imply complete statistical replication or a validated diagnostic biomarker.
The candidate panel was annotated to collagen turnover, ECM disassembly, metalloendopeptidase activity, and IL-17 and relaxin signaling. These annotations are compatible with chronic wound biology but involve only a few genes. Earlier human studies reported altered MMP and inhibitor profiles in diabetic wounds6, while a prospective DFU study associated a higher MMP1-to-tissue inhibitor of metalloproteinases 1 (TIMP1) ratio with healing7. Thus, increased MMP1 expression need not indicate a uniformly harmful effect; its relevance may depend on repair stage, substrate availability, and inhibitor balance. Experimental observations concerning MMP13, CCL7, and IL-17 provide additional context11,12,13,14, but their functions cannot be assumed to be equivalent in human DFU.
Single-cell summaries localized the highest mean MMP1 expression to fibroblasts, with higher sample-level expression in DFU fibroblasts, keratinocytes, and endothelial cells. This pattern agrees with reports of altered ECM organization in DFU-derived fibroblasts4, heterogeneous fibroblast states in single-cell and spatial studies8, and macrophage-associated healing fibroblast programs15. However, sample identifiers require donor-level verification, and cell-level module-score correlations and expression-conditioned enrichment remain descriptive because within-donor dependence was not modeled. Contributions from epithelial and endothelial populations also argue against an exclusively fibroblast-autonomous mechanism. Spatial transcriptomics, RNA in situ hybridization, or immunostaining would offer complementary localization16.
The methodological value lies in combining differential expression, co-expression, prior gene knowledge, cell-resolved summaries, and independent assay modalities to prioritize candidates. It does not lie in discovery-cohort predictive accuracy. Cohort-wide screening preceded algorithm-level cross-validation, and the uniform SVM-RFE AUC of 1.00 raises concerns about leakage, overfitting, and optimistic assessment. The panel should therefore remain a feature-prioritization result. Fully nested preprocessing, selection, and tuning, followed by a locked independent test, would be needed for predictive evaluation9,10. The discovery input was verified as TPM despite its use in a count-based model; the resulting discovery statistics and downstream selection therefore remain unverified pending appropriate reanalysis. The merged bulk matrix lacks its complete preprocessing history. The recovered Seurat object supplies normalization, variable-feature selection, PCA, neighbor, clustering, and UMAP settings, although its original filtering, complete Harmony call, and annotation reference remain incompletely documented. Harmonized reprocessing from source data, documented batch-effect assessment, and donor-aware pseudobulk or mixed-model analyses are alternative approaches for further evaluation.
Patient-tissue assays provide preliminary orthogonal evidence of higher MMP1 abundance. The comparator was non-ulcerated periwound tissue from the same patients, so the contrast reflects ulcer-associated local differences within diabetic tissue rather than a comparison with healthy skin. Recovered WB measurements from three matched patient pairs and qPCR measurements from four author-confirmed matched pairs were analyzed using paired tests, with individual biological observations displayed. For qPCR, technical wells were averaged within each specimen and inference used ΔCq; technical wells did not enlarge the biological sample size. The consistent direction of the paired observations supports a preliminary expression comparison, but the small cohorts cannot establish generalizability or reliably assess distributional assumptions. Bulk-tissue abundance does not establish cellular protein localization, enzymatic activity, or a causal effect on healing. Larger clinically characterized cohorts are needed. Other limitations include incomplete clinical covariates, distinct comparator tissues, an incompletely documented literature-derived DPN gene set, and incomplete original blot background-subtraction records. Healthy tissue, study-defined control tissue, and non-ulcerated diabetic foot skin should not be treated as interchangeable.
The TCM network is a hypothesis-generating extension. Its custom weights summarize database coverage rather than target engagement or efficacy, and rankings may change with database content and weight choices. Quercetin and berberine also have variable or limited systemic exposure17,18. Candidate ingredients and herbs therefore require direct target, dose-response, pharmacokinetic, toxicity, and functional testing. Future work should combine well-documented independent cohorts with spatial localization and MMP1 perturbation in primary fibroblasts or multicellular wound models. The present findings support MMP1 as a DFU-associated candidate in a fibroblast-centered matrix-remodeling context, without establishing causation or clinical utility.
Disclosures
The authors declare no conflicts of interest.
Acknowledgements
This research was supported by the Wuhan Municipal Medical Scientific Research Project (Guidance Project, Grant No. WX23Z77), administered by the Wuhan Municipal Health Commission.
The authors thank the participants who provided tissue specimens for this study and the investigators who generated and deposited the publicly available datasets in the NCBI Gene Expression Omnibus.
Materials
| Name | Company | Catalog Number | Comments |
|---|---|---|---|
| 0.2-mL thin-wall clear PCR 8-tube strips | Axygen / Corning | PCR-0208-C | URL: https://ecatalog.corning.com/life-sciences/b2b/TW/en/Genomics-%26-Molecular-Biology/PCR-Consumables/PCR-Tubes-and-Strip-Tubes/Axygen%C2%AE-PCR-Strip-Tubes/p/PCR-0208-C |
| 1,000-μL sterile filter pipette tips | Axygen / Corning | TF-1000-R-S | URL: https://ecatalog.corning.com/life-sciences/b2b/SEA/en/Liquid-Handling/Pipette-Tips-and-Accessories/Pipette-Tips/Axygen%C2%AE-Universal-Fit-Filter-Pipette-Tips/p/TF-1000-R-S |
| 1.5-mL sterile microcentrifuge tubes, DNase/RNase-free | Solarbio Life Sciences | YA0430 | URL: https://www.solarbio.com/goodsInfo?id=305429 |
| 10-μL sterile filter pipette tips | Axygen / Corning | TF-300-L-R-S | URL: https://ecatalog.corning.com/life-sciences/b2b/CALAOther/en/Liquid-Handling/Pipette-Tips-and-Accessories/Pipette-Tips/Axygen%C2%AE-Aerosol-Barrier-Tips/p/TF-300-L-R-S |
| 2× SYBR Green PCR Mastermix | Solarbio Life Sciences | SR1110 | URL: https://www.solarbio.com/goodsInfo?id=994 |
| 20× Tris-buffered saline | Solarbio Life Sciences | T1080 | URL: https://www.solarbio.com/goodsInfo?id=1309 |
| 200-μL sterile filter pipette tips | Axygen / Corning | TF-200-R-S | URL: https://ecatalog.corning.com/life-sciences/b2b/CALAOther/en/Liquid-Handling/Pipette-Tips-and-Accessories/Pipette-Tips/Axygen%C2%AE-Universal-Fit-Filter-Pipette-Tips/p/TF-200-R-S |
| ACTB qPCR primer pair | Solarbio Life Sciences (custom oligonucleotide synthesis) | Custom | RefSeq NM_001101.5; F: CACCATTGGCAATGAGCGGTTC; R: AGGTCTTTGCGGATGTCCACGT; URL: https://www.solarbio.com/ |
| Amersham Imager 600 | GE Healthcare Bio-Sciences AB, Uppsala, Sweden | Amersham Imager 600 | Model recorded in all 22 supplied TIFFs; operation software Ver.1.2.0; URL: https://cdn.cytivalifesciences.com/api/public/content/digi-17089-original |
| Bicinchoninic acid protein assay kit | Solarbio Life Sciences | PC0020 | URL: https://www.solarbio.com/goodsInfo?id=64504 |
| clusterProfiler | Bioconductor | https://bioconductor.org/packages/clusterProfiler/ | Version 4.16.0 |
| Cofilin polyclonal antibody (rabbit anti-Cofilin) | Proteintech Group (Wuhan Sanying Biotechnology Co., Ltd., Wuhan, China) | 10960-1-AP | WB dilution used in this study: 1:6,000; URL: https://www.ptgcn.com/; RRID:AB_2291830 |
| Comparative Toxicogenomics Database | CTD | https://ctdbase.org/ | Ingredient-target resource |
| DESeq2 | Bioconductor | https://bioconductor.org/packages/DESeq2/ | Version 1.48.2 |
| DNase/RNase-Free Water | Solarbio Life Sciences | R1600 | URL: https://www.solarbio.com/goods.php?id=1085 |
| e1071 | CRAN / e1071 authors | https://cran.r-project.org/package=e1071 | Version 1.7-17 |
| ECL Plus chemiluminescent substrate | Solarbio Life Sciences | PE0010 | URL: https://www.solarbio.com/pdf/2-DBYMY/1-ZW/PE0010.pdf |
| Gene Expression Omnibus: GSE134431 | National Center for Biotechnology Information | GSE134431 | URL: https://www.ncbi.nlm.nih.gov/geo/query/acc.cgi?acc=GSE134431 |
| Gene Expression Omnibus: GSE165816 | National Center for Biotechnology Information | GSE165816 | URL: https://www.ncbi.nlm.nih.gov/geo/query/acc.cgi?acc=GSE165816 |
| Gene Expression Omnibus: GSE199939 | National Center for Biotechnology Information | GSE199939 | URL: https://www.ncbi.nlm.nih.gov/geo/query/acc.cgi?acc=GSE199939 |
| Gene Expression Omnibus: GSE68183 | National Center for Biotechnology Information | GSE68183 | URL: https://www.ncbi.nlm.nih.gov/geo/query/acc.cgi?acc=GSE68183 |
| Gene Expression Omnibus: GSE80178 | National Center for Biotechnology Information | GSE80178 | URL: https://www.ncbi.nlm.nih.gov/geo/query/acc.cgi?acc=GSE80178 |
| Gene Ontology | Gene Ontology Consortium | https://geneontology.org/ | GO |
| ggplot2 | ggplot2 developers | https://ggplot2.tidyverse.org/ | Version 4.0.3 |
| glmnet | CRAN / glmnet authors | https://cran.r-project.org/package=glmnet | Version 5.0 |
| Herb-ingredient reference table | Source not reported in manuscript | Not reported | Not documented: exact database/file name, version/date, and public access URL |
| HRP-conjugated goat anti-rabbit IgG (H+L) | Proteintech Group (Wuhan Sanying Biotechnology Co., Ltd., Wuhan, China) | SA00001-2 | WB dilution used in this study: 1:5,000; URL: https://www.ptgcn.com/products/HRP-conjugated-Goat-Anti-Rabbit-IgG-H-L-SA00001-2.htm; RRID:AB_2722564 |
| Human diabetic foot ulcer tissue specimens | Wuhan Fourth Hospital, Wuhan, China | N/A | Patient-matched DFU specimens; qPCR n=4 specimens; WB n=3 specimens; approved protocol KY2024-161-01 |
| Human non-ulcerated periwound tissue specimens | Wuhan Fourth Hospital, Wuhan, China | N/A | Patient-matched periwound comparator; qPCR n=4 specimens; WB n=3 specimens; approved protocol KY2024-161-01 |
| ImageJ | National Institutes of Health | https://imagej.net/ij/ | Version not documented |
| Kyoto Encyclopedia of Genes and Genomes | KEGG | https://www.genome.jp/kegg/ | Human organism code hsa |
| Literature-curated DPN gene list | Literature-derived component; gene-level source table not fully documented | Not reported | Gene-level provenance not fully documented |
| Microvolume UV-visible spectrophotometer | Manufacturer/model not reported in manuscript | Not reported | Not documented: exact manufacturer, model, and product URL; reported use: RNA concentration and A260/A280 assessment |
| MMP1 polyclonal antibody (rabbit anti-MMP1) | Proteintech Group (Wuhan Sanying Biotechnology Co., Ltd., Wuhan, China) | 10371-2-AP | WB dilution used in this study: 1:1,000; URL: https://www.ptgcn.com/Products/MMP1-Antibody-10371-2-AP.htm; RRID:AB_2297741 |
| MMP1 qPCR primer pair | Solarbio Life Sciences (custom oligonucleotide synthesis) | Custom | RefSeq NM_002421; F: ATGAAGCAGCCCAGATGTGGAG; R: TGGTCCACATCTGCTCTTGGCA; URL: https://www.solarbio.com/ |
| NCBI Gene | National Center for Biotechnology Information | https://www.ncbi.nlm.nih.gov/gene/ | Human Gene database |
| Non-fat dry milk, blocking reagent | Solarbio Life Sciences | D8340 | URL: https://www.solarbio.com/goodsInfo?id=1488 |
| org.Hs.eg.db | Bioconductor | https://bioconductor.org/packages/org.Hs.eg.db/ | Version 3.21.0 |
| Precast SDS-PAGE gel, 4%–20% gradient | Solarbio Life Sciences | PG42010-S | URL: https://www.solarbio.com/goodsInfo?id=12646 |
| pROC | CRAN / pROC authors | https://cran.r-project.org/package=pROC | Version 1.19.0.1 |
| Protease inhibitor mixture, 100× | Solarbio Life Sciences | P6730 | URL: https://www.solarbio.com/goodsInfo?id=25748 |
| Protein-transfer system | Manufacturer/model not reported in manuscript | Not reported | Not documented: exact manufacturer, model, and product URL; reported use: Transfer to 0.22-μm PVDF membrane |
| PVDF membrane, 0.22 μm | Solarbio Life Sciences | YA1690 | URL: https://www.solarbio.com/goodsInfo?id=228106 |
| R | R Foundation for Statistical Computing | https://www.r-project.org/ | Version 4.5.2 |
| randomForest | CRAN / randomForest authors | https://cran.r-project.org/package=randomForest | Version 4.7-1.2 |
| Real-time PCR instrument | Roche Diagnostics | LightCycler 96 | software version not confirmed. Project volume/cycling differs from reported protocol; exact experiment linkage remains to be checked. |
| Refrigerated microcentrifuge | Manufacturer/model not reported in manuscript | Not reported | Not documented: exact manufacturer, model, and product URL; reported use: 12,000 × g for 15 min at 4 °C |
| rentrez | CRAN / rentrez authors | https://cran.r-project.org/package=rentrez | Version 1.2.4 |
| RIPA lysis buffer, high strength | Solarbio Life Sciences | R0010 | URL: https://www.solarbio.com/goodsInfo?id=1163 |
| SDS-PAGE electrophoresis system | Manufacturer/model not reported in manuscript | Not reported | Not documented: exact manufacturer, model, and product URL; reported use: Protein separation on 4%–20% gradient gels |
| Seurat | Satija Lab / Seurat developers | https://satijalab.org/seurat/ | Version 5.5.0 |
| SingleR | Bioconductor | https://bioconductor.org/packages/SingleR/ | Version 2.10.0 |
| Tissue homogenizer | Manufacturer/model not reported in manuscript | Not reported | Not documented: exact manufacturer, model, and product URL; reported use: Tissue homogenization in ice-cold lysis buffer |
| TriQuick Reagent total RNA extraction reagent | Solarbio Life Sciences | R1100 | URL: https://www.solarbio.com/goodsInfo?id=1083 |
| Tween-20 | Solarbio Life Sciences | T8220 | URL: https://www.solarbio.com/goodsInfo?id=102 |
| Ultra-clear flat caps for 0.2-mL PCR tube strips | Axygen / Corning | PCR-2CP-RT-C | URL: https://ecatalog.corning.com/life-sciences/b2b/TW/en/Genomics-%26-Molecular-Biology/PCR-Consumables/PCR-Tubes-and-Strip-Tubes/Axygen%C2%AE-PCR-Strip-Caps/p/PCR-2CP-RT-C |
| Universal RT-PCR Kit (M-MLV) | Solarbio Life Sciences | RP1100 | URL: https://www.solarbio.com/goodsInfo?id=992 |
| WGCNA | CRAN / WGCNA authors | https://cran.r-project.org/package=WGCNA | Version 1.74 |
| Windows | Microsoft | https://www.microsoft.com/windows/windows-11 | Windows 11 |
References
- Armstrong DG, Tan TW, Boulton AJM, Bus SA. Diabetic foot ulcers: a review. JAMA. 2023;330(1):62–75.
- Bus SA et al. Guidelines on the prevention of foot ulcers in persons with diabetes (IWGDF 2023 update). Diabetes Metab Res Rev. 2024;40(3):e3651.
- Sloan G, Selvarajah D, Tesfaye S. Pathogenesis, diagnosis and clinical management of diabetic sensorimotor peripheral neuropathy. Nat Rev Endocrinol. 2021;17(7):400–20.
- Maione AG et al. Altered ECM deposition by diabetic foot ulcer-derived fibroblasts implicates fibronectin in chronic wound repair. Wound Repair Regen. 2016;24(4):630–43.
- Caley MP, Martins VLC, O'Toole EA. Metalloproteinases and wound healing. Adv Wound Care (New Rochelle). 2015;4(4):225–34.
- Lobmann R et al. Expression of matrix-metalloproteinases and their inhibitors in the wounds of diabetic and non-diabetic patients. Diabetologia. 2002;45(7):1011–6.
- Muller M et al. Matrix metalloproteinases and diabetic foot ulcers: the ratio of MMP-1 to TIMP-1 is a predictor of wound healing. Diabet Med. 2008;25(4):419–26.
- Theocharidis G et al. Single cell transcriptomic landscape of diabetic foot ulcers. Nat Commun. 2022;13(1):181.
- Vabalas A, Gowen E, Poliakoff E, Casson AJ. Machine learning algorithm validation with a limited sample size. PLoS One. 2019;14(11):e0224365.
- Lewis MJ et al. nestedcv: an R package for fast implementation of nested cross-validation with embedded feature selection designed for transcriptomics and high-dimensional data. Bioinform Adv. 2023;3(1):vbad048.
- Hattori N et al. MMP-13 plays a role in keratinocyte migration, angiogenesis, and contraction in mouse skin wound healing. Am J Pathol. 2009;175(2):533–46.
- Pang J, Maienschein-Cline M, Koh TJ. Monocyte/macrophage heterogeneity during skin wound healing in mice. J Immunol. 2022;209(10):1999–2011.
- Finley PJ et al. Diabetic wounds exhibit decreased Ym1 and arginase expression with increased expression of IL-17 and IL-20. Adv Wound Care (New Rochelle). 2016;5(11):486–94.
- Moon JY et al. IL-17A is increased in diabetic wounds and impairs keratinocyte function via histone demethylase JMJD3. Nat Commun. 2026;17(1):780.
- Xiao Y et al. Macrophages regulate healing-associated fibroblasts in diabetic wound. Mol Biol Rep. 2024;51(1):203.
- Theocharidis G et al. Integrated skin transcriptomics and serum multiplex assays reveal novel mechanisms of wound healing in diabetic foot ulcers. Diabetes. 2020;69(10):2157–69.
- Almeida AF et al. Bioavailability of quercetin in humans with a focus on interindividual variation. Compr Rev Food Sci Food Saf. 2018;17(3):714–31.
- Khoshandam A, Imenshahidi M, Hosseinzadeh H. Pharmacokinetic of berberine, the main constituent of Berberis vulgaris L.: a comprehensive review. Phytother Res. 2022;36(11):4063–79.