在临床诊断中,检测血液中的循环核糖核酸(cRNA)是一个尚未满足的需求。本文介绍了利用高灵敏度和特异性的数字聚合酶链式反应,对非小细胞肺癌患者来源的cRNA进行表征的方法。该检测方法符合设计要求,可在72小时内检测出融合变异体。
本文内容
摘要
摘要
我们已开发出用于分离和表征肿瘤来源的循环核糖核酸(cRNA)以进行基于血液的液体活检的新方法。对从血液中回收的cRNA进行稳健检测,为解决临床诊断中一项关键的未满足需求提供了方案。该检测首先将全血采集至含有可稳定cRNA的防腐剂的采血管中。在此检测系统中,从血浆中分离出无细胞、外泌体及血小板相关RNA。cRNA被逆转录为互补DNA(cDNA),并利用数字聚合酶链式反应(dPCR)进行扩增。样本同时针对目标生物标志物和对照基因进行评估。检测验证包括分析样本的检出限、准确性和稳健性研究。通过这些研究建立的方法能够稳定地检测ROS1(C-Ros原癌基因1;8种变异体)和RET(转染时重排的原癌基因;8种变异体)的多种融合变异体。样本处理流程已优化,确保在收到样本后72小时内持续生成检测结果。
引言
多达25%的非小细胞肺癌(NSCLC)患者在确诊时可能没有足够的组织可用于检测。即使在有组织样本的情况下,其数量或质量也可能不足以进行推荐的分子检测1,2。在活检组织足以进行分子谱分析的情况下,患者可能需要等待数周甚至更长时间才能获得结果,或者在缺乏分子检测结果的情况下开始治疗3,4。然而,鉴于目前针对NSCLC患者已有多种靶向治疗方案,及时获得具有指导意义的分子诊断结果至关重要。通过液体活检检测循环游离DNA(cfDNA)为传统组织检测所面临的挑战提供了解决方案4,5,6。当前基于cfDNA并采用类似数字聚合酶链式反应(dPCR)工作流程以快速获得结果的可操作突变检测项目,包括表皮生长因子受体(EGFR)敏感性突变ΔE746-A750和L858R、EGFR耐药突变T790M、KRAS原癌基因(KRAS)变异体以及B-Raf原癌基因(BRAF)变异体V600E。尽管尚未被广泛采用,但从液体活检中分离出的循环肿瘤来源信使RNA(mRNA)也可提供重要的临床信息7,8,9。我们此前已开发并报道了从血浆中多重检测棘皮动物微管相关蛋白样4-间变性淋巴瘤受体酪氨酸激酶(EML4-ALK)融合变异体的方法10。在本研究中,我们将这些方法扩展至包括更高重数的RNA靶标ROS1和RET,每个检测可覆盖八种融合变异体。研究目标是建立一种快速、灵敏、特异且可重复的技术,用于检测既往确诊为NSCLC患者的血浆中这些融合变异体。
该检测从医生诊所开始,使用含有RNA稳定剂的采血管11。这些采血管内含有细胞保存剂以及RNase抑制剂。样本通过优先隔夜运输方式送至经美国病理学家学会(CAP)认证并符合临床实验室改进修正案(CLIA)要求的中心临床实验室(临床实验室),由合格人员进行处理。样本到达临床实验室后,所有处理步骤均在经批准的标准操作程序(SOP)下进行。全血经离心以获取血浆,随后用于分离循环RNA,这些RNA可能游离于血液中,或存在于外泌体和血小板等包被结构内7,8,9。为从上述不同组分中分离RNA,我们通过比较多种提取方法,选定了最优的RNA回收系统。所获得的RNA被浓缩后,逆转录为cDNA。在cDNA合成方法优化过程中,评估了多种逆转录酶和基因特异性引物,以最大化ROS1和RET靶标转录本的转化效率10。这对于丰度较低的循环转录本(如肿瘤来源的融合变异体)尤为关键。最后,我们优化了数字聚合酶链式反应(dPCR)中引物和探针的浓度,以实现对RET或ROS1融合变异体以及内参基因葡萄糖醛酸酶-β(GUSB)的多重检测。随后,我们将各项优化研究中获得的最佳条件整合,形成最终锁定的检测方案,再开展本报告所述的分析验证研究。该方案及研究结果为常规检测循环中罕见融合变异体提供了一种快速且高灵敏度的工作流程基础。
方案
除另有说明外,以下所列试剂均按照生产商提供的说明书进行操作。PCR检测为市售产品,旨在检测ROS1和RET融合基因。
1. 逆转录(RT)-dPCR 前的 RNA 操作:实验室最佳实践
- 处理RNA时应创建无RNase的环境。
- 使用市售的喷雾剂以灭活污染性RNase。
- 使用经过认证的无RNase试剂、枪头和离心管。移液时使用带滤芯的枪头,以防止RNase污染或样本间的交叉污染。
- 始终穿戴实验服,以防止衣物上的微粒落入样本中。指定专用的实验服用于RNA处理。
- 佩戴手套以防止皮肤中的RNase污染样本。频繁更换手套。
注意: 假设实验室台面因暴露于环境中而被 RNase 污染。接触皮肤、头发、门把手、冰箱把手、笔/标记笔的手套 等等。 被视为不再无 RNase。 - 使用RNase失活喷雾对移液器、台面、离心机及其他工作表面进行去污染处理,然后使用。
- 如有可能,应配备一套专用于RNA操作的设备。
- 在处理RNA样本时,应尽量减少实验室区域内的气流干扰,以防止颗粒物落入样本或污染工作区域。
- 将纯化的 RNA 储存于 -80 ˚C.
- 避免对RNA样本进行多次冻融,以免导致降解。
2. 用于阳性对照的分析用RNA材料的制备
- 使用已发表的mRNA序列设计目标融合变体的合成DNA10.
- 针对特定的融合变异体,选择包含融合位点及两侧足够长度以覆盖PCR扩增子的mRNA融合序列。
- 选择50 - 250 nt之间的核苷酸序列,以模拟使用血小板富集血浆捕获的循环RNA的大小。
- 在目标序列的5'端添加T7启动子序列(5'-CAGAGATGCATAATACGACTCACTATAGGGAGA-3')。
- 订购合成序列作为双链脱氧核糖核酸(DNA)片段。
- 用 Tris-EDTA (TE) 缓冲液重悬合成 DNA,使其终浓度为 10 ng/μL。µL.
- 使用60 ng合成DNA转录为RNA 体外 转录
- 使用基于苯酚/胍的试剂纯化RNA转录本12.
- 加入无 RNase 的 DNase I 以去除残留的模板 DNA。
- 测定纯化后产物的浓度 体外 使用市售荧光计配合RNA特异性染料和标准品对RNA进行定量。确保RNA浓度处于所选标准品的可接受范围内;必要时进行稀释。
- 使用含RNA染色剂的2%琼脂糖凝胶及包含50 - 250 nt大小范围的高分子量RNA Marker,通过凝胶电泳确认转录成功。
- 加入每种500 ng 体外 RNA上样至凝胶。
- 以 5 V/cm 的电压运行凝胶电泳。
- 使用光照观察单一条带,并记录结果。
- 确认每种融合变体的预期转录本大小(依据步骤 2.1.2 中的设计)。
- 确认检测每种 体外 采用匹配的变异特异性PCR检测法通过逆转录数字聚合酶链式反应(RT-dPCR)检测RNA(参见本方案第5-8步)。
- 可选:制备等摩尔混合物 体外 包含每种融合变体及对照基因 GUSB 的 RNA。
- 若执行步骤 2.9:使用针对各变异体的特异性 PCR 检测方法(参见本方案的步骤 5 - 8),通过数字聚合酶链式反应(dPCR)确认对照混合物中所包含的每种融合变异体的检出。
- 通过测试0.25至2.5 fg范围内的浓度,确定分析用阳性对照的所需输入浓度10根据期望的拷贝数输出选择浓度。
- 确认后,准备 10 µL 用于阳性对照的分析用RNA单次使用分装样本(步骤4.4),于-80℃保存 ˚C.
3. 供体样本
- 使用含有无细胞 RNA 保存剂的 10 mL 血液采集管(BCT)收集 10 mL 人全血样本。
注意: 所有献血者须同意其样本用于科研用途,且在检测过程中不得收集或使用任何与供体相关的身份识别信息。 - 在血液采集管制造商规定的时限内处理全血样本。
- 可从商业来源购买混合的正常人血浆,用于分析阳性对照。将混合正常人血浆分装为每份 1 mL 的单次使用 aliquot,并于 -80 ˚C 保存,以用于后续阳性对照实验(步骤 4.4)。
4. 从血浆中回收循环RNA
注意:进行此操作时需迅速完成。
- 将全血样本管在 200 × g 条件下离心 20 分钟。
- 使用移液管从离心后的采血管中收集最多 4 mL 血浆。注意不要搅动或吸出白膜层。
- 使用可捕获外泌体、血小板及游离RNA的市售试剂盒从血浆中分离循环RNA。每批样本处理时需同时提取阳性对照样本中的RNA。
- 每批临床样本的阳性对照制备步骤如下:
- 解冻 1 mL 混合正常人血浆分装液(步骤 3.3)。
- 解冻 10 µL 分析用 RNA 分装液(步骤 2.12)。
- 在血浆裂解液加入乙醇后,将 10 µL 分析用 RNA 加入正常人血浆样本中,制备阳性对照。
- 用 100 µL 无核酸酶水洗脱样本。立即进行RNA纯化与浓缩。
- 样本可在湿冰上加盖保存,最多不超过一小时。
- 使用基于柱的方法浓缩RNA,并用 9 µL 无RNase水洗脱。
- 立即进入步骤 5,或在湿冰上保存样本最多一小时。
5. 将 RNA 逆转录为 cDNA
- 使用市售的逆转录反应试剂盒(包含随机引物)将浓缩的循环RNA样本转化为cDNA(参见 表1 用于组分。
注意: 基因特异性引物为可选项,可根据检测变异体自行设计。引物设计应基于目标RNA序列,使用2.1步骤中的融合变异体序列。- 不包含逆转录酶对照样本和无RNA对照样本(参见 表1).
- 使用市售的DNA浓缩旋转柱从反转录反应中分离cDNA。
注意: 此步骤有助于去除酶、引物和游离的脱氧核苷三磷酸(dNTPs)。 - 立即用于PCR反应,或保存于-80 ˚C.
6. 数字PCR
注意:本 PCR 仅适用于微滴数字 PCR(参见材料表)。
- PCR混合液注意事项。
- 穿戴一次性实验服和丁腈手套。
- 在专用的试剂配制区域使用PCR混合试剂。不得在仅用于试剂配制的区域内操作cDNA。
- 操作时需遮盖探针,避免光照。过度暴露于光线会导致探针标记的荧光染料发生光漂白。
- 将混合液转移至独立的预扩增区域,转移过程中需覆盖并避光。
- 在扩增前区域的PCR洁净罩内,将待检测的cDNA加入PCR混合液中。
- 准备PCR反应混合液,最终反应体积为 20 µL 根据 表 2.
- 将PCR混合液和cDNA分装至PCR板中。
注意: 建议使用板式布局作为指导。 - 使用可移除的板封膜覆盖板子。
- 将板短暂离心,使样品聚集于孔底。
- 在平板振荡器上以低速混匀10秒。
- 短暂离心以使样品聚集于孔底。
- 移除板密封膜。使用手动或自动微滴生成系统,对PCR-cDNA混合物进行微滴生成。
- 对于手动液滴生成,转移 20 µL 将PCR混合液加入液滴生成芯片的样品孔中。添加 70 µL 使用微滴生成油。用橡胶垫圈密封后,将 cartridge 转移至手动微滴生成仪以启动微滴生成。微滴生成完成后,使用制造商推荐的吸头将微滴转移至新的 PCR 板。吸取和 dispense 微滴时应缓慢操作,每次耗时 5 至 6 秒,避免吸头开口接触微滴 cartridge 或 PCR 板。
- 为实现自动液滴生成,用铝箔密封板后转移至液滴生成仪。在启动液滴生成前,确保所有吸头、 cartridges 和板均安装到位。
- 在液滴生成并将液滴转移至新的PCR板后,使用铝箔封板膜密封,并按照以下设置进行热循环 表3.
- 热循环仪运行结束后,使用液滴读取仪读取反应板。在读取仪软件中创建反应板布局,标明对照和样本的位置, 等等。,加载到软件中以开始读取。
7. 数据分析与审阅及结果生成
- 使用市售软件分析酶标仪读数结果。
- 导航至“分析”菜单,查看二维(2D)振幅图。
- 通过检查液滴数据评估整体数据质量。
- 使用“事件”菜单评估总接受事件数。若每孔事件数少于10,000个,需仔细评估数据是否存在其他问题。
- 检查数据是否存在异常荧光振幅。重复样本间显著的振幅差异或浓度差异提示样本处理或混匀不当。
- 记录呈45度轴向喷雾模式的液滴簇,此现象提示液滴质量差或样本存在问题。
- 首先检查阳性对照、无逆转录酶(No RT)及无RNA对照(NRC)数据。选择所有对照样本,通过2D图评估簇群质量。为正确设定阈值,液滴簇群之间应有清晰分离。
- 针对每种检测变异体,根据对照孔设定阈值。
- 在2D图上使用十字准线工具设定阈值,将双阴性液滴群体与对照基因群体(标记为5'-六氯荧光素-CE亚磷酰胺探针,y轴)及变异基因群体(如存在,标记为荧光素亚胺或6-羧基荧光素探针,x轴)区分开。
- 对单个样本的各重复孔拷贝数进行加和。
- 以检测到的变异拷贝数表示检测结果。
注意:为确定判定样本阳性或阴性的分析阈值,应将一组正常健康供体样本(至少10个独立样本)按最终确定的流程进行检测,并将阈值设定为高于目标突变可检测背景信号的水平。此外,需确定判定阳性或阴性结果所需的对照基因拷贝数。该对照基因阈值作为内部质量控制(QC),用于评估每个处理RNA样本的数量与质量。
8. 使用细胞系验证 RT-dPCR 反应条件(可选)
- 为验证融合变异体的检测,使用 commercially available cell-lines 表达感兴趣的 ROS1 或 RET 融合 mRNA。操作步骤如下:
- 直接从冷冻状态开始,将速冻细胞在基于胍盐的裂解液中进行匀浆。匀浆前即使短暂解冻也可能导致 RNA 降解和损失。
- 使用专为 RNA 设计的硅胶膜离心柱进行 RNA 提取。
- 使用荧光计配合 RNA 特异性试剂和标准品测定 RNA 样品的浓度。
- 将提取的 RNA 稀释至来自血浆或其它 commercial source 的野生型 RNA 背景中。
- 按照本方案中列出的“RNA 反转录为 cDNA”、“数字 PCR”、“数据分析与审阅”以及“结果生成”等步骤操作,以确认目标变异体的检出。
结果
本方案描述了一种为检测RNA融合变异体而开发的检测系统,可用于测量非小细胞肺癌(NSCLC)患者血浆中的驱动突变(图1A)。已鉴定出NSCLC人群中最常见的RET和ROS1重排所表达的融合mRNA产物13,14,15,16,17。随后设计了多重PCR检测方法,可在单个反应中检测NSCLC中每个靶标最常见的八种转录本变异体。ROS1位点最常见的易位可与CD74、SDC4、SLC34A2、EZR或TPM3基因的5'端区域形成融合(图1B)。RET位点最常见的易位导致其与KIF5B相邻,本检测覆盖了六个外显子连接位点。此外,检测还涵盖RET的其他伙伴基因,包括CCDC6和TRIM33(图1C)。总体而言,该检测可覆盖NSCLC患者群体中已知约88%的ROS1变异和99%的RET变异17。
首先采用八种单独的 体外 包含 ROS1 或 RET 多重检测所覆盖的融合转录本 mRNA 序列的 RNA。每种 RNA 物种均针对构成多重检测体系的各个单独变异型检测进行了测试。这些检测未出现交叉反应,表明在设计的多重检测体系中具有 100% 的分析特异性(数据未显示)。为确定检测方案的最低检出限,将来源于表达检测所包含融合变异型细胞系的总 RNA,以 5%、1%、0.2% 和 0.04% 的浓度混入正常 RNA 背景中。多重 RET 和 ROS1 变异型 PCR 检测可检测低至 0.2% 的融合变异型(图2A-B)。此外,使用多重 ROS1 和 RET 检测方法对一种含 5% 脱靶细胞系来源的 RNA(表达 EML4-ALK 融合转录本)样本进行检测时未产生信号,进一步验证了该方法的特异性(图2A-B).
对 ROS1 和 RET 的 RT-dPCR 流程进行了精密度检测。分析用对照材料由等摩尔混合物组成 体外 RNA在同一天内(日内)、连续三天(日间)以及由两名操作人员(操作者间)分别在三种浓度(高、中、低)下进行逆转录和数字PCR处理。精密度检测结果显示,目标融合转录本以及作为内部质控指标的对照基因GUSB均得到了准确检测。图2C-D).
除了GUSB内参对照外,每批临床样本均运行一组批次对照。阳性对照由代表RT-dPCR中检测的每种融合变异体的分析用in vitro RNA混合物以及GUSB的分析用in vitro RNA制备而成。该RNA在RNA提取过程中被加入至正常人血浆裂解液中,并在整个实验流程中与临床样本同步处理。无逆转录酶(No RT)对照为阴性对照,用于确认RNA提取流程中无污染物质,并验证引物对RNA的特异性。No RT对照使用与阳性对照相同的材料制备,但在cDNA合成反应中不加入逆转录酶。无RNA对照(NRC)为阴性对照,用于确认逆转录反应组分中无污染性转录本。该对照在cDNA合成步骤引入流程,反应中以水替代RNA模板。若要获得准确结果,No RT和NRC对照在两个检测通道中均必须为阴性。表1列出了各对照的逆转录反应组分。这些对照的二维图示例显示于ROS1(图3 A-C)和RET(图3 E-G)多重检测中。融合变异体采用荧光素酰胺(FAM)探针检测,位于y轴;而内参基因GUSB采用5'-六氯荧光素-CE磷酰胺(HEX)探针检测,位于x轴。这些批次对照在21天内进行了评估,以确定检测的稳健性。在研究期间进行的全部21次运行中,ROS1和RET的融合阳性液滴及GUSB内参基因液滴均被检出(图3D,H)。所有阴性对照(No RT和NRC)在连续21天内均显示阴性结果(数据未显示)。
在临床实验室环境中,故障排除能力是任何检测方案的关键组成部分。本文提供了使用 RT-dPCR 方案时出现非理想结果的实际案例。第一个案例为二维图,展示了无逆转录酶对照的重要性(图 4A)。在此示例中,尽管由于缺乏酶而未发生 cDNA 转换,但仍出现了突变阳性液滴。该结果可能是由于 dPCR 引物扩增了非靶标基因组 DNA 所致。此时,设计跨越内含子的检测方案可防止基因组 DNA 的扩增。或者,可使用无 RNase 的 DNase 酶去除污染的 DNA,但不推荐用于稀有靶标的检测,因为在酶孵育过程中可能发生部分 RNA 降解。下一个二维图示例为 NRC,其在两个通道中均出现阳性液滴(图 4B),表明在 RT-dPCR 建立过程中某一步骤发生了污染。此时建议丢弃检测中可能受污染的试剂,彻底清除所有设备的污染,并使用新的反应组分重新检测。第三个二维图示例表现为沿 45° 线分布的液滴喷雾状信号(图 4C),通常由液滴剪切和合并引起。在热循环前需谨慎操作液滴,因为液滴易受损伤。建议在条件允许时使用自动液滴生成装置。若手动转移液滴,务必选用推荐的宽口吸头,并采用谨慎的移液技术。液滴转移时应缓慢吸液和排液,每次操作持续 5–6 秒,且移液器吸头开口不得接触液滴微孔板或孔壁。排液时,保持吸头尖端与液面齐平,并随液滴排出缓慢上移(可观看视频演示)。最后一个二维图示例显示阳性与阴性液滴群之间缺乏分离(图 4D),可能由多种原因导致。强效的 PCR 抑制剂(如裂解缓冲液中使用的去污剂)或大量高度降解的 DNA 均可能导致分离度下降。此时可考虑在 cDNA 合成与 dPCR 之间增加纯化步骤(如本方案第 5 步所述)。此外,分离度不足也可能源于次优的扩增条件,因此应考虑优化 PCR 步骤。
数据内 图5 代表984例真实世界患者样本的周转时间,展示了该检测流程的快速特性。在79%的病例中,结果在样本收到后48小时内即报告给主治医师;95%的病例在72小时内完成报告。综上所述,采用稳定的循环RNA血液采集管、优化的血液RNA提取流程,以及包含适当内部对照和批次对照的优化逆转录数字PCR(RT-dPCR)检测方案,可提供一种快速、准确检测非小细胞肺癌(NSCLC)相关融合RNA变异的检测系统。
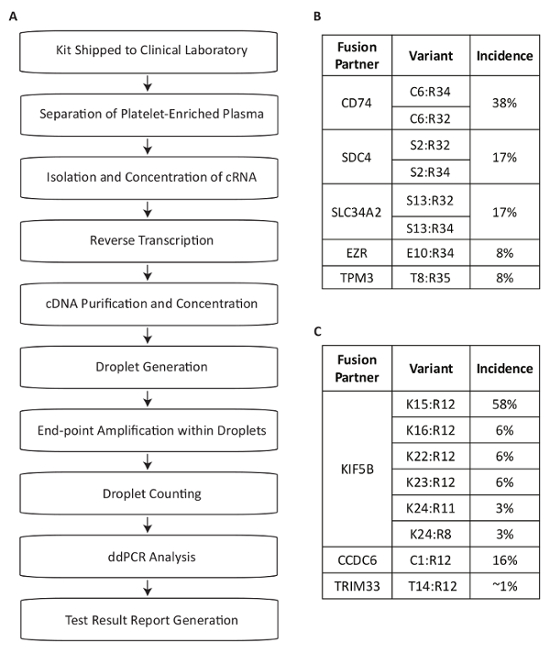
图 1:使用针对 NSCLC 中最常见 RET 和 ROS1 变体的特异性检测方法进行融合变体检测的血液样本处理步骤概览。(A)当采集全血并将 BCT 随样本采集盒运送至临床实验室时,开始样本检测。从富集血小板的血浆中多个来源回收循环 RNA,通过基因特异性引物进行逆转录,并纯化后用于 dPCR。样本使用市售系统进行处理,该系统包括液滴生成(乳化)、扩增和液滴计数。数据通过市售软件进行分析。检测结果随后被记录并反馈给申请检测的医生。该流程设计为从收到样本到结果发布在 72 小时内完成。多重检测覆盖了(B)ROS1 和(C)RET 的八个变体。经 Biodesix 网站授权改编。请点击此处查看此图的放大版本。
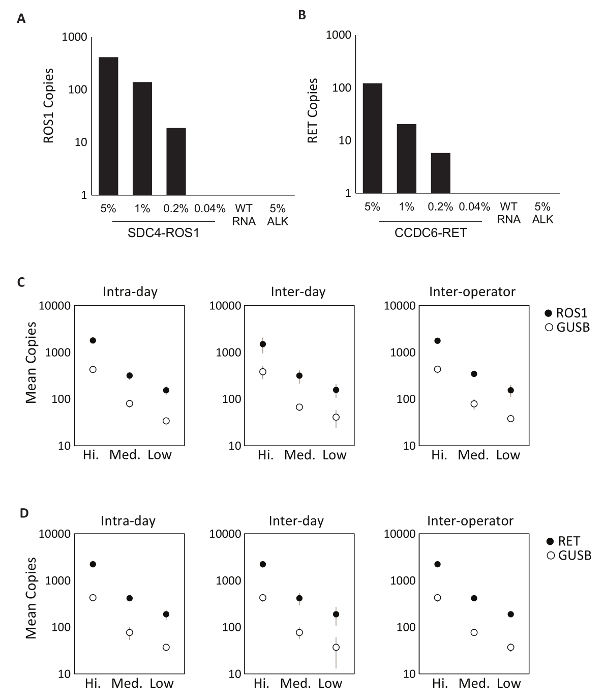
图 2:分析验证。 将表达(A)SDC4-ROS1 融合基因和(B)CCDC6-RET 融合基因的细胞系稀释于总人源野生型 RNA(WT RNA)背景中。针对每种融合变异体,根据每种变异体检测预定义的标准,确定检测下限为 0.2% 的变异频率。高于此阈值的所有样本均含有至少 21 个拷贝的对照基因。在野生型 RNA 背景中检测 5% 的 EML4-ALK(ALK)标准品以验证检测特异性,结果为阴性,证实了特异性。在高、中、低浓度下检测分析多重 RNA 标准品,分别对应(C)ROS1 和(D)RET。通过同一天内三次运行(日内)、连续三天每天一次运行(日间)以及两名独立操作者(操作者间)进行精密度评估。图中显示拷贝数的均值及标准差。经 Biodesix 网站授权改编。 请点击此处查看该图的放大版本。
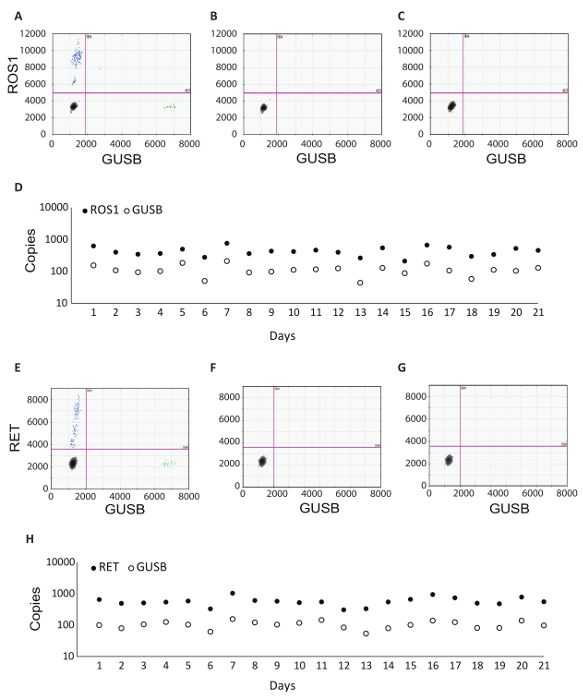
图 3:批处理对照示例与稳健性数据。 ROS1 多重检测数字 PCR 结果的二维图,包括(A)阳性对照、(B)无逆转录酶对照和(C)无 RNA 模板对照。(D)对照在连续 21 天(不含周末和节假日)内运行。ROS1 阳性对照的平均拷贝数 ± 标准差为 439 ± 141。每天同时运行无逆转录酶和无模板对照,结果均为阴性(数据未显示)。RET 多重检测数字 PCR 结果的二维图,包括(E)阳性对照、(F)无逆转录酶对照和(G)无 RNA 模板对照。(H)对照在连续 21 天(不含周末和节假日)内运行。RET 阳性对照的平均拷贝数 ± 标准差为 586 ± 182。未显示的是每天同步运行的无逆转录酶和无模板对照,结果均为阴性。经许可改编自 Biodesix 网站。请点击此处查看该图的高清版本。
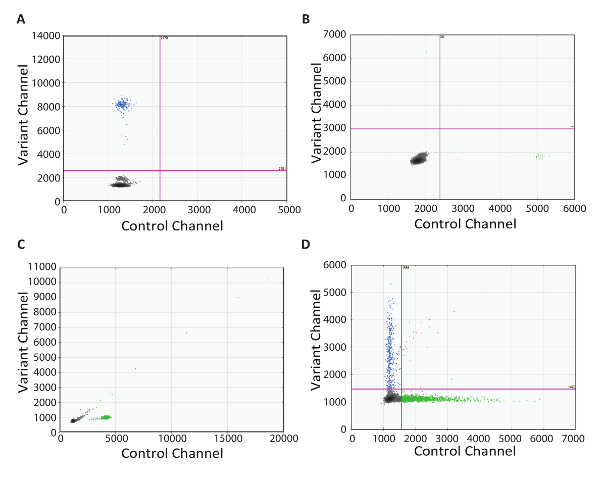
图 4:RT-dPCR 故障排除。 二维图显示了在以下情况下获得的次优 dPCR 结果:(A)无逆转录酶对照中存在污染,(B)无 RNA 对照中存在污染,(C)液滴发生剪切与合并,以及(D)PCR 条件未充分优化或存在 PCR 抑制。 请点击此处查看该图的放大版本。
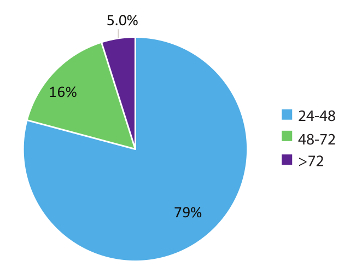
图5周转时间(TAT) TAT(以小时计)针对要求检测RNA变异的检测项目(n = 984)进行了汇总。数据排除了周末、节假日以及被暂存的样本 >24 小时,因实验室检测申请表上的临床信息不完整。 请点击此处查看该图的放大版本。
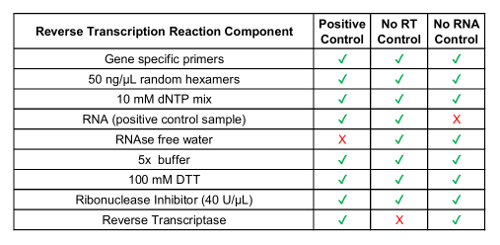
表 1:逆转录反应试剂的制备用于过程对照。
| 组分 | 体积 |
| 探针用 2x dPCR 超混合液 (不含 2’-脱氧尿苷 5’-三磷酸) | 10 µL |
| 20x 变体靶标引物/探针组 (450 nmol/L 引物,250 nmol/L FAM 探针) | 1 µL |
| 20x 对照靶标引物/探针组 (450 nmol/L 引物,250 nmol/L HEX 探针) | 1 µL |
| 无核酸酶水 | 1 µL |
| cDNA | 7 µL |
表2:数字PCR主混合液的制备。
| 循环步骤 | 温度 | 时间 | 循环次数 | 升降温速率 |
| 酶活化 | 95 °C | 10 min | 1 | ~2 oC/s |
| 变性 | 94 °C | 30 s | 40 | |
| 退火/延伸 | 55 °C | 1 min | ||
| 酶失活 | 98 °C | 10 min | 1 | |
| 保存(可选) | 4 °C | 无限 | 1 | ~1 oC/s |
表3:热循环条件。
讨论
RET 和 ROS1 重排共同构成了非小细胞肺癌(NSCLC)患者群中约 3% 的驱动突变18。尽管这类突变较为罕见,但检测这些遗传变异至关重要。携带这些变异的 NSCLC 患者可能从靶向治疗中获益,此类疗法可特异性抑制由癌蛋白引起的异常激酶活性13。目前已有部分药物获得美国食品药品监督管理局(FDA)批准,用于 ROS1 阳性的 NSCLC 治疗,另有其他药物在临床试验中已证实对 RET 具有疗效19。
数字PCR技术具有理想的灵敏度,适用于液体活检应用20。该技术已被广泛用于检测非小细胞肺癌(NSCLC)患者循环游离DNA(cfDNA)中的肿瘤突变4,6,21,22,23。除cfDNA外,我们还开发了一种实验方案,用于对NSCLC患者血液中肿瘤来源的RNA(ctRNA)中最常见的融合变异体进行高灵敏度检测(图1A)10。
我们已建立的方案可实现低至0.2%的分析检测限(图2)。尽管逆转录数字聚合酶链式反应(RT-dPCR)具有极高的特异性和灵敏度,但该检测方法仅限于PCR检测中所选定并进行多重检测的已知融合变异体。因此,必须谨慎选择纳入多重检测的融合变异体,以确保在非小细胞肺癌(NSCLC)患者群体中实现充分的覆盖。我们已成功设计出针对RET和ROS1的检测方法,可同时检测由RET或ROS1基因位点重排产生的八种融合变异体,分别覆盖了99%和88%的RET阳性及ROS1阳性患者群体(图1B-C)17。
本研究所述的最终检测流程包含批间对照,以确保结果的一致性。这些对照包括一个阳性分析标准品以及两个阴性对照,共同确保批内无污染或PCR抑制现象发生(图3)。为验证该检测方法的稳健性,采用批间对照进行了为期21天的研究(图3D,H)。这些数据表明了本方案所建立的RNA处理流程具有良好的一致性。
良好的实验室规范和适当的RNA操作是确保结果可靠且准确的关键要素。使用专门用于RNA操作的实验空间和设备、每次使用后清洁设备、采用无RNase的试剂和耗材,以及在工作区域使用RNase失活喷雾,均有助于减少污染性RNase。技术人员对RNA样本的谨慎操作,包括穿戴专用实验服、频繁更换手套、快速完成RNA提取步骤以及始终保持样本处于冰上,对于维持样本完整性至关重要。一旦RNA被逆转录为cDNA,样本即进入更稳定的形式,不易发生降解。除维护RNA完整性的措施外,PCR组分和样本应分区存放,以防止可能导致假阳性结果的交叉污染。PCR主试剂储备液及配制过程应与PCR模板严格分离,并须特别注意将扩增后的模板(PCR后)与所有未扩增材料(包括试剂、RNA和cDNA样本)分开。最后,在扩增前正确制备和处理乳化PCR混合液,对于维持液滴完整性和实现最佳dPCR条件至关重要。在执行本实验方案过程中,采取此类预防措施对于获得一致且准确的结果极为关键。所有数据均应在结果发布前由经过培训的人员进行审查,以确保所有质控指标均已达标。若出现结果不理想的情况(图4),该批次必须由技术人员和实验室主任共同复核,并可能需要重新处理。
从样本接收后最早可在24小时内获得RT-dPCR检测结果,本研究使用的测试样本集(n = 984)中95%的样本结果可在接收后72小时内报告给申请检测的临床医生(图5)。该检测周转时间使临床医生能够在允许启动适当治疗的时间范围内获得急需的分子信息。这些结果通常比传统组织活检获得的结果更早。可采用类似的循环RNA检测方法开发用于非小细胞肺癌(NSCLC)及其他癌症的更多生物标志物,并可同样受益于快速出结果的优势。例如,使用RT-dPCR检测程序性死亡配体1(PD-L1)mRNA转录本可为临床医生提供有关免疫治疗选择的信息。目前对利用液体活检和dPCR监测治疗疗效的兴趣日益增长。通过基因组检测特定变异的早期复发迹象,可在患者出现影像学等标准诊疗手段可检测的症状之前,使临床医生及时调整治疗方案24。本研究中报道的此类检测方案因其无创性、高灵敏度、快速周转时间及成本效益,非常适用于治疗监测。本文所述检测方法可在样本接收后72小时内提供结果,且假阳性检出率极低,有助于快速制定治疗决策,并克服部分基于组织检测所面临的局限性4。
我们的方案和数据展示了一种可靠的检测系统,可用于鉴定低丰度的RNA变异体,并展现了基于血液的突变检测在临床实践中的应用潜力。对于那些通过此类快速靶向液体活检方法未能检出可操作驱动突变的患者,结合更全面的组织和血液基因组与蛋白质组检测,可能提供更广泛的临床信息,以支持治疗方案的制定。
披露
H.M.、L.J.、K.A. 和 G.A.P. 是 Biodesix 公司的员工,并持有该公司股份。H.M.、L.J. 和 G.A.P. 是 Biodesix 公司提交的一项专利申请的共同发明人,该专利涉及一种用于检测非小细胞肺癌中循环遗传变异的诊断测试系统。
致谢
我们感谢来自数字生物中心(Bio-Rad Inc.,CA)的合作者Stephen Jones、Nia Charrington、Dianna Maar博士和Samantha Cooper博士在检测方法设计方面提供的支持;感谢Norgen Biotek(加拿大)的Nezar Rghei和Moemen Abdalla博士在优化RNA提取方案过程中给予的关键性建议;同时感谢Shannon Campbell、Scott Thurston、Jeff Fensterer、Shannon Martello和Joellyn Enos在检测需求及商业监测方面提供的协助。
材料
| 姓名 | 公司 | 目录编号 | 评论 |
|---|---|---|---|
| 超纯去离子水(DNA酶、RNA酶无)(500 mL) | Life Technologies | 10977-015 | 1604071 |
| 超纯去离子水(DNA酶、RNA酶无)(500 mL) | Life Technologies | 10977-015 | 1809353 |
| 无核酸酶水(分子级) | Ambion | AM9938 | 1604071 |
| 无核酸酶水(分子级) | Ambion | AM9938 | 1606077 |
| 1× 磷酸盐缓冲液,无菌 | Amresco | K812-500mL | 1446C189 |
| 1× 磷酸盐缓冲液,无菌 – 500 mL | Invitrogen | 10010023 | 1916C092 |
| RNase Zap(Life Tech)(250 mL) | Ambion | AM9780 | 353952 |
| β-巯基乙醇(BME) (250 mL) | CalbioChem | 6050 | W105B |
| OmniPur 乙醇 | CalbioChem | 4455-4L | 56054611 |
| OmniPur 乙醇 | CalbioChem | 4455-4L | 56238638 |
| 异丙醇 | VWR | 0918-4L | 2116C416 |
| TranscriptAid T7 高产转录试剂盒 | Thermo Scientific | K0441 | 403648 |
| TranscriptAid T7 高产转录试剂盒 | Thermo Scientific | K0441 | 288461 |
| DNase I | 赛默飞世尔科技 | K0441 | 371299 |
| QIAzol 裂解试剂 | Qiagen | 79306 | 54809699 |
| 20x TE 缓冲液 pH 8.0 | Alfa Aesar | J62388 | R13C548 |
| UltraPure 琼脂糖 | Invitrogen | 16500-100 | 552730 |
| 10x TBE缓冲液 | Invitrogen | AM9863 | 353065 |
| 游离RNA采血管 | Streck | 218976 | 60110327 |
| 游离RNA采血管 | Streck | 218976 | 61900327 |
| 游离RNA采血管 | Streck | 218976 | 61480327 |
| 游离RNA采血管 | Streck | 218976 | 62320327 |
| 血浆/血清循环及外泌体RNA纯化试剂盒(悬液型)50次预装 | Norgen | 42800 | 585849 |
| 血浆/血清循环及外泌体RNA纯化试剂盒(悬液剂型)50次prep | Norgen | 42800 | 588308 |
| 裂解缓冲液 | Norgen | 21205 | A5F61E |
| RNA纯化与浓缩微型洗脱试剂盒(Norgen)50次prep | Norgen | 61000 | 585848 |
| RNA 纯化与浓缩微型洗脱试剂盒(Norgen)50 次预处理 | Norgen | 61000 | 588309 |
| DNA纯化与浓缩试剂盒-5 200 次制备(样品) | Zymo | D4014 | ZRC186976 |
| DNA Clean and ConcentratorTM-5 200 次制备(样品) | Zymo | D4014 | ZRC188077 |
| DNA Clean and ConcentratorTM- 5 200 次制备(样品) | Zymo | D4014 | ZRC188413 |
| 采集管 500 个装 | Zymo | C1001-500 | N/A |
| SuperScript IV 第一链合成系统 200 次反应(样品) | Life Technologies | 18091200 | 391657 |
| SuperScript IV 第一链合成系统 200 次反应(样品) | Life Technologies | 18091200 | 392504 |
| SuperScript IV 第一链合成系统 200 次反应(样品) | Life Technologies | 18091200 | 448001 |
| SuperScript IV 逆转录酶 | Life Technologies | 18090200 | 451702 |
| Qubit HS RNA 检测试剂盒(500) | Life Technologies | Q32854 | 1745264 |
| Qubit 测定管(500) | Life Technologies | Q32856 | 13416Q311 |
| 探针法ddPCR超级混合液(不含dUTP) | Bio-Rad | 1863023 | 64031651 |
| ddPCR探针超级混合液(不含dUTP) | Bio-Rad | 1863023 | 64063941 |
| 探针用微滴式数字聚合酶链式反应超级混合液(不含dUTP) | Bio-Rad | 1863023 | 64065740 |
| 探针用微滴式数字聚合酶链反应超级混合液(不含dUTP) | Bio-Rad | 1863023 | 64065741 |
| 探针用ddPCR超级混合液(不含dUTP) | 伯乐(Bio-Rad) | 1863023 | 64079083 |
| 探针用微滴式数字PCR缓冲液对照 | Bio-Rad | 1863052 | 64025320 |
| 探针用微滴式数字PCR缓冲液对照 | Bio-Rad | 1863052 | 64052358 |
| gBlock KIF5B-RET K15:R12 | IDT | 151004172 | 2016年10月4日 |
| gBlock KIF5B-RET K16:R12 | IDT | 151004173 | 2016年10月4日 |
| gBlock KIF5B-RET K22:R12 | IDT | 151004174 | 2016年10月4日 |
| gBlock KIF5B-RET K23:R12 | IDT | 151004175 | 2016年10月4日 |
| gBlock KIF5B-RET K24:R11 | IDT | 151004176 | 2016年10月4日 |
| gBlock KIF5B-RET K24:R8 | IDT | 151004177 | 2016年10月4日 |
| gBlock CCDC6-RET C1:R12 | IDT | 151004178 | 2016年10月4日 |
| gBlock TRIM33-RET T14:R12 | IDT | 151004179 | 2016年10月4日 |
| RET 外显子 8 逆转录基因特异性引物 | IDT | 150554385 | 2016年9月28日 |
| 5’-CTCCACTCACACCTG-3’ | IDT | 150554385 | 2016年9月28日 |
| RET外显子11逆转录基因特异性引物 | IDT | 150554384 | 2016年9月28日 |
| 5’-GCAAACTTGTGGTAGCAG-3’ | IDT | 150554384 | 2016年9月28日 |
| RET 外显子 12 逆转录基因特异性引物 | IDT | 150554383 | 2016年9月28日 |
| 5’-CTGCCTTTCAGATGGAAG-3’ | IDT | 150554383 | 2016年9月28日 |
| gBlock CD74-ROS1 C6:R34 | IDT | 152324366 | 2016年11月15日 |
| gBlock CD74-ROS1 C6:R32 | IDT | 152324367 | 2016年11月15日 |
| gBlock SDC4-ROS1 S2:R32 | IDT | 152324368 | 2016年11月15日 |
| gBlock SDC4-ROS1 S2:R34 | IDT | 152324369 | 2016年11月15日 |
| gBlock S13del2046-ROS1 S13del2046:R32 | IDT | 152324370 | 2016年11月15日 |
| gBlock S13del2046-ROS1 S13del2046:R34 | IDT | 152324371 | 2016年11月15日 |
| gBlock EZR-ROS1 E10:R34 | IDT | 152324372 | 2016年11月15日 |
| gBlock TPM3-ROS1 T8:R35 | IDT | 152324373 | 2016年11月15日 |
| ROS1 外显子 34 RT 基因特异性引物 | IDT | 152704983 | 2016年11月21日 |
| 5’-CCTTCCTTGGCACTTT-3’ | IDT | 152704983 | 2016年11月21日 |
| ROS1 外显子 35 逆转录基因特异性引物 | IDT | 152704985 | 2016年11月21日 |
| 5’-CTCTTGGGTTGGAAGAGTATG-3’ | IDT | 152704985 | 2016年11月21日 |
| ALK基因特异性引物 | IDT | 140035422 | 2016年8月26日 |
| 5’-CAGTAGTTGGGGTTGTAGTCG-3’ | IDT | 140035422 | 2016年8月26日 |
| EML4-ALK 细胞系沉淀物 | Horizon Discovery | N/A | 2015年6月11日 |
| SLC34A2-ROS1 细胞系沉淀物 | Horizon Discovery | N/A | 2015年6月11日 |
| CCDC6-RET 细胞系沉淀 | Horizon Discovery | N/A | 2015年6月11日 |
| 人脑总RNA | Ambion | AM7962 | 1703548 |
| PrimePCR ddPCR 专家设计检测:K15:R12 | Bio-Rad | N/A | 2016年8月17日 |
| PrimePCR ddPCR 专家设计检测:K16:R12 | Bio-Rad | N/A | 2016年8月17日 |
| PrimePCR ddPCR 专家设计检测:K22:R12 | Bio-Rad | N/A | 2016年8月17日 |
| PrimePCR ddPCR 专家设计检测:K23:R12 | 伯乐(Bio-Rad) | N/A | 2016年8月17日 |
| PrimePCR ddPCR 专家设计检测:K24:R11 | Bio-Rad | N/A | 2016年8月17日 |
| PrimePCR ddPCR 专家设计检测:K24:R8 | 伯乐(Bio-Rad) | N/A | 2016年8月17日 |
| PrimePCR ddPCR 专家设计检测:C1:R12 | Bio-Rad | N/A | 2016年8月17日 |
| PrimePCR ddPCR 专家设计检测:T14:R12 | Bio-Rad | N/A | 2016年8月17日 |
| PrimePCR ddPCR 专家设计检测:C6:R34 | 伯乐 /碧迪西斯 | N/A | 2016年6月16日 |
| PrimePCR ddPCR 专家设计检测:C6:R32 | 伯乐 /碧迪赛斯 | N/A | 2016年6月16日 |
| PrimePCR ddPCR 专家设计检测:S2:R32 | 伯乐 /碧迪西斯 | N/A | 2016年6月16日 |
| PrimePCR ddPCR 专家设计检测:S2:R34 | 伯乐 / 生物六方 | N/A | 2016年12月6日 |
| PrimePCR ddPCR 专家设计检测:S13del2046:R32 | 伯乐 /碧迪西斯 | N/A | 2016年6月16日 |
| PrimePCR ddPCR 专家设计检测:S13del2046:R34 | 伯乐 /碧迪西斯 | N/A | 2016年12月6日 |
| PrimePCR ddPCR 专家设计检测:E10:R34 | 伯乐 / 生物六方 | N/A | 2016年6月16日 |
| PrimePCR ddPCR 专家设计检测:T8:R35 | 伯乐 / 生物六方 | N/A | 2016年6月16日 |
| (版本 2) | Bio-Rad | 12003909 | 213939881 |
| PrimePCR ddPCR 专家设计检测:ROS1 多重检测(版本 3.2) | Bio-Rad | N/A | 2016年12月13日 |
| PrimePCR ddPCR 专家设计检测:ROS1 多重检测(版本 3.2) | Bio-Rad | N/A | 20170112v3.2 |
| PrimePCR ddPCR 基因表达探针检测:GUSB,人 | Bio-Rad | 10031257 | 212851151 |
| PrimePCR ddPCR 基因表达探针检测:GUSB,人 | Bio-Rad | 10031257 | 207383915 |
| PrimePCR ddPCR 基因表达探针检测:GUSB,人 | Bio-Rad | 10031257 | 195995635 |
| PrimePCR ddPCR 基因表达探针检测:GUSB,人 | Bio-Rad | 10031257 | 212851152 |
| PrimePCR ddPCR 基因表达探针检测:GUSB,人 | 伯乐(Bio-Rad) | 10031257 | 213949301 |
| PrimePCR ddPCR Expert Design 检测试剂盒:EML4-ALK | Bio-Rad | 12003909 | 20160914 |
| PrimePCR ddPCR 专家设计检测:EML4-ALK | Bio-Rad | 12003909 | 211383227 |
| 探针用液滴生成油 | Bio-Rad | 186-3005 | 1065C220 |
| 探针用微滴生成油 | Bio-Rad | 186-3005 | 64052953 |
| 探针用液滴生成油 | Bio-Rad | 186-3005 | 64052358 |
| 探针用自动液滴生成油(20x96) | 伯乐(Bio-Rad) | 186-4110 | 1065C320 |
| 探针用自动化液滴生成油(20x96) | Bio-Rad | 186-4110 | 64052952 |
| 探针用自动液滴生成油(20x96) | 伯乐(Bio-Rad) | 186-4110 | 64064127 |
| DG8 QX100/QX200 微滴生成仪用微滴生成卡盒 | Bio-Rad | 186-4008 | C000065883 |
| DG8 QX100/QX200 微滴生成仪用微滴生成卡 | 伯乐(Bio-Rad) | 186-4008 | C000084276 |
| DG8 微流控芯片,适用于 QX100/QX200 微滴生成仪 | Bio-Rad | 186-4008 | C000079928 |
| DG8 QX100/QX200 微滴生成仪用盒 | Bio-Rad | 186-4008 | C000084395 |
| DG8 QX100/QX200 微滴生成仪用试剂盒 | Bio-Rad | 186-4008 | C000084634 |
| Droplet Generator DG8 密封垫 | Bio-Rad | 186-3009 | 20160627 |
| Droplet Generator DG8 密封垫 | Bio-Rad | 186-3009 | 20161107 |
| Droplet Generator DG8 密封垫 | Bio-Rad | 186-3009 | 20161206 |
| Droplet Generator DG8 密封垫 | Bio-Rad | 186-3009 | 20161216 |
| Droplet Generator DG8 密封垫 | Bio-Rad | 186-3009 | 20170125 |
| 用于自动液滴发生器的移液管吸头 | Bio-Rad | 1864120 | PR125340 |
| DG32 自动化液滴生成仪用试剂盒(10-96 孔板) | Bio-Rad | 186-4108 | 206894 |
| DG32 自动液滴生成仪用试剂盒(10-96 孔板) | Bio-Rad | 186-4108 | 206893 |
| 可穿刺铝箔热封膜 | Bio-Rad | 1814040 | 1409850 |
| 可穿刺箔片热封 | Bio-Rad | 1814040 | 100402 |
| 可穿刺铝箔热封 | Bio-Rad | 1814040 | 145851 |
| Microseal 'B' 密封膜 | Bio-Rad | MSB1001 | BR00428490 |
| ddPCR 微滴读取油 | Bio-Rad | 186-3004 | 64039089 |
| ddPCR 微滴读数仪用油 | Bio-Rad | 186-3004 | 64049253 |
| ddPCR 微滴读取仪用油 | Bio-Rad | 186-3004 | 64049255 |
| ddPCR 微滴读数仪用油 | Bio-Rad | 186-3004 | 64081870 |
| DNA Lo Bind Tube 0.5 mL | Eppendorf | 22431005 | E1629620 |
| DNA Lo Bind Tube 1.5 mL | Eppendorf | 22431021 | F16698K |
| DNA Lo Bind 管 2 mL | Eppendorf | 22431048 | E160610I |
| 50 mL 离心管,聚丙烯(25) | 赛默飞世尔科技 | 339652 | G5ZF5W8118 |
| TempAssure PCR 8联管,光学盖,天然色,聚丙烯(120个) | USA Scientific | 1402-4700 | 16202 |
| 适用于 Rainin LTS 移液器 0.5-20 µL 提示 | Pipette.com | LF-20 | 40155-642C4-642C |
| 适用于 Rainin LTS 移液器 5-200 µL 提示 | Pipette.com | LF-250 | 40154-642C4-642B |
| LTS 200 µl 滤芯吸头 960/10 RT-L200F(10 盒) | Rainin | 17002927 | 1635 |
| 移液器吸头,10 μl TipOne RPT 超低吸附带滤芯吸头补充装盒,无菌 | USA Scientific | 1181-3710 | F1175551-1108 |
| 移液器吸头,10 μl TipOne RPT 超低吸附带滤芯吸头补充装盒,无菌 | USA Scientific | 1181-3710 | F118054L-1720 |
| 移液器吸头,100 μl TipOne RPT 超低吸附带滤芯吸头补充装盒,无菌(10×96) | USA Scientific | 1180-1740 | 0014961Q-2501 |
| 移液器吸头,200 µl TipOne RPT 超低吸附带滤芯吸头补充装盒,无菌 | USA Scientific | 1180-8710 | E116684P-1540 |
| 移液器吸头,1000 µl XL TipOne RPT 超低吸附滤芯吸头补充盒,无菌(10×96) | USA Scientific | 1182-1730 | F118815P |
| 5 mL 标准架装 Gilson 适配吸头 | 科学专业领域 | 4411-00 | 14312 |
| Combitips advanced,0.1 mL Biopur | Eppendorf | 003 008 9618 | F165414H |
| Combitips advanced,0.2 mL Biopur | Eppendorf | 0030 089.626 | F166689J |
| Combitips advanced,5 mL Biopur | Eppendorf | 0030.089 669 | F166054J |
| Combitips advanced,50 mL Biopur | Eppendorf | 003.008.9693 | F166055I |
| 试剂储液槽 | VWR | 89094-680 | 141500 |
| Twin tec PCR 板 96 孔,半裙边,透明 | Eppendorf | 951020303 | E163697P |
| Twin tec PCR 96 孔板,半裙边,透明 | Eppendorf | 951020303 | F165029I |
| Twin tec PCR 板 96 孔,半裙边,透明 | Eppendorf | 951020303 | F165028G |
| Twin tec PCR 96 孔板,半裙边,透明 | Eppendorf | 951020303 | E163697P |
| 96 孔 Twin tec PCR 板,半裙边,绿色 | Eppendorf | 951020346 | F166183K |
| 仪器类型 | 设备编号 | ||
| 分析天平 | EQP0125 | ||
| 超低温冰箱 1,-80oC | EQP0095 | ||
| 冰箱 6.1 立方英尺 GP06W1AREF | EQP0139 | ||
| -20oC 冷冻柜 | EQP0140 | ||
| Beckman Coulter Microfuge 22R | EQP0025 | ||
| Beckman Coulter Microfuge 22R | EQP0124 | ||
| Thermo Scientific Hereaus Megafuge 8 | EQP0104 | ||
| 迷你离心机 | EQP0131 | ||
| 迷你离心机 | EQP0136 | ||
| 微型离心机 | EQP0134 | ||
| 微型离心机 | EQP0235 | ||
| 迷你离心机 | EQP0216 | ||
| Thermo Scientific HeraTherm 培养箱 | EQP0105 | ||
| 移液 0.1 - 2.5 μL | EQP0182 | ||
| 移液 0.1 - 2.5 μL | EQP0072 | ||
| 移液 0.1 - 2.5 μL | EQP0070 | ||
| 移液0.5-10 μL | EQP0218 | ||
| 移液0.5-10 μL | EQP0075 | ||
| 移液0.5–10 μL | EQP0169 | ||
| 移液0.5–10 μL | EQP0074 | ||
| 移液0.5-10 μL | EQP0147 | ||
| 移液 2 - 20 μL | EQP0128 | ||
| 移液 2 - 20 μL | EQP0160 | ||
| 移液 2 - 20 μL | EQP0018 | ||
| 移液 2 - 20 μL | EQP0146 | ||
| 移液 10 - 100 μL | EQP0079 | ||
| 移液 10 - 100 μL | EQP0181 | ||
| 移液 10 - 100 μL | EQP0085 | ||
| 移液 10 - 100 μL | EQP0077 | ||
| 移液20 - 200 μL | EQP0088 | ||
| 移液 20 - 200 μL | EQP0087 | ||
| 移液 20 - 200 μL | EQP0231 | ||
| 移液 100 - 1000 μL | EQP0050 | ||
| 移液 100 - 1000 μL | EQP0158 | ||
| 移液100 - 1000 μL | EQP0217 | ||
| 移液100 - 1000 μL | EQP0082 | ||
| 移液100 - 1000 μL | EQP0183 | ||
| 移液 100 - 1000 μL | EQP0083 | ||
| 移液5 mL | EQP0153 | ||
| 计时器 | S/N 140623950 | ||
| Hamilton SafeAire VAV 通风柜 | EQP0206 | ||
| 生物安全柜 | EQP0205 | ||
| 生物安全柜 | EQP0204 | ||
| Qubit 3.0 | EQP0102 | ||
| 基准数字加热模块 | EQP0108 | ||
| Benchmark 数字加热块 | EQP0231 | ||
| Polaroid Z2300 即时打印数码凝胶相机,带 WiFi 和 16GB SDHC 存储卡 | EQP0111 | ||
| 电泳电源装置 | EQP0113 | ||
| 电泳小型胶盒 | EQP0116 | ||
| Maestro Transilluminator | EQP0118 | ||
| 微波 | EQP0215 | ||
| 多通道 8 孔移液器 2 - 20 μL | EQP0207 | ||
| 多通道8道移液器 10 - 100 μL | EQP0090 | ||
| Rainin 多通道 8 道移液器 50 μL | EQP0094 | ||
| Rainin 多通道 8 道移液器 50 μL | EQP0161 | ||
| Rainin 多通道 8 道移液器 50 μL | EQP0162 | ||
| Rainin 多通道 8 排移液器 50 μL | EQP0163 | ||
| Vortex Genie 2 | EQP0052 | ||
| Vortex Genie 2 | EQP0007 | ||
| Vortex Genie 2 | EQP0132 | ||
| Vortex Genie 2 | EQP0137 | ||
| Vortex Genie 2 | EQP0135 | ||
| Air Clean PCR 工作站 | EQP0203 | ||
| 空气清洁PCR工作站 | EQP0096 | ||
| 空气清洁PCR工作站 | EQP0148 | ||
| 空气清洁PCR工作站 | EQP0097 | ||
| QX200 微滴生成仪 | EQP0202 | ||
| QX200 微滴生成仪 | EQP0121 | ||
| 自动液滴生成器 | EQP0179 | ||
| PX1 PCR板封膜机 | EQP0123 | ||
| PX1 PCR板封膜机 | EQP0186 | ||
| C1000 Touch Cycler w/96W FS RM | EQP0120 | ||
| S1000 PCR仪 配96孔白板光学模块 | EQP0174 | ||
| S1000 扩增仪,配备 96 孔白板光学模块 | EQP0173 | ||
| T100梯度PCR仪 | EQP0180 | ||
| T100 Thermal Cycler | EQP0175 | ||
| QX200 微滴读取仪 | EQP0194 | ||
| QX200 微滴读取仪 | EQP0122 |
参考文献
- Ignatiadis, M., Lee, M., Jeffrey, S. S. Circulating Tumor Cells and Circulating Tumor DNA: Challenges and Opportunities on the Path to Clinical Utility. Clin Cancer Res. 21 (21), 4786-4800 (2015).
- Alix-Panabieres, C., Pantel, K. Clinical Applications of Circulating Tumor Cells and Circulating Tumor DNA as Liquid Biopsy. Cancer Discov. , (2016).
- Paxton, A. Is Molecular AP testing in sync with guidelines. CAP Today. , (2014).
- Sacher, A. G., et al. Prospective Validation of Rapid Plasma Genotyping for the Detection of EGFR and KRAS Mutations in Advanced Lung Cancer. JAMA Oncol. , (2016).
- Sozzi, G., et al. Quantification of free circulating DNA as a diagnostic marker in lung cancer. J Clin Oncol. 21 (21), 3902-3908 (2003).
- Oxnard, G. R., et al. Noninvasive detection of response and resistance in EGFR-mutant lung cancer using quantitative next-generation genotyping of cell-free plasma DNA. Clin Cancer Res. 20 (6), 1698-1705 (2014).
- Best, M. G., et al. RNA-Seq of Tumor-Educated Platelets Enables Blood-Based Pan-Cancer, Multiclass, and Molecular Pathway Cancer Diagnostics. Cancer Cell. 28 (5), 666-676 (2015).
- Rodriguez, M., et al. Different exosome cargo from plasma/bronchoalveolar lavage in non-small-cell lung cancer. Genes Chromosomes Cancer. 53 (9), 713-724 (2014).
- Kalluri, R. The biology and function of exosomes in cancer. J Clin Invest. 126 (4), 1208-1215 (2016).
- Mellert, H., et al. Development and Clinical Utility of a Blood-Based Test Service for the Rapid Identification of Actionable Mutations in Non-Small Cell Lung Carcinoma. J Mol Diagn. 19 (3), 404-416 (2017).
- Qin, J., Williams, T. L., Fernando, M. R. A novel blood collection device stabilizes cell-free RNA in blood during sample shipping and storage. BMC Res Notes. 6, 380(2013).
- Chomczynski, P. A reagent for the single-step simultaneous isolation of RNA, DNA and proteins from cell and tissue samples. Biotechniques. 15 (3), 532-537 (1993).
- Kohno, T., et al. Beyond ALK-RET, ROS1 and other oncogene fusions in lung cancer. Transl Lung Cancer Res. 4 (2), 156-164 (2015).
- Takeuchi, K., et al. ROS1 and ALK fusions in lung cancer. Nat Med. 18 (3), 378-381 (2012).
- Rimkunas, V. M., et al. Analysis of receptor tyrosine kinase ROS1-positive tumors in non-small cell lung cancer: identification of a FIG-ROS1 fusion. Clin Cancer Res. 18 (16), 4449-4457 (2012).
- Tsuta, K., et al. RET-rearranged non-small-cell lung carcinoma: a clinicopathological and molecular analysis. Br J Cancer. 110 (6), 1571-1578 (2014).
- Forbes, S. A., et al. COSMIC: somatic cancer genetics at high-resolution. Nucleic Acids Res. 45 (1), 777-783 (2017).
- Salgia, R. Diagnostic challenges in non-small-cell lung cancer: an integrated medicine approach. Future Oncol. 11 (3), 489-500 (2015).
- Cagle, P. T., Raparia, K., Portier, B. P. Emerging Biomarkers in Personalized Therapy of Lung Cancer. Adv Exp Med Biol. 890, 25-36 (2016).
- Vogelstein, B., Kinzler, K. W. Digital PCR. Proc Natl Acad Sci U S A. 96 (16), 9236-9241 (1999).
- Oxnard, G. R., et al. Association Between Plasma Genotyping and Outcomes of Treatment With Osimertinib (AZD9291) in Advanced Non-Small-Cell Lung Cancer. J Clin Oncol. 34 (28), 3375-3382 (2016).
- Reckamp, K. L., et al. A Highly Sensitive and Quantitative Test Platform for Detection of NSCLC EGFR Mutations in Urine and Plasma. J Thorac Oncol. 11 (10), 1690-1700 (2016).
- Yanagita, M., et al. A prospective evaluation of circulating tumor cells and cell-free DNA in EGFR mutant non-small cell lung cancer patients treated with erlotinib on a phase II trial. Clin Cancer Res. , (2016).
- Abbosh, C., et al. Phylogenetic ctDNA analysis depicts early-stage lung cancer evolution. Nature. 545 (7655), 446-451 (2017).
- Chomczynski, P. A reagent for the single-step simultaneous isolation of RNA, DNA and proteins from cell and tissue samples. BioTechniques. 15 (3), 532-534 (1993).
重印与许可
