本方案描述了如何诱导人干细胞来源的回肠单层细胞中M细胞的分化,并介绍了评估其发育的方法。
本文内容
摘要
摘要
肠道中的M细胞(微褶细胞)具有将抗原从顶端肠腔转运至下方的派尔集合淋巴结和固有层的功能,免疫细胞存在于这些区域,因此M细胞对肠道黏膜免疫具有重要作用。目前对M细胞在肠道中如何分化以及M细胞摄取抗原的分子机制仍缺乏全面的认识。这主要是因为M细胞在肠道中属于稀有细胞群体,且现有的M细胞体外模型尚不完善。近年来发现了一种可自我更新的肠道干细胞培养系统,称为类肠体(enteroids),为培养M细胞提供了新的可能。与传统的培养细胞系相比,类肠体具有优势,因其可分化为肠道中存在的多种主要细胞类型,包括杯状细胞、潘氏细胞、肠内分泌细胞和肠上皮细胞。细胞因子RANKL在M细胞发育过程中至关重要,向培养基中添加RANKL和TNF-α可促进回肠类肠体中一部分细胞向M细胞分化。以下方案描述了一种利用人回肠类肠体在transwell上皮极化单层系统中诱导M细胞分化的实验方法。该方法可用于研究M细胞的发育过程及其功能。
引言
M细胞(微褶细胞)是主要存在于肠道滤泡相关上皮(FAE)中的特化肠上皮细胞,该上皮覆盖称为派尔集合淋巴结的小型淋巴组织区域1。M细胞具有短而不规则的顶端微绒毛,其基底外侧部分深陷,使得免疫细胞能够紧邻其细胞体存在2。这种独特的形态使M细胞能够从肠腔的顶端腔隙中摄取抗原,并将其直接递送至下方的免疫细胞2。因此,M细胞在肠道免疫监视中发挥重要作用,但也可能被病原体利用,作为侵入固有层的途径1,2,3,4,5,6,7。
对M细胞的研究受到多种因素的阻碍。首先,M细胞在小鼠和人类肠道中的分布频率较低8。在细胞培养系统中,可通过将极化的结肠腺癌细胞系Caco-2与来自小鼠派伊尔集合淋巴结的B淋巴细胞或B细胞淋巴瘤细胞系Raji B共培养,诱导产生类似M细胞的细胞9,10。该方法可使部分Caco-2细胞在极化上皮中表达M细胞标志物唾液酸化路易斯A抗原(Sialyl Lewis A antigen)和UEA-19,10。(这些标志物在肠道组织的杯状细胞中也有表达,因此目前较少被用作确定性的M细胞标志物11,12。)该Caco-2-M细胞系统已被用于研究颗粒摄取和细菌转运过程13,14。然而,Caco-2细胞系源自结肠腺癌,属于已建立的细胞系,其局限性在于不同实验室所使用的Caco-2细胞来源可能存在表型差异15。此外,它们可能无法完全模拟真实M细胞的转录水平,因为缺乏目前已知的M细胞标志物GP2和SpiB的表达16。因此,需要建立更多且更具生理相关性的体外培养模型,以深入研究M细胞的发育过程及其功能。
在过去的十年中,源自肠类器官的肠道模型系统研究领域发展迅速,其基础是最初发现来源于人肠道活检组织的肠干细胞可在培养条件下自我增殖和自我更新17,18。重要的是,从培养基中去除促进干细胞生长的因子后,这些干细胞可分化为肠道中存在的多种细胞类型18。此外,近期研究表明,RANKL-RANK信号通路在肠道M细胞发育过程中具有重要作用19,20。RANK受体属于TNF受体家族,在肠道上皮前体细胞中表达19,而RANKL(RANK受体的配体)则由派尔集合淋巴结中的基质细胞释放20。由于回肠类器官中存在的上皮细胞类型不产生RANKL,因此可通过在培养基中添加RANKL来诱导回肠类器官培养物中的M细胞分化21,22。在培养基中加入TNFα有助于支持回肠类器官中M细胞的发育23。本文描述了利用人回肠类器官衍生的肠上皮单层细胞诱导M细胞分化的实验方法。本方法部分基于以下已有方案的改进21,22,23。
方案
本文所述所有方法均已获得塔夫茨大学机构生物安全委员会(IBC)和机构审查委员会(IRB)的批准。
1. 人回肠类器官来源的单层细胞中诱导M细胞分化
注意:本方案使用源自人体组织活检的回肠类器官。有关如何培养和传代这些细胞的方法,请参考已发表的方案18,24。以下建立单层培养的方法改编自Zou等人的研究24。诱导回肠类器官来源培养物中M细胞分化的方法改编自先前的报道21,22,23。所有操作均在无菌细胞培养超净台中进行,孵育步骤根据说明在超净台或细胞培养孵箱中进行。参见所需的材料表,以准备回肠类器官单层及各种培养基。
- 将回肠类器官在细胞外基质(ECM)中培养 4–10 天(参见材料表)(图 1),具体时间根据其固有生长速率而定,之后接种至Transwell小室中。
- 包被Transwell膜
- 将所需数量的Transwell小室放入24孔板中,形成双室系统。
- 用冰冷的无菌磷酸盐缓冲液(PBS)将ECM稀释25倍,并向每个上室的膜上加入100 µL冰冷的稀释液。
注意:ECM及稀释后的ECM溶液在使用前必须始终保持在冰上。 - 用盖子盖好24孔板,放入37 °C组织培养孵育箱中孵育2小时,使ECM在膜上凝固。
- 2小时后,将板从孵育箱中取出并置于生物安全柜中。使用无菌镊子将每个Transwell小室倒置,轻轻去除残留液体。在收集细胞期间(步骤1.3.1–1.3.11),打开盖子让膜在柜内自然干燥。
- 将回肠类器官解离为单细胞
- 从孵育箱中取出回肠类器官培养板,通过真空抽吸或移液器小心移除每孔中的培养基。
注意:一个含有约100个健康囊状结构的回肠类器官孔足以接种1.5–2个Transwell孔。 - 向含有悬浮于ECM中的回肠类器官的每孔加入500 µL冰上预冷的0.5 mM乙二胺四乙酸(EDTA),以破坏ECM。使用设定为500 µL的P1000移液器剧烈吹打,使ECM破碎,从而将回肠类器官释放到溶液中。为促进ECM溶解,吹打后在4 °C剧烈振荡培养板30分钟。
- 将每孔中的溶液收集至15 mL锥形管中。
注意:为获得最佳单细胞收集效果,每15 mL锥形管最多收集10个孔的溶液。 - 在离心机中以140 × g、4 °C离心5分钟使细胞沉淀。沉淀应可见,但容易脱落,因此通过真空抽吸或移液器缓慢移除上清液。
注意:若担心沉淀和细胞丢失,可使用移液器并将上清液保存在另一管中。 - 为消化紧密连接并使回肠类器官解离为单细胞,将沉淀重悬于每5个在步骤1.3.3中收集的孔加入500 µL室温胰蛋白酶中。使用P1000反复吹打以分散细胞团块,并将管子置于37 °C水浴中孵育5分钟或更短时间。
注意:需优化孵育时间,以确保细胞充分解离但不过度消化导致细胞死亡。在步骤1.3.9中使用台盼蓝染色,以确认胰蛋白酶处理后细胞仍具活性。 - 每500 µL胰蛋白酶中加入1 mL含10%胎牛血清(FBS)的Advanced DMEM/F12培养基以终止胰蛋白酶活性。
- 使用设定为500 μL的P1000移液器,在锥形管壁反复吹打至少50次,进一步将剩余团块解离为单细胞。
- 将40 µm细胞筛置于50 mL锥形管上,加入1 mL含10% FBS的Advanced DMEM/F12培养基润湿细胞筛。将来自15 mL锥形管的单细胞悬液通过细胞筛过滤。用1 mL含10% FBS的Advanced DMEM/F12培养基冲洗细胞筛。
- 将穿过细胞筛的细胞从50 mL锥形管转移至新的15 mL锥形管中。在步骤1.3.10的离心过程中,15 mL锥形管更易观察到细胞沉淀。使用血细胞计数板计数细胞。使用台盼蓝染色确认细胞存活率。通常可观察到>95%的细胞存活率。
- 在计数细胞的同时,将新15 mL管中的细胞在室温下以400 × g离心5分钟。细胞沉淀应可见。小心使用移液器移除上清液,并再次保存上清液以防沉淀脱落。
- 配制补充了10 µM Y-27632的改良完全生长培养基25(MCMGF+培养基)。将细胞沉淀重悬于MCMGF+培养基中,浓度为2.5 × 10⁵ 个细胞/200 μL。有关优化接种细胞数量的说明,请参见讨论部分。
注意:MCMGF+培养基成分为:Advanced DMEM/F12,75% L-Wnt3a条件培养基,10% R-spondin条件培养基,5% Noggin条件培养基,1× B27补充剂,1× N2补充剂,1 mM N-乙酰半胱氨酸,50 ng/mL小鼠重组EGF,500 nM A-8301,10 nM [Leu15]-胃泌素I,10 mM HEPES,2 mM GlutaMAX,以及1×青霉素/链霉素(可选)。 - 确保步骤1.2中制备的ECM包被膜已完全干燥(肉眼观察确认)。用200 μL MCMGF+培养基清洗上室,并向每个上室加入200 μL细胞悬液。
- 向每个下室加入700 μL含10 μM Y-27632的MCMGF+培养基。将培养板置于37 °C、5% CO2的组织培养孵育箱中。
- 培养1天后,移除上室培养基,并更换为200 μL新鲜MCMGF+培养基,以防止多层细胞生长。
- 从孵育箱中取出回肠类器官培养板,通过真空抽吸或移液器小心移除每孔中的培养基。
- 更换培养基
- 当单层细胞融合度达到约80%时(通常在接种后第1–3天),将对照孔的基底外侧培养基更换为分化培养基(DM)(详见步骤1.4.2),或将M细胞诱导孔的基底外侧培养基更换为M细胞诱导培养基(详见步骤1.4.3)。两种条件下均需将上室培养基更换为DM。
注意:DM成分为:Advanced DMEM/F12,5% Noggin条件培养基,1× B27补充剂,1× N2补充剂,1 mM N-乙酰半胱氨酸,50 ng/mL小鼠重组EGF,500 nM A-8301,10 nM [Leu15]-胃泌素I,10 mM HEPES缓冲液,2 mM GlutaMAX,以及1×青霉素/链霉素(可选)。M细胞诱导培养基为DM中添加200 ng/mL RANKL和50 ng/mL TNFα。 - 对于不应含有M细胞的对照孔,向上室加入200 μL DM,向下室加入700 μL DM。
- 为诱导M细胞生成,向上室加入200 µL DM,向下室加入700 µL M细胞诱导培养基。
- 每2天更换一次培养基。对于对照孔,上下室均更换DM;对于M细胞孔,上室更换DM,下室更换M细胞诱导培养基。
注意:在细胞接种后第7天,单层细胞中M细胞已完全诱导生成。
- 当单层细胞融合度达到约80%时(通常在接种后第1–3天),将对照孔的基底外侧培养基更换为分化培养基(DM)(详见步骤1.4.2),或将M细胞诱导孔的基底外侧培养基更换为M细胞诱导培养基(详见步骤1.4.3)。两种条件下均需将上室培养基更换为DM。
2. 通过qRT-PCR验证M细胞分化
注意:请在无菌且无RNA酶的实验台区域进行以下操作。有关qRT-PCR推荐试剂材料的列表,请参见材料表。
- 移除上室和下室中的培养基,用 300 µL 室温 PBS 轻柔清洗上室 2 次。
- 向上室中加入 300 µL Trizol,室温孵育 5 分钟。
注意:使用 Trizol 时应佩戴手套和护目镜,避免接触皮肤,具体操作请遵循制造商说明。 - 同时,为每个孔标记微量离心管,并向每管中加入 700 µL Trizol。
- 用 P1000 移液器轻轻吹打 3 次以收集细胞裂解液,转移至对应的微量离心管中,涡旋振荡 5 秒以混匀。
- 将样品在室温下静置 3 分钟,随后于 -80 °C 保存,最长可保存一个月。
- 按照标准 qRT-PCR 方法进行 RNA 提取、DNase 处理、逆转录及 qRT-PCR 反应。引物列表请参见材料表。
3. 通过免疫荧光验证 M 细胞分化
注意:始终确保将培养板的下室充满 PBS,以保持膜的湿润。该操作在实验台上进行。有关免疫荧光实验推荐材料的列表,请参见材料表。
- 移除上室中的培养基,并用 300 µL 室温 PBS 轻柔清洗 2 次。向上室中加入 100 µL 室温下含 4% 多聚甲醛(PFA)的 PBS 溶液。用铝箔包裹培养板,室温静置 25 分钟。随后移除 4% PFA 溶液。
注意: 4% PFA 应作为危险化学废物妥善处理。 - 用 300 µL 室温 PBS 清洗上室 3 次。此时样品可在 4 °C 下保存最多一个月,待后续染色使用。染色后的样品建议在一周内进行观察,以获得最佳成像质量。
- 将单层细胞与 100 µL 含 5% 牛血清白蛋白(BSA)的 PBS 溶液在室温避光条件下孵育 30 分钟,以封闭单层细胞。
- 在含 1% BSA 的 PBS 中按 1:100 稀释 GP2 一抗溶液,每孔加入 100 µL。室温避光孵育 1 小时,然后移除溶液。
注意: 在进行 GP2 一抗染色前,切勿对单层细胞进行通透处理,因为不进行通透时可实现 M 细胞表面 GP2 的最佳染色效果。 - 用 300 µL 室温 PBS 清洗上室 3 次。
- 在含 1% BSA 和 0.1% Triton 的 PBS 中配制二抗染色溶液:荧光标记的山羊抗小鼠 IgG 按 1:200 稀释,鬼笔环肽(phalloidin)按 1:100 稀释,并加入 DAPI。每孔加入 100 µL,室温避光孵育 30 分钟。
注意: 在此步骤中向二抗染色液中添加 Triton,以实现细胞通透,确保鬼笔环肽染色的准确性。 - 用 300 µL PBS 清洗 3 次。
- 在载玻片上滴加 5 µL 封片液(材料表)。从 24 孔板中取出小室并翻转,用手术刀小心将膜从孔中切割下来。将带有细胞的一面朝上放置于载玻片上的封片液液滴中。在膜的顶部中央再加入 10 µL 封片液,然后盖上盖玻片,使膜被密封在载玻片与盖玻片之间。
- 将载玻片在室温避光条件下干燥 24 小时。染色后的载玻片应在染色后一周内使用共聚焦显微镜进行观察。
结果
在细胞外基质(ECM)中培养的回肠类肠体通过肉眼观察和qRT-PCR分析其相对健康状况和分化状态,以此作为回肠类肠体培养物的质量控制手段,并用于单层培养。未分化的回肠类肠体在ECM中生长时呈现透明且呈囊状的形态,表明含有大量干细胞(图1A)。随着时间推移,在生长培养基中培养的未分化回肠类肠体可能呈现中间表型,部分呈囊状,部分呈不透明状(图1B)。通常情况下,我们的未分化样本更类似于图1B所示,而非图1A。这些中间状态的培养物含有更多的终末分化肠上皮细胞,这可通过肠上皮细胞标志物蔗糖-异麦芽糖酶(sucrase isomaltase, SI)的表达水平来测定;推测腔内脱落的死亡肠上皮细胞使其呈现致密外观。此类中间状态的回肠类肠体可用于单层培养的建立,但需注意,此类培养物中肠道干细胞的数量可能较低,且可能已存在某些分化细胞类型(例如,参见在ECM中培养、形态类似图1B的未分化样本在图2中的qRT-PCR检测结果)。作为对照,在ECM中使用分化培养基培养5天以上的回肠类肠体将呈现均匀变暗且呈叶状的形态,具有此种形态的培养物不适合用于单层培养的接种(图1C)。
干细胞基因和肠细胞分化相关基因的表达可通过qRT-PCR进行分析,这是评估在ECM中培养的回肠类器官健康状态及其接种于Transwell上形成单层后分化能力的另一种方法。LGR5(干细胞基因)、SI(吸收性肠上皮细胞基因)、MUC2(杯状细胞基因)和LYZ(潘氏细胞基因)的表达水平在未分化的回肠类器官培养物(在ECM中培养)与分化后的回肠类器官单层(在有或无RANKL/TNFα条件下)之间进行比较(图2)。尽管不同实验间数值可能存在差异,但单层细胞分化后LGR5的表达应有所下降18,26。通常情况下,在不含RANKL和TNFα的条件下培养至第7天时,已分化的回肠单层细胞中无法检测到LGR5的表达。相反,特定细胞类型分化标志物如SI和MUC2的表达在分化后会增加18。在我们的培养体系中,LYZ的表达在分化后通常会下降。如果用于构建单层的回肠类器官在形态上更接近图1B而非图1A,则分化后肠道分化标志物的上升幅度可能较为有限,因为初始培养物中肠细胞类型具有异质性,且SI和MUC2的基础表达水平较高。然而,通过LGR5表达的减少以及显微镜观察(见下文)仍可确认单层细胞发生了分化。此外,在分化培养基中添加RANKL和TNFα可减轻LGR5表达的下降(图2)。与此同时,SI和MUC2的表达水平相较于未添加RANKL和TNFα的分化条件略低,但仍高于未分化状态。
通过qRT-PCR和免疫荧光检测单层细胞中两种M细胞特异性标志物——细胞表面糖蛋白2(GP2)和转录因子SpiB,以确定M细胞的分化情况21表达 GP2 和 SPIB 在存在RANKL和TNFα的情况下,回肠类器官来源的单层细胞中该分子表达上调,而在未经RANKL和TNFα处理的样本中未检测到其表达(图3)。这些标志物的表达水平也可通过小肠组织样本进行标准化。22(如可获得)。这使得这些M细胞标志物的倍数变化能够与含有M细胞的组织进行比较,而非与不表达这些标志物的对照单层细胞比较,从而实现同一实验室不同实验之间的标准化。M细胞 также可通过免疫荧光检测其表面GP2的表达来鉴定。图4)。通常情况下,在接种后第6至8天,经RANKL和TNFα处理的样本中,于40倍显微镜下观察融合的单层细胞时,每个视野可见1至5个M细胞。图4A-D)。在未经处理的样本中未观察到GP2表达图4E)。XZ 平面的正交视图与鬼笔环肽探针叠加显示,每个细胞周围均有肌动蛋白结构,且 M 细胞顶面表达 GP2图 4F-G该模型重现了人类肠道中M细胞低频出现的特征1,2,8为了纯化和分离M细胞以进行后续研究,可利用GP2表面表达对M细胞进行染色,并通过流式细胞术分选GP2+细胞。
M细胞可结合并转运肠腔中的抗原至上皮下方的免疫细胞2。肠道中产生的分泌型IgA可结合细菌,并能结合M细胞的顶膜表面,从而促进微生物的转运27,28。为了确定本模型中发育的M细胞是否能够结合IgA,将人血清IgA加入上室,孵育1小时后,制备单层细胞进行免疫荧光分析。使用荧光标记的二抗识别人血清IgA的重链,以检测M细胞表面IgA的存在。经IgA处理1小时的M细胞可见IgA结合于其顶膜表面(图5A),而对照孔中仅加入抗IgA二抗的M细胞则无明显信号(图5B)。此外,IgA特异性结合于M细胞的顶膜表面,而在GP2表面染色缺失的细胞上未见结合。另外,M细胞的特征之一是其顶膜表面具有较短且致密的肌动蛋白结构2。为分析本模型中M细胞的形态特征,将回肠类器官来源的单层细胞培养7天后收获,并利用鬼笔环肽对F-肌动蛋白进行免疫荧光分析。使用ImageJ软件计算每个M细胞及其相邻非M细胞的肌动蛋白像素强度(图6A)。结果显示,该模型中GP2阳性的M细胞肌动蛋白强度降低,代表性图像见图6B。总体而言,本回肠类器官来源的单层细胞模型所发育的M细胞具有人类肠道M细胞的典型基因表达特征、形态特征以及部分功能,例如能够结合IgA。
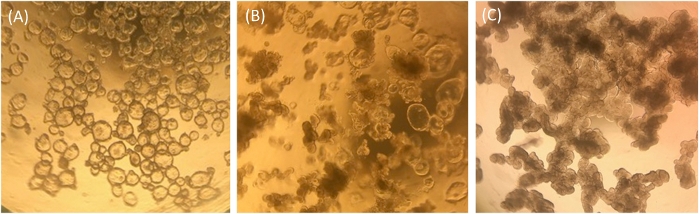
图1:人回肠类器官在ECM中分裂后一周的代表性形态。(A)透明、囊状、未分化的回肠类器官。(B)中间表型,包含部分囊状回肠类器官和部分不透明叶状回肠类器官。(C)变暗且呈叶状的已分化回肠类器官。图像使用iPhone7相机通过光学显微镜镜头在4倍放大倍数下拍摄。请点击此处查看该图的高清版本。
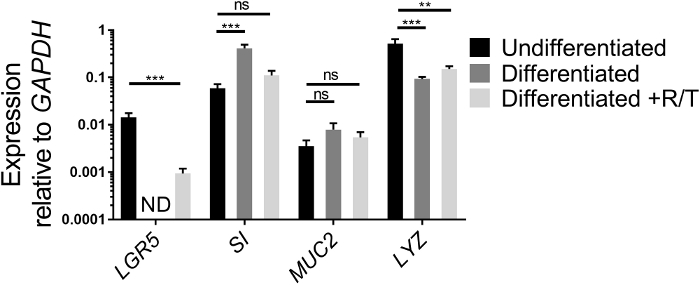
图2:在细胞外基质(ECM)中培养或以单层形式分化的类人回肠类器官中干细胞及分化标志物的相对表达水平。回肠类器官在ECM中培养7天(未分化),或培养并以单层形式分化,无(分化)或含有RANKL和TNFα(分化 +R/T)。回肠类器官培养物或单层细胞用Trizol裂解以提取RNA。基因表达通过qRT-PCR测定,并以GAPDH为参照进行归一化。数据为每种条件下三个独立孔的平均值。误差线表示标准误(SEM)。ND表示未检出。统计学显著性基于对数转换后的数据,采用单因素方差分析(one-way ANOVA)结合Dunnett多重比较检验,与未分化组进行比较。** p < 0.01,*** p < 0.001 请点击此处查看该图的放大版本。
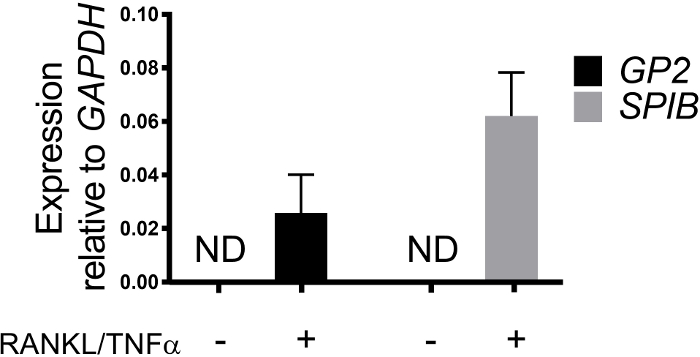
图 3:人回肠类器官来源的单层细胞中 M 细胞特异性标志物 GP2 和 SPIB 的相对表达水平。 经 RANKL/TNFα 处理与未处理的人回肠类器官来源单层细胞在接种后第 7 天用 Trizol 收集,用于 RNA 提取。基因表达通过 qRT-PCR 测定,并以 GAPDH 为参照进行归一化。数据为每种条件下 6 个独立单层细胞的平均值。误差线表示标准误(SEM)。ND 表示未检出。 请点击此处查看该图的放大版本。
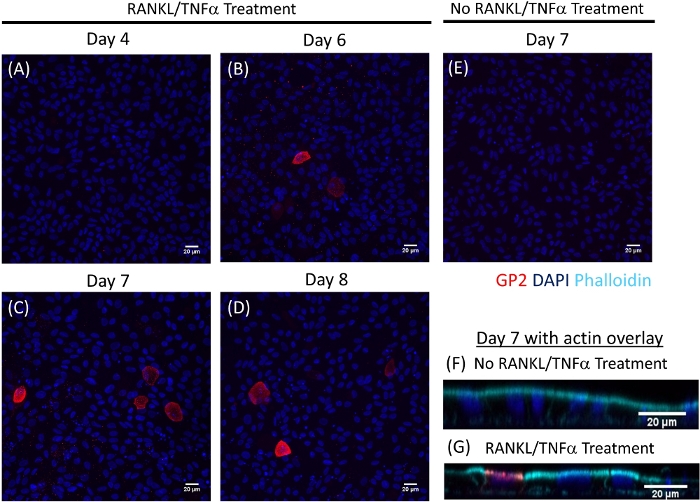
图4:人回肠类器官来源的单层细胞中M细胞表面GP2表达随时间变化的免疫荧光检测。 RANKL/TNFα处理与未处理的人类回肠类器官来源的单层细胞在接种后不同指定时间点用4%多聚甲醛固定,并进行免疫荧光染色。图像使用ImageJ软件分析。DAPI = 蓝色;糖蛋白2(GP2)= 红色。A-D) 不同接种后天数经RANKL/TNFα处理的单层细胞。(E)接种后第7天收获的未经处理的单层细胞。F-G接种后第7天单层细胞的正交XZ平面,叠加了F-肌动蛋白的鬼笔环肽探针染色。鬼笔环肽 = 青色。 请点击此处以查看此图的放大版本。
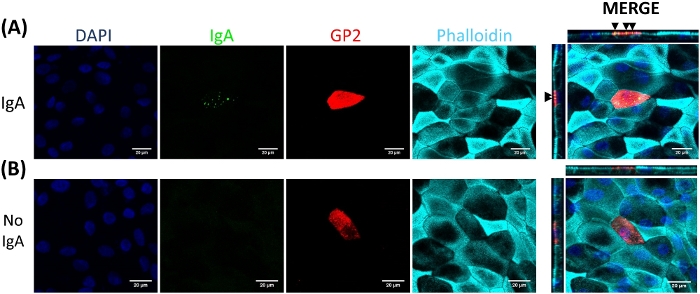
图5:IgA特异性结合M细胞的顶膜表面。经RANKL/TNFα处理的人回肠类器官来源的单层细胞培养7天后,分别进行以下处理:(A)加入10 μg人血清IgA孵育1小时,或(B)仅用PBS模拟处理(无IgA对照)。孵育1小时后,单层细胞用PBS洗涤两次,4%多聚甲醛固定,0.1% TritonX-100透化,随后进行免疫荧光染色。图像使用ImageJ软件分析,结果代表3次独立实验。DAPI = 蓝色;糖蛋白2(GP2)= 红色;抗人血清IgA抗体 = 绿色;鬼笔环肽(Phalloidin)= 青色。黑色箭头指示IgA结合于M细胞顶膜表面。请点击此处查看该图的放大版本。
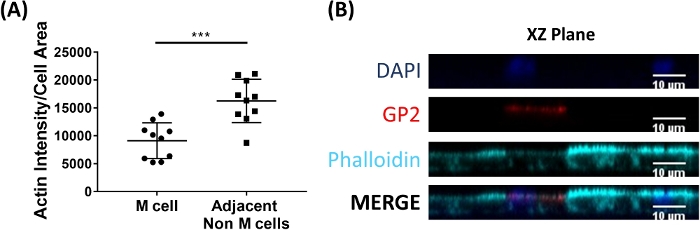
图 6:与相邻的非 M 细胞相比,M 细胞的肌动蛋白强度降低。经 RANKL/TNFα 处理的人回肠类器官来源的单层细胞培养 7 天后,用 4% 多聚甲醛固定,并进行免疫荧光染色。(A)使用 ImageJ 软件,通过自由手选区工具勾勒出 GP2+ M 细胞,并在鬼笔环肽(Phalloidin)通道中测量其面积(Area)和积分密度(Integrated Density)。随后对每个与 M 细胞相邻的非 M 细胞进行相同的分析。将原始积分密度除以各个细胞的面积以进行归一化处理。对每个 M 细胞周围的相邻非 M 细胞分别计算平均积分密度/面积。数据来自 3 次独立实验;每个点代表一个 M 细胞或其邻近细胞的平均值。误差线表示标准差(SD)。统计学显著性通过配对 t 检验对对数转换后的数值进行分析。*** p = 0.0001。(B)A 图中所示 XZ 平面的代表性图像。图像使用 ImageJ 软件进行分析。DAPI = 蓝色;糖蛋白 2(GP2)= 红色;鬼笔环肽(Phalloidin)= 青色。请点击此处查看该图的放大版本。
讨论
为了使单层细胞能够正确分化为肠道主要细胞类型及M细胞,需注意若干关键因素。回肠类器官必须从尚未分化的细胞外基质(ECM)培养物中获取,且其中应含有高比例的Lgr5+干细胞。从形态上看,ECM培养物中的大多数回肠类器官不应呈现深色或多叶状结构,并且应通过qRT-PCR分析检测到这些培养物中存在LGR5的表达。条件培养基的质量控制对于长期维持未分化培养物的扩增至关重要,且每一批新制备的条件培养基都必须进行质量检测。质量控制可通过将新批次的培养基用于部分ECM培养物,并在一周内将其回肠类器官的形态与前一批次培养基中的培养物进行比较来完成。在新批次与前一批次培养基中培养的回肠类器官培养物中,LGR5的表达水平应相对保持一致。
在将回肠类器官接种为单层细胞之前,用胰蛋白酶孵育后必须用力吹打细胞悬液,以将回肠类器官充分解离为单个细胞。细胞团块可能导致单层接种时形成多层结构。此外,必须通过实验确定每种独立的回肠类器官细胞系形成单层所需的细胞数量。通常,该数值范围为每孔 2.5 × 10⁵ – 5.0 × 10⁵ 个细胞,但具体数值取决于培养物中囊状与非囊状回肠类器官的比例,并因不同回肠类器官细胞系而异。根据经验,生长在细胞外基质(ECM)中、形态上囊状特征较少的回肠类器官需要更高的接种密度才能形成单层。建议在接种后第1天,通过轻柔地上下吹吸培养基2–3次,清洗上室,并更换为新鲜的生长培养基。该操作可去除附着在其他细胞上方的细胞,降低形成多层结构的可能性。当单层细胞融合度达到约80%时(通常发生在接种后第2天),将上室的培养基由生长培养基更换为M细胞诱导培养基,有助于实现良好的M细胞分化。在M细胞诱导期间,向上室添加RANKL/TNFα并不会增加每单层M细胞的数量,因此可在上室培养基中省略。本方案中可使用不同孔径的Transwell小室,且不影响M细胞的发育;但对于孔径较大的Transwell小室,必须优化细胞接种密度。可使用IV型胶原蛋白替代ECM作为Transwell或培养板的基底膜蛋白包被材料,这可能更适用于某些特定应用。
在Transwell上培养的回肠类器官来源的单层细胞提供了一个双室系统,可形成明确的顶膜和基底膜表面,使得4-5种不同类型的肠上皮细胞能够极化,并在相对应于肠道生理环境的两侧表达表面标志物。可在任一侧添加其他因子,例如颗粒物、病原体或其他细胞类型。然而,迄今为止该系统仍存在一些局限性。如前所述,该系统为静态系统,缺乏生理性的流体流动、肠道蠕动以及肠内容物。此外,由于形成了平面单层结构,绒毛-隐窝结构已丧失。这些系统中缺乏派尔集合淋巴结区域、免疫细胞和间质细胞。M细胞下方缺乏紧邻的免疫细胞和间质细胞是否会影响本系统中未观察到的凹陷结构及其他生理功能,是未来研究的重要方向。本方案可适配于96孔板或多孔板格式。在96孔板中使用细胞外基质(ECM)包被并接种回肠类器官来源的单个细胞的操作步骤与Transwell系统相同。需要进行细胞接种密度的梯度优化以获得单层结构,通常在96孔板中每孔接种密度为1.0 × 10⁵ – 3.0 × 10⁵ 个细胞。当单层细胞融合度达到约80%时,通常在接种后第1至第3天(取决于初始接种密度),更换为M细胞诱导培养基以诱导M细胞分化。
这种在体外将回肠类器官分化为M细胞的方法相较于Caco-2方法具有显著改进。回肠类器官属于原代细胞,且该系统中至少存在4至5种上皮细胞类型。此外,可研究来自不同个体的回肠类器官系,以探讨遗传因素或疾病状态如何影响M细胞的发育与功能。在M细胞分化过程中对回肠类器官进行进一步操作,将有助于更深入理解M细胞的发育过程,包括对M细胞前体细胞的鉴定。最后,由于M细胞吞噬作用和转胞吞作用的分子机制尚未完全阐明3,29,该模型为研究和可视化M细胞对抗原及颗粒的摄取提供了良好机会。
披露
作者无任何利益冲突需要披露。
致谢
本工作由美国国家过敏与传染病研究所(NIAID)资助,项目编号U19AI131126,资助对象为Isberg博士(塔夫茨大学医学院)和Kaplan博士(塔夫茨大学);JM为该项目第2子课题负责人;另由NIAID R21AI128093项目资助JM。ACF部分由NIAID T32AI007077项目支持。SEB和MKE由NIAID U19AI116497-05项目支持。我们感谢塔夫茨大学医学院Mecsas实验室、Ng实验室以及Isberg博士团队成员提供的有益讨论。 共聚焦成像在塔夫茨神经科学研究中心完成,项目编号P30 NS047243。
材料
| 姓名 | 公司 | 目录编号 | 评论 |
|---|---|---|---|
| [Leu15]-胃泌素 I | Sigma-Aldrich | G9145 | MCMGF+ 和 DM 组分 溶剂:PBS 储存浓度:10 µM 终浓度:10 nM |
| 0.5 M EDTA | Invitrogen | 15575020 | 用于解离细胞外基质(ECM) 溶剂:PBS 储存浓度:0.5 M 终浓度:0.5 mM |
| 40 µm 细胞筛 | Corning | 352340 | 用于去除单细胞悬液中的团块 溶剂: 储存浓度: 终浓度: |
| A-8301 | Sigma-Aldrich | SML0788-5MG | MCMGF+ 和 DM 组分 溶剂:DMSO 储存浓度:500 µM 终浓度:500 nM |
| Advanced DMEM/F12 | Invitrogen | 12634-028 | MCMGF+ 和 DM 基础培养基 溶剂: 储存浓度: 终浓度: |
| Alexa Fluor 594 山羊抗小鼠 IgG | Thermo Fisher | A-11005 | 用于二抗染色 溶剂: 储存浓度: 终浓度:1:200 |
| Alexa Fluor 647 鬼笔环肽 | Invitrogen | A22287 | F-肌动蛋白可选二抗染色 溶剂: 储存浓度: 终浓度:1:100 |
| B27 添加剂 | Invitrogen | 17504-044 | MCMGF+ 和 DM 组分 溶剂: 储存浓度:50x 终浓度:1x |
| 牛血清白蛋白 | Chem-Impex | 00535 | 5% 用于封闭液 溶剂:PBS 储存浓度: 终浓度:0.01 |
| 氯仿 | Fisher Scientific | C298-500 | 用于RNA提取 溶剂: 储存浓度: 终浓度: |
| 圆形盖玻片 | Thomas Scientific | 1157B50 | 用于将膜固定在载玻片上 溶剂: 储存浓度: 终浓度: |
| DAPI (4′,6-二脒基-2-苯基吲哚) | Thermo Fisher | 62247 | 用于二抗染色 溶剂:PBS 储存浓度:100x 终浓度:1x |
| DEPC 处理的无 RNA 酶 H2O | Fisher Scientific | BP561-1 | 用于RNA提取 溶剂: 储存浓度: 终浓度: |
| DNA 去除试剂盒 | Invitrogen | AM1906 | 用于RNA提取 溶剂: 储存浓度: 终浓度: |
| 乙醇,200 proof | Sigma Aldrich | EX0276-4 | 用于RNA提取 溶剂: 储存浓度: 终浓度: |
| Feather 手术刀片 | VWR | 100499-580 | 用于从 transwell 中切割膜 溶剂: 储存浓度: 终浓度: |
| 胎牛血清 (FBS) | Gibco | 26140079 | 用于中和胰蛋白酶 溶剂:Advanced DMEM/F12 储存浓度:1 终浓度:0.1 |
| 载玻片 | Mercedes Scientific | MER 7200/90/WH | 用于将膜固定在载玻片上 溶剂: 储存浓度: 终浓度: |
| GlutaMAX | Invitrogen | 35050-061 | MCMGF+ 和 DM 组分 溶剂: 储存浓度:200 mM 终浓度:2 mM |
| GP2 抗体 | MBL International | D277-3 | M 细胞表面染色 溶剂: 储存浓度: 终浓度:1:100 |
| HEPES | Invitrogen | 15630-080 | MCMGF+ 和 DM 组分 溶剂: 储存浓度:1 M 终浓度:10 mM |
| 人血清 IgA | Lee BioSolutions | 340-12-1 | 用于 M 细胞功能分析 溶剂:PBS 储存浓度:1 mg/mL 终浓度:10 µg |
| L-Wnt3a 条件培养基 | ATCC 细胞系 | CRL-2647 | 参见 ATCC L Wnt3A (ATCC CRL2647) 产品说明书获取条件培养基制备方案;MCMGF+ 组分 溶剂: 储存浓度: 终浓度:MCMGF+ 中占 75% DM 中为 0% |
| Matrigel,GFR,无酚 | Corning | 356231 | 细胞外基质 (ECM) 溶剂: 储存浓度: 终浓度: |
| 小鼠重组 EGF | Invitrogen | PMG8043 | MCMGF+ 和 DM 组分 溶剂:PBS 储存浓度:50 µg/mL 终浓度:50 ng/mL |
| N2 添加剂 | Invitrogen | 17502-048 | MCMGF+ 和 DM 组分 溶剂: 储存浓度:100x 终浓度:1x |
| N-乙酰半胱氨酸 | Sigma-Aldrich | A9165-5G | MCMGF+ 和 DM 组分 溶剂:H2O 储存浓度:500 mM 终浓度:1 mM |
| Noggin 条件培养基 | 由阿姆斯特丹大学 Gijs van den Brink 博士赠送的细胞系 | 参见文献30获取条件培养基制备方案;MCMGF+ 和 DM 组分 溶剂: 储存浓度: 终浓度:MCMGF+ 中占 5% DM 中占 5% | |
| 多聚甲醛 (PFA) | MP Biomedicals | 2199983 | 用于固定单层细胞 溶剂:PBS 储存浓度:0.16 终浓度:0.04 |
| PBS,无 Mg,无 Ca | Corning | MT21040CV | 0.5 mM EDTA 的溶剂 溶剂: 储存浓度: 终浓度: |
| 青霉素/链霉素 | Invitrogen | 15140-122 | MCMGF+ 和 DM 可选组分 溶剂: 储存浓度:100x 终浓度:1x |
| Prolong Gold | Invitrogen | P36930 | 抗荧光淬灭封片液 溶剂: 储存浓度: 终浓度: |
| Qiagen RNeasy 试剂盒 | Qiagen | 74106 | 用于RNA提取 溶剂: 储存浓度: 终浓度: |
| 重组人 RANKL | Peprotech | 310-01 | 用于诱导 M 细胞 溶剂:H2O 储存浓度:0.1 mg/mL 终浓度:200 ng/mL |
| 重组小鼠 TNFα | Peprotech | 315-01A | 用于诱导 M 细胞 溶剂:H2O 储存浓度:5 mg/mL 终浓度:50 ng/mL |
| R-spondin 条件培养基 | Trevigen 细胞系 | 3710-001-01 | 参见 Trevigen Cultrex Rspo1 细胞产品手册(HA-R-Spondin1 293T 细胞系)获取条件培养基制备方案;MCMGF+ 组分 溶剂: 储存浓度: 终浓度:MCMGF+ 中占 10% DM 中为 0% |
| 二抗抗人 IgA 抗体 | Jackson Immuno Research | 109-545-011 | 用于二抗染色 溶剂: 储存浓度: 终浓度:1:200 |
| Super Script IV 逆转录酶 | Thermo Fisher | 18091200 | 用于将 RNA 转化为 DNA 溶剂: 储存浓度: 终浓度: |
| Transwell 插件,24 孔规格 | Greiner Bio-One | 662641 | 0.4 µm 孔径 溶剂: 储存浓度: 终浓度: |
| TritonX-100 | Sigma-Aldrich | T8787 | GP2 一抗染色时无需使用 溶剂:1% BSA 储存浓度: 终浓度:0.001 |
| TRIzol | Invitrogen | 15596018 | 用于RNA提取 溶剂: 储存浓度: 终浓度: |
| TrypLE Express | Invitrogen | 12605010 | 用于将类肠体消化为单细胞 溶剂: 储存浓度: 终浓度: |
| Y-27632 | Sigma-Aldrich | Y-0503 | 第 0 天 MCMGF+ 组分 溶剂:H2O 储存浓度:5 mM 终浓度:10 µM |
| GAPDH 正向引物 | CATGAGAAGTATGACAACAGCCT | ||
| GAPDH 反向引物 | AGTCCTTCCACGATACCAAAGT | ||
| GP2 正向引物 | CAATGTGCCTACCCACTGGA | ||
| GP2 反向引物 | ATGGCACCCACATACAGCAC | ||
| LYZ 正向引物 | CGCTACTGGTGTAATGATGG | ||
| LYZ 反向引物 | TTTGCACAAGCTACAGCATC | ||
| MUC2 正向引物 | ATGCCCTTGCGTCCATAACA | ||
| MUC2 反向引物 | AGGAGCAGTGTCCGTCAAAG | ||
| SI 正向引物 | TCCAGCTACTACTCGTGTGAC | ||
| SI 反向引物 | CCCTCTGTTGGGAATTGTTCTG | ||
| SPIB 正向引物 | CAGCAGCCGCTTTTAGCCAC | ||
| SPIB 反向引物 | GCATATGCCGGGGGAACC | ||
| LGR5 正向引物 | TCAGTCAGCTGCTCCCGAAT | ||
| LGR5 反向引物 | CGTTTCCCGCAAGACGTAAC |
参考文献
- Kraehenbuhl, J. P., Neutra, M. R. Epithelial M cells: differentiation and function. Annual Review of Cell and Developmental Biology. 16, 301-332 (2000).
- Neutra, M. R., Frey, A., Kraehenbuhl, J. P. Epithelial M cells: gateways for mucosal infection and immunization. Cell. 86 (3), 345-348 (1996).
- Nakamura, Y., Kimura, S., Hase, K. M. cell-dependent antigen uptake on follicle-associated epithelium for mucosal immune surveillance. Inflammation and Regeneration. 38, 15(2018).
- Clark, M. A., Hirst, B. H., Jepson, M. A. M-cell surface beta1 integrin expression and invasin-mediated targeting of Yersinia pseudotuberculosis to mouse Peyer's patch M cells. Infection and Immunity. 66 (3), 1237-1243 (1998).
- Jensen, V. B., Harty, J. T., Jones, B. D. Interactions of the invasive pathogens Salmonella typhimurium, Listeria monocytogenes, and Shigella flexneri with M cells and murine Peyer's patches. Infection and Immunity. 66 (8), 3758-3766 (1998).
- Jones, B. D., Ghori, N., Falkow, S. Salmonella typhimurium initiates murine infection by penetrating and destroying the specialized epithelial M cells of the Peyer's patches. Journal of Experimental Medicine. 180 (1), 15-23 (1994).
- Marra, A., Isberg, R. R. Invasin-dependent and invasin-independent pathways for translocation of Yersinia pseudotuberculosis across the Peyer's patch intestinal epithelium. Infection and Immunity. 65 (8), 3412-3421 (1997).
- Ohno, H. Intestinal M cells. Journal of Biochemistry. 159 (2), 151-160 (2016).
- Kerneis, S., Bogdanova, A., Kraehenbuhl, J. P., Pringault, E. Conversion by Peyer's patch lymphocytes of human enterocytes into M cells that transport bacteria. Science. 277 (5328), 949-952 (1997).
- Gullberg, E., et al. Expression of specific markers and particle transport in a new human intestinal M-cell model. Biochemical and Biophysical Research Communications. 279 (3), 808-813 (2000).
- Giannasca, P. J., Giannasca, K. T., Leichtner, A. M., Neutra, M. R. Human intestinal M cells display the sialyl Lewis A antigen. Infection and Immunity. 67 (2), 946-953 (1999).
- Jang, M. H., et al. Intestinal villous M cells: an antigen entry site in the mucosal epithelium. Proceedings of the National Academy of Sciences of the United States of America. 101 (16), 6110-6115 (2004).
- Beloqui, A., Brayden, D. J., Artursson, P., Preat, V., des Rieux, A. A human intestinal M-cell-like model for investigating particle, antigen and microorganism translocation. Nature Protocols. 12 (7), 1387-1399 (2017).
- Martinez-Argudo, I., Jepson, M. A. Salmonella translocates across an in vitro M cell model independently of SPI-1 and SPI-2. Microbiology. 154 (Pt 12), 3887-3894 (2008).
- Lee, J. B., et al. Quantitative analysis of lab-to-lab variability in Caco-2 permeability assays. European Journal of Pharmaceutics and Biopharmaceutics. 114, 38-42 (2017).
- Mabbott, N. A., Donaldson, D. S., Ohno, H., Williams, I. R., Mahajan, A. Microfold (M) cells: important immunosurveillance posts in the intestinal epithelium. Mucosal Immunology. 6 (4), 666-677 (2013).
- Sato, T., et al. Single Lgr5 stem cells build crypt-villus structures in vitro without a mesenchymal niche. Nature. 459 (7244), 262-265 (2009).
- Sato, T., et al. Long-term expansion of epithelial organoids from human colon, adenoma, adenocarcinoma, and Barrett's epithelium. Gastroenterology. 141 (5), 1762-1772 (2011).
- Knoop, K. A., et al. RANKL is necessary and sufficient to initiate development of antigen-sampling M cells in the intestinal epithelium. Journal of Immunology. 183 (9), 5738-5747 (2009).
- Taylor, R. T., et al. Lymphotoxin-independent expression of TNF-related activation-induced cytokine by stromal cells in cryptopatches, isolated lymphoid follicles, and Peyer's patches. Journal of Immunology. 178 (9), 5659-5667 (2007).
- de Lau, W., et al. Peyer's patch M cells derived from Lgr5(+) stem cells require SpiB and are induced by RankL in cultured "miniguts". Molecular and Cellular Biology. 32 (18), 3639-3647 (2012).
- Rouch, J. D., et al. Development of Functional Microfold (M) Cells from Intestinal Stem Cells in Primary Human Enteroids. PloS One. 11 (1), e0148216(2016).
- Wood, M. B., Rios, D., Williams, I. R. TNF-alpha augments RANKL-dependent intestinal M cell differentiation in enteroid cultures. American Journal of Physiology: Cell Physiology. 311 (3), C498-C507 (2016).
- Zou, W. Y., et al. Human Intestinal Enteroids: New Models to Study Gastrointestinal Virus Infections. Methods in Molecular Biology. , (2017).
- Kozuka, K., et al. Development and Characterization of a Human and Mouse Intestinal Epithelial Cell Monolayer Platform. Stem Cell Reports. 9 (6), 1976-1990 (2017).
- Barker, N., et al. Identification of stem cells in small intestine and colon by marker gene Lgr5. Nature. 449 (7165), 1003-1007 (2007).
- Mantis, N. J., et al. Selective adherence of IgA to murine Peyer's patch M cells: evidence for a novel IgA receptor. Journal of Immunology. 169 (4), 1844-1851 (2002).
- Rios, D., et al. Antigen sampling by intestinal M cells is the principal pathway initiating mucosal IgA production to commensal enteric bacteria. Mucosal Immunology. 9 (4), 907-916 (2016).
- Miller, H., Zhang, J., Kuolee, R., Patel, G. B., Chen, W. Intestinal M cells: the fallible sentinels? World Journal of Gastroenterology. 13 (10), 1477-1486 (2007).
- Heijmans, J., et al. ER stress causes rapid loss of intestinal epithelial stemness through activation of the unfolded protein response. Cell Reports. 3 (4), 1128-1139 (2013).
重印与许可
