We have developed a simple and rapid immunocytochemical approach to quantify surface receptor abundance in cultured cells using fluorescence imaging.
Methodenartikel
A Simple and Rapid Immunocytochemical Assay for Quantifying Surface Receptor Abundance in Cultured Cells
* These authors contributed equally
In diesem Artikel
Zusammenfassung
Zusammenfassung
Synaptic transmission is a fundamental process through which neurons communicate. This mechanism involves the release of neurotransmitters—such as GABA, glutamate, and norepinephrine—via exocytosis from presynaptic axon terminals. These neurotransmitters are recognized by specific receptors, including GABAR, AMPAR, and β₂AR, located on the dendritic spine membranes of postsynaptic neurons. The receptors are highly dynamic on the plasma membrane. Conventional immunocytochemical techniques label only the total expression of receptors (Simultaneously labeling all receptors on the membrane surface and within the cells) in cultured cells. Although this provides valuable information for assessing receptor abundance, it does not allow for a precise comparison of whether the number of receptors located on the cell membrane surface has changed. Here, we introduce a method for labeling plasma membrane receptors in neuronal cells using surface immunocytochemistry. By selecting antibodies that specifically recognize the extracellular domain of the receptor, receptors on the cell membrane surface can be labeled outside the intact, impermeable cell membrane.
Einleitung
Synaptic transmission is a fundamental mechanism unique to neuronal cells. In this process, neurotransmitters are released from the presynaptic axon terminal and bind to specific receptors on the postsynaptic membrane, thereby transmitting signals and integrating neurons into highly complex and interconnected neural circuits1,2. Within the presynaptic active zone, synaptic vesicles package neurotransmitters and are transported to the presynaptic membrane with the assistance of specific vesicular transport proteins, which vary depending on the neurotransmitter3,4. These vesicles subsequently release their contents into the synaptic cleft through exocytosis. The released neurotransmitters then bind to receptors on the postsynaptic membrane, transducing the chemical signals into electrical signals to complete information transfer5,6. Because dysregulation of synaptic transmission contributes to the pathogenesis of various neuropsychiatric disorders, investigating its regulatory mechanisms is essential for developing targeted therapeutics7,8,9,10,11.
Conventional immunocytochemical staining assays allow observation of overall expression levels and subcellular localization of target proteins, but cannot capture the dynamics of real-time surface receptors. The fluorescence recovery after photobleaching (FRAP) technique, based on time-lapse imaging of living cells, can be used to evaluate receptor mobility near the cell membrane; however, it requires a relatively complex experimental setup, including an imaging system capable of maintaining cell culture conditions and supporting FRAP. Immunomagnetic bead-based purification of cell membrane components is another method that can quantitatively assess receptor abundance on the cell membrane; however, it cannot evaluate receptor abundance at specific locations within complex cellular structures, such as neuronal dendrites. Here, we used a surface receptor-labeling technique based on immunocytochemistry to quantify receptor transport events in neuronal cells, enabling specification of receptor localization within the cell. This method can also be used to label cell-surface proteins. The straightforward workflow of this approach facilitates monitoring of synaptic transmission and membrane protein trafficking.
Protokoll
1. Preparations for live cell staining
- Cell preparation
- Before the experiment, ensure that cells are seeded onto glass coverslips in multiwell plates—for example, use circular coverslips with a diameter of 12 mm and a thickness of 0.13–0.16 mm in a 24-well plate.
NOTE: This protocol is optimized based on the characteristics of different cell types and their extracellular environments. (e.g., cell lines may be imaged using Hanks' balanced salt solution, whereas primary neurons require extracellular solutions specifically formulated for neuronal cells, such as a buffer composed of 4 mM KCl, 150 mM NaCl, 10 mM HEPES, 1 mM MgCl₂, 2 mM CaCl₂, and 10 mM glucose, pH 7.40, Osm 315 mOsm/kg). - Experimental reagents
- Prepare all solutions required for the staining procedure (see the Table of Materials).
- Before the experiment, ensure that cells are seeded onto glass coverslips in multiwell plates—for example, use circular coverslips with a diameter of 12 mm and a thickness of 0.13–0.16 mm in a 24-well plate.
- Experimental apparatus and software
- Set the cell culture incubator to 37 °C under a 5% CO₂ atmosphere and allow it to stabilize fully before use.
- Set a temperature-controlled water bath to 37 °C and prepare it for use.
- Have a confocal microscope capable of Z-stack imaging ready, along with its operating software and ImageJ.
2. Live-cell immunofluorescence staining
- Dilute the antibodies against the extracellular region of the target protein to a working concentration of 2 µg/mL using wash buffer I.
- Remove the cell culture plate from the incubator and quickly wash the cells once with wash buffer I.
- Add the antibody working solution to the cells (e.g., add 350 µL of the working solution to each well of the 24-well plate). Place the cell culture plate in the CO₂ incubator at 37 °C and incubate for 15 min to allow the antibodies to bind freely to the receptors.
- Remove the antibody working solution and quickly wash the cells for 2 x 30 s with wash buffer I.
NOTE: Wash buffer I should be preheated to 37 °C before use. It is recommended to use a negative-pressure pump to rapidly remove the liquid, thereby increasing the speed of solution replacement. - Add 4% paraformaldehyde at room temperature to each well, then immediately place the cell culture plate on ice and fix the cells for 5 min.
CAUTION: For safety, all experimental steps following the use of paraformaldehyde will be conducted in a fume hood. After completion, collect the paraformaldehyde in a designated waste container for centralized disposal. - Remove the 4% paraformaldehyde and quickly wash the cells 2 x 30 s with wash buffer I at room temperature.
- Incubate the cells with blocking buffer I for 45 min at room temperature.
- Dilute the secondary antibodies (e.g., goat anti-mouse Alexa Fluor 488) to a working concentration of 2 µg/mL using blocking buffer I. Remove the blocking buffer and incubate the cells with the antibody solution for 45 min at room temperature.
- Remove the antibody solution, quickly rinse the cells once with wash buffer I, and then wash them 2 x 3 min with wash buffer I.
NOTE: If the cellular boundary is already demarcated by a fluorescent protein or another stain, proceed directly to step 2.17. - Add 4% paraformaldehyde to each well and fix for 10 min at room temperature.
- Remove the 4% paraformaldehyde, add 0.3% Triton X-100, and incubate the cells for 10 min at room temperature to permeabilize.
- Remove the Triton X-100 solution and incubate the cells with the blocking buffer for 45 min at room temperature.
- Dilute the antibodies (e.g., MAP2) to a working concentration of 2 µg/mL using blocking buffer II. Then, remove the blocking buffer and incubate the cells with the working solution for 16 h at 4 °C.
- Remove the antibody working solution, immediately wash the cells once with wash buffer II, and then wash them 2 x 3 min with wash buffer II.
- Dilute the secondary antibodies (e.g., goat anti-rabbit-Alexa Fluor 647) to a working concentration of 10 µg/mL using blocking buffer II. Then, remove the blocking buffer and incubate the cells with the working solution for 45 min at room temperature.
- Repeat Step 2.14.
- Mount the coverslip onto a glass slide using a sealing agent. Allow the slide to dry overnight at room temperature in the dark before imaging.
3. Image acquisition and analysis
- Using a confocal microscope, locate the appropriate field of view under the objective lens (e.g., using the 100× oil objective [NA 1.40] of the confocal microscope for image acquisition; the collected image size is 1,024 × 1,024 pixels and the pinhole is set to 1 AU). Turn on the Z-axis scanning mode and rotate the fine focus screw to record the upper and lower edges of the cell separately (using the point at which the fluorescence signal of the cell body marker is nearly invisible as the boundary). Perform automated layer-by-layer scanning and save the scanning files.
- To prepare images for presentation, open the acquired files in either the associated confocal software (e.g., LAS X) or ImageJ/Fiji. Extract individual optical sections from the Z-stack.
Ergebnisse
Membrane surface receptor labeling and imaging in primary neurons
The experiments described above were performed in cultured mouse primary neurons, in which surface-localized GABAA receptors were labeled. In parallel, neuronal cell bodies and dendrites were visualized by immunostaining with an anti-MAP2 antibody. Representative images reveal distinct staining patterns for GABAA receptors under different conditions. In non-permeabilized neurons (Figure 1B, top two rows), labeling is predominantly at the cell edge, characterized by a punctate distribution. This indicates that cell membrane integrity was well preserved during the labeling process, with no labeling of GABAA receptors from the intracellular pool. By contrast, upon permeabilization (Figure 1B, bottom two rows), abundant punctate signals are observed throughout the intracellular compartment in addition to the cell surface membrane, suggesting that both intercellular and surface GABAA receptors were labeled. Consequently, the relative level of surface receptors on the cell membrane, as well as the size and fluorescence intensity of individual clusters, can be readily quantified. The specificity of the secondary antibody was confirmed using a control experiment (Supplemental Figure S1).
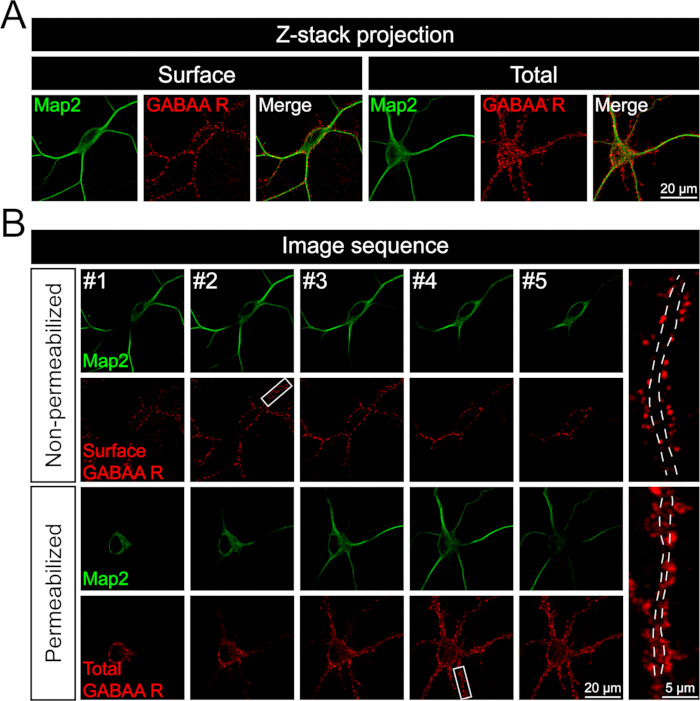
Figure 1. Representative immunofluorescence images showing surface localization and total pools of GABAA receptors in mouse primary neurons. (A) Maximum intensity projection images from Z-stack scans showing surface staining (left) and total staining (right) of GABAA receptors. MAP2 immunostaining was used to visualize the cell morphology. Intracellularly GABAA receptors are not detected under surface staining conditions. (B) Representative single optical sections (frames) from Z-stacks showing surface staining (top two rows, the GABAA receptor signals in all frames are characterized by a punctate distribution along the edge of the cell membrane contour) and total staining (bottom two rows, the characteristic of the GABAA receptor signal is that it is filled with the cytoplasm of the cell and the dendritic branches in all frames). Please click here to view a larger version of this figure.
Supplemental Figure S1. Validation of secondary antibody specificity. Representative immunofluorescence images showing staining obtained using a primary antibody (anti-IBA1) and fluorescent secondary antibody. DAPI labels nuclei (blue), and IBA1 signal is shown in red. The merged image and higher-magnification region (ROI) demonstrate specific signal localization with minimal background. These data support the specificity of the secondary antibody and the absence of detectable non-specific binding under the staining conditions used. Abbreviation: ROI = region of interest. Please click here to download this file.
Diskussion
The proposed protocol enables accurate quantification of protein expression at the cell membrane. From a functional perspective, the total expression level of membrane receptors does not necessarily correlate with their functional activity5. Functional receptors on the cell membrane surface must be inserted into the membrane so that their extracellular domains can interact with ligands and thus perform their functions. Therefore, the abundance of receptors on the cell membrane surface reflects the relative number of functional receptors, and selective detection of cell surface expression is particularly important. This approach provides a feasible and reliable means of evaluating the relative functional strength of receptors using immunocytochemistry. It is worth noting that this method is particularly suitable for studying processes involving the insertion and removal of cell surface receptors. However, to compare the functional integrity of receptors, it is necessary to experimentally verify the subunit composition of receptors on the cell membrane and the efficiency of signal transduction, rather than relying solely on quantifying the number of receptors at the membrane surface for comparison.
The main advantage of this method is its ability to provide precise analysis at specific subcellular locations, such as primary or secondary dendritic branches of neurons; this advantage is not offered by techniques such as FRAP or membrane component purification. However, this method also has limitations. It does not allow direct visualization of receptor transport, as FRAP does. Furthermore, it requires antibodies that specifically recognize the extracellular domain of the target receptor (e.g., GABA-A receptor α1 monoclonal antibody and GluR1 monoclonal antibody, which are commonly used to detect classical membrane surface receptors in neuronal cells); however, readily available antibodies with such specific binding are not always obtainable for all receptors of research interest.
In studies of synaptic transmission, particularly those investigating the trafficking of postsynaptic receptors such as GABARs, AMPARs, or NMDARs, this method provides a simple and effective approach for quantitatively assessing receptor abundance on the cell surface or specifically within dendrites9,10. This protocol can also be extended to studies investigating changes in membrane receptor expression following pharmacological interventions, such as chemically induced long-term potentiation or long-term depression in cultured neurons.
In protocol step 2.5, the temperature of the fixative is particularly critical. The fixative must be at room temperature when applied to the cells, followed by fixation on ice. Adherence to this step is essential for ensuring the validity of the experimental results. The reliability of the protocol can also be verified during imaging with a laser-scanning confocal microscope by confirming the absence of positive signals inside the cell membrane.
Overall, this immunocytochemical-based membrane protein labeling approach simplifies the study of membrane surface proteins—particularly processes such as receptor endocytosis and membrane insertion—in biomedical research. It also provides a practical platform for the screening and development of membrane protein–targeting drugs, with the potential for rapid and high-throughput screening.
Offenlegungen
The authors have no conflicts of interest to disclose.
Danksagungen
This work was supported by the National Natural Science Foundation of China (82504878 and 82474218), and China Postdoctoral Science Foundation (2025M783897, 2024M752181).
Materialien
| Name | Unternehmen | Katalognummer | Kommentare |
|---|---|---|---|
| 4% paraformaldehyde | Leagene biotechnology | DF0135 | ICC |
| B-27 Plus neuronal culture system | Thermo Fisher | A3653401 | Cell culture |
| BSA | Solarbio life sciences | A8021 | ICC |
| CaCl2 | Sigma | C7902 | ICC |
| Confocal microscopy | Leica | STELLARIS 8 STED Falcon | ICC |
| Coverslips | Solarbio life sciences | YA0782 | Cell culture |
| Fluoromount-G | SouthernBiotech | 0100-01 | ICC |
| Glucose | Sigma | G6152 | ICC |
| Goat anti-Mouse IgG (H+L) Highly Cross-Adsorbed Secondary Antibody, Alexa Fluor Plus 555 | Thermo Fisher | A32727 | ICC |
| Goat anti-Rabbit IgG (H+L) Highly Cross-Adsorbed Secondary Antibody, Alexa Fluor Plus 488 | Thermo Fisher | A32731 | ICC |
| Mouse anti-GluR1 | Sigma | MAB2263 | ICC |
| Mouse anti-IBA1 | Synaptic Systems-234 011 | ||
| HEPES | Sigma | H4034 | ICC |
| KCl | Sigma | P9541 | ICC |
| MgCl2 | Sigma | M2670 | ICC |
| Mouse anti-GABA-A receptor | Synaptic Systems | 224 211 | ICC |
| NaCl | Sigma | S3014 | ICC |
| PBS | Gibco | 20012 | ICC |
| Rabbit anti-MAP2 | Cell signal technology | 8707T | ICC |
| Triton X-100 | Sigma | 93443 | ICC |
| Tween-20 | Sigma | P1379 | ICC |
| Solutions, buffers | |||
| Wash buffer I | extracellular buffer or artificial cerebrospinal fluid (ACSF) | ||
| Wash buffer II | phosphate-buffered saline (PBS) containing 0.1% Tween-20 (PBST) | ||
| Blocking buffer I | PBS with 5% bovine serum albumin (BSA) and 5% goat serum | ||
| Blocking buffer II | PBST with 5% BSA and 5% goat serum | ||
| fixative solution | 4% paraformaldehyde | ||
| cell membrane permeabilization agent | 0.3% Triton X-100 in PBS |
Referenzen
- Lewis, S. Closer encounters. Nat Rev Neurosci. 19 (1), 5-5 (2017).
- Li, S. A., Sheng, Z. H. Energy matters: presynaptic metabolism and the maintenance of synaptic transmission. Nat Rev Neurosci. 23 (1), 4-22 (2022).
- Bolz, S., Haucke, V. Biogenesis and reformation of synaptic vesicles. J Physiol. 603 (20), 5965-5979 (2025).
- Yan, Z., Rein, B. Mechanisms of synaptic transmission dysregulation in the prefrontal cortex: pathophysiological implications. Mol Psychiatry. 27 (1), 445-465 (2021).
- Betz, W. J., Wu, L. G. Synaptic transmission. kinetics of synaptic-vesicle recycling. Curr Biol. 5 (10), 1098-1101 (1995).
- Goda, Y., Sabatini, B. L. Synaptic function and regulation. Curr Opin Neurobiol. 21 (2), 205-207 (2011).
- Chen, Z. P., et al. GABA-dependent microglial elimination of inhibitory synapses underlies neuronal hyperexcitability in epilepsy. Nat Neurosci. 28 (7), 37(2025).
- Zhang, C. C., Zhu, L. X., Shi, H. J., Zhu, L. J. The role of vesicle release and synaptic transmission in depression. Neuroscience. 505, 171-185 (2022).
- Lau, C. G., Zukin, R. S. NMDA receptor trafficking in synaptic plasticity and neuropsychiatric disorders. Nat Rev Neurosci. 8 (6), 413-426 (2007).
- Zott, B., Konnerth, A. Impairments of glutamatergic synaptic transmission in Alzheimer's disease. Semin Cell Dev Biol. 139, 24-34 (2023).
- Bagetta, V., Ghiglieri, V., Sgobio, C., Calabresi, P., Picconi, B. Synaptic dysfunction in Parkinson's disease. Biochem Soc Trans. 38 (2), 493-497 (2010).
Nachdrucke und Genehmigungen
Dieser Artikel wurde veröffentlicht
Video demnächst verfügbar