Dieses Protokoll beschreibt die Erzeugung und phänotypische Charakterisierung eines C57BL/6N-Cracdem1(c.538-83 to c.3352+255 del)-Mausmodells mittels CRISPR/Cas9-Technologie, um die Rolle von CRACD bei der kardialen Remodeling nach Myokardinfarkt zu untersuchen.
Methodenartikel
Generierung und phänotypische Charakterisierung eines mit CRISPR/Cas9 hergestellten Cracd-defizienten Mausmodells für Studien zur Remodelung nach Myokardinfarkt
In diesem Artikel
Zusammenfassung
Zusammenfassung
Myocardial infarction (MI) remains a major cause of morbidity and mortality worldwide. This protocol describes a method for generating and characterizing a Cracd-deficient mouse line on the C57BL/6N background using CRISPR/Cas9 technology. Zygotes were co-injected with Cas9 mRNA, a gRNA construct, and a donor template designed to generate a 3153-bp genomic deletion. The edited allele was confirmed by PCR genotyping and Sanger sequencing. To assess the functional role of CRACD in post-MI remodeling, Cracd-deficient and wild-type (WT, C57BL/6N) mice underwent MI induced by permanent ligation of the left anterior descending coronary artery. On postoperative day 7, cardiac function and left ventricular wall motion were assessed using transthoracic echocardiography and speckle-tracking strain imaging, followed by histopathological evaluation with H&E and Masson's trichrome staining. Representative results showed that Cracd-deficient mice exhibited reduced ventricular dilation and preserved systolic function compared to WT controls. This protocol provides a reliable experimental platform for mechanistic studies of CRACD in cardiac pathophysiology.
Einleitung
Myokardinfarkt (MI) ist weltweit weiterhin eine der Hauptursachen für Morbidität und Mortalität und belastet die globale Herz-Kreislauf-Gesundheit erheblich1. Die Langzeitprognose nach einem MI hängt hauptsächlich vom Prozess der linksventrikulären (LV) Remodellierung ab2, der eine Ventrikeldilatation, Wandverdünnung und interstitielle Fibrose umfasst3,4, welche wesentliche Faktoren für die Progression zur Herzinsuffizienz (HF) darstellen. Die globale Inzidenz von HF, die auf einer kardialen Remodellierung nach MI beruht, verschärft die Belastung durch kardiovaskuläre Erkrankungen zusätzlich5. Trotz dieser gut etablierten klinischen Beobachtungen fehlen systematische Studien, die empfindliche und reproduzierbare In-vivo-Modelle nutzen, um die Rolle spezifischer Gene bei der postinfarktbedingten Remodellierung zu untersuchen. Derzeit existiert kein Protokoll, das ein mittels CRISPR/Cas9 erzeugtes Knockout-Modell mit fortschrittlicher Dehnungsbildgebung kombiniert, um einen zytoskelettalen Regulator wie CRACD zu evaluieren. Daher besteht dringender Bedarf an einer Methode, die eine präzise genetische Modifikation und eine hochauflösende kardiale Phänotypisierung ermöglicht.
Der Capping-Protein-hemmende Regulator der Aktindynamik (CRACD), auch bekannt als KIAA1211, ist ein Regulator der Aktinpolymerisation, der vorwiegend im Cytosol lokalisiert ist und eine entscheidende Rolle in der Dynamik des Cytoskeletts spielt6. Er reguliert die Aktinpolymerisation positiv, indem er an Aktin-Capping-Proteine (CAPZA1, CAPZA2, CAPZB) bindet und dadurch verhindert, dass diese an die barbierten Enden der Aktinfilamente binden7. In epithelialen Geweben spielt CRACD eine entscheidende Rolle bei der Aufrechterhaltung der Zellmorphologie und der Signaltransduktion, indem er die Integrität des Aktincytoskeletts bewahrt8,9. In Tumorzellen ist eine Fehlregulation von CRACD mit einer verstärkten Metastasierung und Proliferation der Zellen assoziiert6,10. Die Rolle von CRACD im Herzen ist bisher nicht vollständig verstanden. Kardiale Transkriptom- und experimentelle Interventionsstudien zeigen, dass die Genexpression von Cracd auf pathologischen Stress reagiert und möglicherweise Gene reguliert, die mit der Cytoskelettdynamik während des ventrikulären Remodelings in Verbindung stehen9,11. Darüber hinaus ist das hemmende Protein CapZ eng mit kardialer Pathologie verknüpft: Die Phosphorylierung von CapZ reguliert das Wachstum von Myofibrillen während der durch Phenylephrin induzierten Hypertrophie12. Unsere früheren Untersuchungen deuten darauf hin, dass eine moderate Herunterregulierung von CRACD einen Schutz vor myokardialem Schaden bietet und die Kontraktilität der Myofilamente nach akuter Ischämie erhält13. Diese Befunde legen die Möglichkeit nahe, dass CRACD eine Rolle bei maladaptiven ventrikulären Remodeling-Prozessen nach einem Myokardinfarkt (MI) spielt. Systematische in-vivo-Verlust-an-Funktion-Studien, die testen, ob ein Cracd-Mangel das Remodeling nach einem MI beeinflusst, fehlten bisher jedoch weitgehend, hauptsächlich aufgrund des Fehlens eines validierten Schritt-für-Schritt-Protokolls zur Erzeugung und Phänotypisierung einer Cracd-defizienten Maus unter ischämischem Stress.
Es existieren mehrere Ansätze zur Erzeugung konstitutiver Knockout-Mäuse. Die traditionelle homologe Rekombination in embryonalen Stammzellen (ES-Zellen) ist präzise, jedoch kostspielig, zeitaufwändig (12–18 Monate) und auf bestimmte Mausstämme beschränkt14. Die ENU-(N-Ethyl-N-nitrosarn)mutagenese erzeugt zufällige Punktmutationen, die umfangreiches Rückkreuzen und Sequenzieren erfordern15. Im Gegensatz dazu bietet CRISPR/Cas9 deutliche praktische Vorteile für diese Studie: (i) die direkte Injektion in Zygote verkürzt die Zeitspanne auf 4–6 Monate; (ii) sie ermöglicht die Deletion eines großen genomischen Fragments (3153 bp), um einen vollständigen Funktionsverlust sicherzustellen; (iii) sie wirkt direkt auf dem C57BL/6N-Hintergrund, ohne dass ein Stammwechsel erforderlich ist; und (iv) sie verzichtet auf einen selektierbaren Marker, wodurch unbeabsichtigte transkriptionelle Störungen minimiert werden. Daher ist CRISPR/Cas9 die effizienteste Methode, um eine Cracd-defiziente Linie zu erzeugen, die sich für routinemäßige kardiovaskuläre Phänotypisierung eignet. Diese Technologie wurde bereits häufig für präzise in vivo-Funktionsverluststudien verwendet16,17.
Die Bildgebung mittels Speckle-Tracking-Dehnungsanalyse ist eine Nachbearbeitungstechnik, die die Bewegung natürlicher akustischer Speckles im Myokard bildweise verfolgt und dadurch die Berechnung myokardialer Deformationsparameter wie Dehnung (relativer Längenänderung) und Dehnungsgeschwindigkeit (Verformungsrate) ermöglicht18. Im Gegensatz zur konventionellen M-Modus- oder zweidimensionalen Echokardiographie, die globale Funktionsparameter liefert (Auswurfsvolumen, Fractional Shortening, interner Durchmesser des linken Ventrikels) und relativ unempfindlich gegenüber regionalen Wandbewegungsstörungen ist, kann die Dehnungsanalyse die segmentale Kontraktionsfunktion quantifizieren. Dies ist besonders in der frühen Phase nach einem Infarkt von Bedeutung, in der eine kompensatorische Hyperkinese nicht infarktbedingter Segmente die globale Ejektionsfraktion trotz signifikanter regionaler Dysfunktion aufrechterhalten kann. Das Speckle-Tracking bietet mehrere Vorteile gegenüber herkömmlichen Endpunkten: Es liefert segmentale Werte für Dehnung und Dehnungsgeschwindigkeit sowie für Verschiebung und Geschwindigkeit und ermöglicht so den Nachweis subtiler, subklinischer Veränderungen19; es kann Dysynchronie und frühe kontraktile Defizite erkennen, bevor irreversible Umbauprozesse eintreten; und es untersucht direkt das subendokardiale Myokard, die am stärksten durch Ischämie gefährdete Schicht20. In dieser Studie ist CRACD ein zytoskelettaler Regulator, der möglicherweise die Myofibrillen-Kontraktilität auf mikroskopischer Ebene beeinflusst. Herkömmliche, auf Hohlraumgrößen basierende Messungen könnten solche lokalen mechanischen Effekte leicht übersehen. Daher verbessert die Integration der Speckle-Tracking-Analyse in dieses Protokoll die Fähigkeit, frühe protektive Effekte des Cracd-Defizits nachzuweisen. Folglich stellt die Einbindung des Speckle-Trackings in dieses Protokoll ein empfindliches und quantitatives Werkzeug zur Beurteilung des postinfarktbedingten Umbaus dar, insbesondere während der ersten Woche nach dem Myokardinfarkt, wenn sich frühe Dilatation und kontraktile Dysfunktion zeigen21,22.
Dieses Protokoll ist für Forscher konzipiert, die den funktionellen Einfluss einer spezifischen Genlöschung auf die akute (7-Tage-)Remodellierung nach Myokardinfarkt mithilfe einer Kombination aus konstitutivem Knockout und hochauflösender Bildgebung untersuchen. Es eignet sich für hypothesengenerierende Studien, bei denen ein globaler Verlust des Zielgens akzeptabel ist und der primäre Endpunkt in frühen systolischen Funktionen und strukturellen Veränderungen liegt. Es sollten jedoch mehrere Einschränkungen berücksichtigt werden. Erstens handelt es sich beim Cracd-defizienten Mausmodell um einen globalen Knockout; daher können beobachtete kardioprotektive Effekte nicht ausschließlich auf den Verlust von CRACD in Kardiomyozyten zurückgeführt werden, da auch systemische Beiträge eine Rolle spielen könnten. Zukünftige Studien mit bedingten Knockout-Strategien werden notwendig sein, um eine herzspezifische Deletion zu erreichen. Zweitens konzentriert sich das Protokoll auf einen einzigen Zeitpunkt (Tag 7) und berücksichtigt weder die chronische Remodellierung noch den Fortschritt einer Herzinsuffizienz. Längsschnittstudien über die akute Phase hinaus werden erforderlich sein. Drittens erfordert die Ultraschall-Speckle-Tracking-Analyse hochwertige Bilder (klare endokardiale Grenzen) sowie spezielle Software, die möglicherweise nicht in allen zentralen Einrichtungen verfügbar ist. Trotz dieser Einschränkungen bietet das Protokoll eine robuste und reproduzierbare Plattform für die erste funktionelle Charakterisierung von Genen, die an der kardialen Remodellierung nach Myokardinfarkt beteiligt sind.
In dieser Studie sollte das CRISPR/Cas9-System genutzt werden, um ein Cracd-defizientes Mausmodell (C57BL/6N-Cracdem1 (c.538-83 to c.3352+255 del)) zu erzeugen und zu validieren, um die Auswirkungen eines Cracd-Defizits auf die kardiale Remodellierung und die Ventrikelfunktionsbewegung nach einem Myokardinfarkt (MI) zu untersuchen. Bei sowohl wildtypischen (WT, C57BL/6N) als auch Cracd-defizienten Mäusen wurde ein Myokardinfarkt induziert, und eine umfassende Bewertung erfolgte eine Woche nach dem Infarkt. Die Untersuchungen umfassten konventionelle echokardiographische Parameter, die Strain-Analyse mittels Speckle-Tracking sowie eine histopathologische Beurteilung. Besonderes Augenmerk lag auf der frühen postinfarktbedingten Phase (Tag 7), um die initialen Remodellevents zu erfassen und festzustellen, ob das Cracd-Defizit die ventrikuläre Dilatation und die systolische Funktion während der akuten MI-Phase beeinflusst. Die Ergebnisse sollen wertvolle Erkenntnisse über die Rolle von CRACD bei der Modulation einer nachteiligen kardialen Remodellierung nach einem Myokardinfarkt liefern.
Protokoll
All animal experiments were approved by the Institutional Animal Care and Use Committee of the Guangdong Institute of Biotechnology (Approval No. IACUC2025179). The study utilized 20 SPF Cracd-deficient and 20 age- and weight-matched WT mice. All mice were 10–12 weeks old and weighed 20–25 g. All male animals were housed in an AAALAC-accredited facility (License No. SYXK (Yue) 2016-0122) at the Guangdong Institute of Biotechnology (Guangdong Laboratory Animals Monitoring Institute). The housing environment was maintained at 22–25 °C with 50–70% relative humidity under a 12 h light/12 h dark cycle.
1. Generation of Cracd-deficient mice using CRISPR/Cas9
- Use CRISPR/Cas9 gene editing technology to generate Cracd-deficient mice on a C57BL/6N background. Delete the genomic sequence from c.538-83 to c.3352+255 (partial intron 5 to intron 6) of Cracd by homology-directed repair.
NOTE: The mouse Cracd gene (NCBI RefSeq: NM_001163793.1; Ensembl: ENSMUSG00000036377) is located on chromosome 5 and contains 9 exons, with the ATG start codon in exon 2 and the TAA stop codon in exon 9. - Design the sequence of gRNA targeting vector and donor oligonucleotide (with targeting sequence flanked by 120 bp homologous sequences combined on both sides).
- Log in to the NCBI website, select the Primer-BLAST function, and design PCR primers for genotyping.
- Paste the NCBI reference sequence number of Cracd (NM_001163793.1) into the PCR template field, specify the exon range for amplification, and click “Get Primers” to retrieve multiple pairs of candidate primers for PCR-based detection of the deletion and wild-type alleles.
- Design single-guide RNAs (gRNAs) to target sites flanking the intended deletion interval in the Cracd gene.
- Select four gRNA sequences (20 nt upstream of the PAM) using online CRISPR design tools.
- To minimize potential off-target effects, score the candidate gRNAs with CRISPRater and select the two optimal sequences (including the NGG PAM).
NOTE: Example selected sequences:
gRNA-A1: CGGCGCTCTTAACATCCAGAGGG (score: 0.71)
gRNA-A2: CCCTTCAGTCTGGGTAGTAGAGG (score: 0.71)
Accept gRNAs with a CRISPRater score ≥ 0.5. For in vitro validation, accept gRNAs with > 50% cleavage efficiency in a Cas9/gRNA target efficiency detection kit.
- Design a single-stranded donor oligonucleotide to promote efficient joining of the intended breakpoints. Example donor sequence: TTAACCATCAACGGGCCGCTGCAAGGGCTGCTGT
GTCTATA CTCAGGACCACCTGCCCTCTAGAGGCAGGAAGGT
AGAGTTCCAAGCTCTGCTGTGCTAGGTTAAATGCAACTTAACATC. - Co-inject Cas9 mRNA, gRNA and donor oligonucleotide into fertilized eggs to generate Cracd-deficient mice. Prepare Cas9 mRNA and gRNA by in vitro transcription.
- Preparation of gRNA.
- Transcribe gRNAs in vitro from DNA templates using the MEGAshortscript™ T7 transcription kit (see Table of Materials) following the manufacturer's protocol.
- Purify the transcribed gRNAs using an RNA purification kit (see Table of Materials) and elute them in RNase-free water.
- Assess gRNA cleavage activity using an in vitro Cas9/gRNA target efficiency detection kit (see Table of Materials).
- Perform all RNA preparation steps on ice using RNase‑free consumables (pipette tips, tubes, water). Keep RNA samples on ice at all times to prevent degradation.
- To perform the cleavage assay: mix the transcribed gRNA (25 ng/µL) with recombinant Cas9 protein (50 ng/µL) and a PCR-amplified DNA fragment containing the target sequence (50 ng).
- Incubate the reaction at 37 °C for 30 min.
- Run the products on a 2% agarose gel to visualize uncleaved and cleaved bands.
- Calculate cleavage efficiency as the ratio of cleaved band intensity to total (cleaved + uncleaved) band intensity.
- Accept gRNAs with > 50% cleavage efficiency.
- Preparation of Cas9 mRNA.
- Thaw the reagents from the T7 ARCA mRNA Kit (see Table of Materials).
- At room temperature, combine 10 µL of 2× ARCA/NTP mix, 1 µL of template DNA, 2 µL of T7 RNA polymerase mix, and nuclease-free water to 20 µL.
- Mix thoroughly, pulse-spin in a microfuge (5 s at 5000 × g), and incubate at 37 °C for 30 min.
- Remove the template DNA by adding 2 µL of DNase I (1 U/µL), mix well, and incubate at 37 °C for 15 min to obtain Cas9 mRNA. Optionally add 1 µL of RNase inhibitor (40 U/µL) (see Table of Materials) to the reaction to prevent RNA degradation.
- Perform all steps on ice with RNase‑free consumables. Keep the Cas9 mRNA on ice until use.
- Superovulate 4-week-old C57BL/6N female mice by intraperitoneal injection of 5 IU of pregnant mare serum gonadotropin (PMSG), followed 48 h later by 5 IU of human chorionic gonadotropin (hCG).
CAUTION: PMSG and hCG are hormones that may cause skin sensitization. Wear gloves and dispose of needles in a sharps container. - Approximately 14–18 h after hCG injection, euthanize the C57BL/6N female mice and one 8–12-week-old C57BL/6N male mouse by cervical dislocation. Collect oocytes from the oviducts of the females and sperm from the cauda epididymis of the male.
CAUTION: Euthanasia must be performed in accordance with institutional guidelines. Cervical dislocation should only be performed by trained personnel. - Capacitate the sperm in capacitation medium (see Table of Materials).
- Add a small volume of the sperm suspension to the oocytes for in vitro fertilization and co-culture for 3–4 h at 37 °C to obtain fertilized zygotes.
- Dilute the transcribed gRNA and Cas9 mRNA with RNase-free water to working concentrations (typically 25 ng/µL for gRNA and 50 ng/µL for Cas9 mRNA) and donor oligonucleotide at 10 ng/µL.
- Microinject 1–2 pL of the mixture into the cytoplasm of fertilized zygotes using a microinjection system (see Table of Materials).
- Identify healthy zygotes by the presence of two distinct pronuclei and an intact polar body under a stereomicroscope.
- Transplant 300 healthy fertilized zygotes into the oviducts of pseudopregnant female mice that have been mated with vasectomized males.
NOTE: This results in the generation of 2 positive founder mice (F0). - Use RNase‑free water and ice‑cold conditions during dilution to maintain RNA integrity.
- Identify F0 mice by PCR genotyping of tail biopsies (see section 1.6).
- Breed F0 founders with WT mice to generate F1 heterozygous offspring, to obtain germline transmission of the deletion.
- Intercross heterozygous F1 mice to produce F2 homozygous Cracd-deficient mice.
- Preparation of gRNA.
- Genotype by Polymerase Chain Reaction (PCR)
NOTE: The following protocol uses a commercial TIANamp Genomic DNA Kit (see Table of Materials). Buffer GL is the lysis buffer, Buffer GB is the binding buffer, and Buffer WA and Buffer WB are wash buffers.- Place approximately 2–5 mm of mouse tail tissue in a microcentrifuge tube containing 180 µL of Buffer GL, 20 µL of Proteinase K (20 mg/mL stock solution), and 10 µL of RNase A (10 mg/mL stock solution).
- Incubate the sample at 56 °C overnight to digest the tissue.
- Centrifuge the tube at 13800 × g for 2 min at room temperature to pellet tissue debris and transfer the supernatant to a new tube.
- Add 200 µL of Buffer GB and 200 µL of 100% ethanol to the supernatant, mix thoroughly, and apply the mixture to a spin column placed in a collection tube.
- Centrifuge at 13800 × g for 2 min at room temperature and discard the flow-through.
- Add 500 µL of Buffer WA to the column, centrifuge at 13800 × g for 1 min at room temperature and discard the flow-through.
- Carefully add 700 µL of Buffer WB (wash buffer containing ethanol, pre-mixed with 100% ethanol) to the spin column, centrifuge at 13800 × g for 1 min at room temperature and discard the flow-through.
- Apply Buffer WB to the inner wall of the column to wash residual salts.
- Repeat step 1.6.5 once, then transfer the column into a new collection tube and centrifuge at 13800 × g for 2 min at room temperature to dry the membrane and remove residual ethanol.
- Place the column into a new 1.5 mL microcentrifuge tube. Add 50–200 µL of sterilized water or elution buffer (preheated to 65 °C) to the center of the membrane, incubate for 5 min.
- Centrifuge the column at 13800 × g for 2 min at room temperature to elute the DNA.
- To increase DNA yield, either reapply the flow-through to the membrane or add an additional 50–200 µL of sterilized water, incubate for 5 min.
- Perform a final centrifugation at 13800 × g for 2 min.
NOTE: Expect DNA yield of 50–200 ng/µL from tail tissue; A260/A280 ratio of 1.8–2.0 indicates pure DNA.
- Place approximately 2–5 mm of mouse tail tissue in a microcentrifuge tube containing 180 µL of Buffer GL, 20 µL of Proteinase K (20 mg/mL stock solution), and 10 µL of RNase A (10 mg/mL stock solution).
- Genotyping by multiplex PCR using three primers in a single reaction.
- Design three primers to distinguish WT, heterozygous, and homozygous genotypes in one PCR reaction: Forward primer F1 (5’-CAGAAGTCATAGCAGCAAGGCAG-3’, binds upstream of the deletion), Forward primer F2 (5’-GAGGGAATTGAGAGGGAGCC-3’, binds within the deleted region, present only in the WT allele), and Reverse primer R1 (5’-GCCAATTTAGCTGCTTCAAATGTTC-3’, common reverse primer downstream of the deletion).
NOTE: The targeted allele generates a 421 bp amplicon (F1 + R1) only when the deletion is present; the WT allele generates a 357 bp amplicon (F2 + R1) only when the intact allele is present. - Set up the PCR reaction in a 25 µL total volume containing 50–100 ng genomic DNA, 0.2 µM of each primer (F1, F2, and R1), 200 µM dNTPs, 1.5 mM MgCl₂, and 1 U Taq DNA polymerase (see Table of Materials).
- Use the following thermocycling program: initial denaturation at 95 °C for 3 min; 35 cycles of denaturation at 95 °C for 15 s, annealing at 60°C for 15 s, and extension at 72 °C for 25 s; and a final extension at 72 °C for 5 min.
- Separate the PCR products by 1–2% agarose gel electrophoresis (120 V, 30 min) in 1× TAE buffer.
- Genotype interpretation based on band pattern: WT shows only a 357 bp band (F2+R1); Heterozygous shows both 421 bp (F1+R1) and 357 bp (F2+R1) bands; Homozygous shows only a 421 bp band (F1+R1).
- Design three primers to distinguish WT, heterozygous, and homozygous genotypes in one PCR reaction: Forward primer F1 (5’-CAGAAGTCATAGCAGCAAGGCAG-3’, binds upstream of the deletion), Forward primer F2 (5’-GAGGGAATTGAGAGGGAGCC-3’, binds within the deleted region, present only in the WT allele), and Reverse primer R1 (5’-GCCAATTTAGCTGCTTCAAATGTTC-3’, common reverse primer downstream of the deletion).
2. Myocardial infarction model establishment
- Anesthetize the mice via inhalation of 3% isoflurane (delivered in 100% oxygen at 1 L/min), place them in a supine position on a surgical platform, and confirm deep anesthesia by the absence of pedal withdrawal reflex.
CAUTION: Isoflurane is a volatile anesthetic. Use only in a well-ventilated area or under a fume hood to avoid inhalation. - Perform orotracheal intubation using a 20-gauge intravenous catheter sheath. Apply ophthalmic ointment to both eyes to prevent corneal drying during surgery.
- Connect the tube to a mechanical ventilator upon successful intubation to maintain ventilation and anesthesia with 2% isoflurane.
NOTE: Successful intubation is confirmed by visible chest movements synchronized with the ventilator.
- Connect the tube to a mechanical ventilator upon successful intubation to maintain ventilation and anesthesia with 2% isoflurane.
- Remove hair from the anterior chest with depilatory cream. Disinfect the surgical area by applying povidone-iodine and 70% alcohol in a circular motion for multiple times, starting from the center and moving outward.
- After fully exposing the skin, make a 1–1.5 cm incision in the left chest wall between the 2nd and 3rd intercostal spaces to open the thoracic cavity.
- Incise the pericardium to fully expose the heart.
CAUTION: Surgical procedures must be performed under sterile conditions. Use appropriate personal protective equipment (PPE), including gloves and a surgical mask.
- Using the inferior border of the left auricle as a landmark, pass a 7–0 atraumatic suture needle beneath the left anterior descending coronary artery (LAD) approximately 2–3 mm distal to its origin.
- Pass the needle to a depth of approximately 0.5–1 mm and tighten the ligature slowly to avoid myocardial tearing.
- Confirm successful occlusion by observing pallor (whitening) of the left ventricular anterior wall distal to the ligation site within 30 s.
- In sham-operated controls, open the chest and pass the suture beneath the coronary artery without tying the knot.
- After establishing the model, sequentially suture the ribs (4-0 absorbable suture, simple interrupted pattern) and skin (4-0 absorbable suture, continuous pattern) to close the thoracic cavity. Remove the endotracheal tube once the mouse resumes stable spontaneous breathing.
- Place mice on a heating pad (37 °C) until fully conscious.
- Administer postoperative analgesia (e.g., buprenorphine 0.05–0.1 mg/kg, subcutaneously, every 12 h for 48 h) according to institutional IACUC guidelines and closely monitor the postoperative health status for several days.
NOTE: Monitor for signs of distress (hunched posture, ruffled fur, reduced mobility, weight loss > 20%).
- Administer postoperative analgesia (e.g., buprenorphine 0.05–0.1 mg/kg, subcutaneously, every 12 h for 48 h) according to institutional IACUC guidelines and closely monitor the postoperative health status for several days.
- Mortality and exclusion criteria.
- Record the number of mice that die within the first 7 days after MI surgery.
NOTE: In a typical cohort, expect a mortality rate of approximately 10–20% by postoperative day 7, with no significant difference between WT and Cracd‑deficient mice. Common causes of death include extensive infarction leading to acute heart failure, surgical bleeding, or pneumothorax. Exclude any mouse with persistent arrhythmia (heart rate < 350 bpm) or signs of severe distress (e.g., hunched posture, ruffled fur, weight loss > 20%) from subsequent echocardiographic and histological analyses. For sham‑operated mice, mortality should be < 5%.
- Record the number of mice that die within the first 7 days after MI surgery.
3. Echocardiographic assessment
- Animal Preparation and Anesthesia
- Power on the high-resolution small animal ultrasound imaging system (see Table of Materials) and its integrated heated stage.
- Ensure that the appropriate high-frequency transducer is securely connected to the mounting apparatus following the manufacturer’s instructions. Set the temperature of the heated stage to 37 °C and allow it to stabilize.
- Place mice in an induction chamber and anesthetize them with 3% isoflurane in oxygen (1–2 L/min) until the pedal withdrawal reflex is absent. Transfer anesthetized mice to the heated platform in a supine position.
- Maintain anesthesia with 1–1.5% isoflurane delivered via a nose cone, adjusting to maintain heart rate between 450–550 beats per min.
- Apply ophthalmic ointment to both eyes to prevent corneal drying.
- Shave the thoracic region, evenly apply depilatory cream for no longer than 3 min, then remove the depilatory cream thoroughly with wet gauze.
- Rinse the skin gently with warm saline if necessary and dry the area. Attach surface ECG electrodes to the limbs using electrode gel at the contact sites and secure them with tape.
NOTE: Confirm stable ECG and heart rate within 450–550 bpm before proceeding to ultrasound imaging.
- Power on the high-resolution small animal ultrasound imaging system (see Table of Materials) and its integrated heated stage.
- Conventional Echocardiography Image Acquisition
- Position the mouse in a horizontal, supine posture on the heated stage, with a slight leftward tilt if needed to optimize cardiac imaging.
- Apply a generous amount of pre-warmed ultrasound coupling gel to the hairless left precordial region, avoiding air bubbles.
- Place the transducer gently on the chest wall at the left parasternal position. Adjust its orientation so that the index mark points toward the mouse’s right shoulder and fine-tune the angle and pressure to optimize image quality.
- Switch to B-mode (two-dimensional) imaging, adjust depth, focus zone, and frame rate to obtain a clear parasternal long-axis view of the left ventricle. Acceptable image quality requires clear visualization of the endocardial border with no dropouts.
- Once the heart rate stabilizes (450–550 bpm), acquire three separate parasternal long-axis B-mode cine loops, each containing at least 3–5 consecutive cardiac cycles.
- Save each loop by pressing “Cine Store”, and store representative still frames using “Frame Store”.
- From the long‑axis view, rotate the transducer 90° clockwise to obtain a short‑axis view at the mid‑papillary level.
- Acquire three separate short‑axis B‑mode cine loops (each with ≥ 3–5 cycles).
- Activate M‑mode, position the cursor perpendicular to the interventricular septum and posterior wall, and record three separate M‑mode tracings.
NOTE: Acceptable M‑mode tracings require clear endocardial borders throughout the cardiac cycle.
- Use the VevoLab 3.2.0 software (see Table of Materials) to measure the following parameters from M‑mode tracings according to the American Society of Echocardiography leading‑edge method: interventricular septum thickness at diastole and systole (IVSd, IVSs), left ventricular internal diameter at diastole and systole (LVIDd, LVIDs), and left ventricular posterior wall thickness at diastole and systole (LVPWd, LVPWs).
- Calculate left ventricular ejection fraction (EF) and fractional shortening (FS) using the Teichholz formula: EF (%) = [(LV Vold - LV Vols) / LV Vold] × 100, LV Vold = ((7 / (2.4 + LVIDd)) × LVIDd3), LV Vol;s = ((7 / (2.4 + LVIDs)) × LVIDs3), FS (%) = [(LVIDd – LVIDs) / LVIDd] × 100.
NOTE: For each mouse, measurements were averaged from three consecutive cardiac cycles per M‑mode recording, and the average was taken across three separate recordings, resulting in a total of 9 measurements per parameter per mouse.
- Calculate left ventricular ejection fraction (EF) and fractional shortening (FS) using the Teichholz formula: EF (%) = [(LV Vold - LV Vols) / LV Vold] × 100, LV Vold = ((7 / (2.4 + LVIDd)) × LVIDd3), LV Vol;s = ((7 / (2.4 + LVIDs)) × LVIDs3), FS (%) = [(LVIDd – LVIDs) / LVIDd] × 100.
- Position the mouse in a horizontal, supine posture on the heated stage, with a slight leftward tilt if needed to optimize cardiac imaging.
- Speckle-Tracking Strain Analysis
- Perform speckle-tracking analysis using the dedicated analysis software (VevoStrain module within VevoLab 3.2.0).
- Open a clear parasternal long-axis B-mode cine loop, select "Vevo Strain" to enter the strain analysis mode, retain only complete cardiac cycles, and choose "Long Axis".
- Manually trace the endocardial border at the end‑diastolic frame. After the endocardial border is drawn, the software automatically generates an epicardial border (adjust as needed). Then start the strain analysis and activate the "toggle contour/vector/orbit line/B mode" function to visualize the motion trajectory.
- Assess tracking quality via the colour‑coded mesh: it should appear green, closely follow the endocardial and epicardial borders without jerking, and move synchronously with myocardial contraction/relaxation. If not, manually refine the borders and re‑analyze.
- Activate "Time‑to‑peak analysis" to divide the left ventricle into six segments (basal anterior, mid anterior, apical anterior, apical posterior, mid posterior, basal posterior), with each colour representing an individual segment. Once satisfactory tracking is achieved, export data for wall motion parameters: velocity (cm/s), displacement (cm), strain (%), strain rate (1/s) for both longitudinal and radial.
NOTE: If tracking quality remains poor after three acquisition attempts (e.g., erratic strain curves, or inability to visualise clear motion trajectories), exclude the mouse from strain analysis.
- Perform speckle-tracking analysis using the dedicated analysis software (VevoStrain module within VevoLab 3.2.0).
4. Histopathological analysis
- After echocardiography, administer a lethal dose of isoflurane to deeply anesthetized mice and apply a secondary physical method (e.g., cervical dislocation) according to institutional guidelines.
- Open the thoracic cavity, rapidly harvest the hearts and rinse the hearts gently in cold phosphate-buffered saline (PBS).
CAUTION: Euthanasia must be performed according to institutionally approved protocols.
- Open the thoracic cavity, rapidly harvest the hearts and rinse the hearts gently in cold phosphate-buffered saline (PBS).
- Trim the hearts, remove the great vessels and cut transversely from apex to base into 2–3 slices (approximately 2–3 mm thick).
- Immerse the tissue slices in 4% paraformaldehyde in PBS and fix them at 4 °C for 12–24 h.
NOTE: Use a volume ratio of fixative to tissue of at least 10:1.
CAUTION: Paraformaldehyde is toxic and a suspected carcinogen. Handle in a fume hood and wear appropriate PPE (gloves, lab coat, safety goggles). Dispose of paraformaldehyde waste as hazardous chemical waste according to institutional guidelines.
- Immerse the tissue slices in 4% paraformaldehyde in PBS and fix them at 4 °C for 12–24 h.
- Dehydrate tissue through a graded ethanol series (50%, 70%, 80%, 95%, 100% ethanol, each for 1 h), clear them in xylene (2 changes, 30 min each), embed them in paraffin, and section them at 4–5 µm thickness using a microtome.
NOTE: Sections should be free of folds and tears.
CAUTION: Xylene is flammable and toxic. Use only in a fume hood and avoid skin contact. Collect xylene waste in a designated container and dispose of as hazardous chemical waste. - Deparaffinize the sections in xylene (2 changes, 5–10 min each), rehydrate them through descending ethanol series (100%, 95%, 80%, 70%, each for 3 min) to water.
- Stain them using standard Hematoxylin and Eosin (H&E) (see Table of Materials) and Masson’s trichrome protocols (see Table of Materials).
CAUTION: Xylene is toxic. Use only in a fume hood and avoid skin contact. Dispose of xylene waste as hazardous material.
- Stain them using standard Hematoxylin and Eosin (H&E) (see Table of Materials) and Masson’s trichrome protocols (see Table of Materials).
- Examine the stained sections under a light microscope (see Table of Materials).
- For quantitative analysis, capture digital images at 4×, 20×, and 40× magnification using a digital camera attached to the microscope. Measure infarct size and fibrotic area using ImageJ.
NOTE: Infarct size (%) = (infarct area / total LV area) × 100; collagen content (%) = (blue-stained area / total myocardial area) × 100.
- For quantitative analysis, capture digital images at 4×, 20×, and 40× magnification using a digital camera attached to the microscope. Measure infarct size and fibrotic area using ImageJ.
Ergebnisse
Generation of Cracd-deficient mice
A heritable mouse model carrying a targeted deficiency in the Cracd gene was generated using CRISPR/Cas9-mediated genome editing (Figure 1A, Figure 1B). To distinguish WT, heterozygous, and homozygous genotypes, a multiplex PCR was performed using three primers (F1, F2, R1) in a single reaction. Mice homozygous for the deletion (Cracd‑deficient) displayed only the 421 bp band, WT mice showed only the 357 bp band (Figure 1C). Sanger sequencing of genomic DNA from Cracd-deficient mice confirmed the predicted deletion in the target gene compared to WT controls (Figure 1D). Western blot analysis further demonstrated a marked reduction in CRACD protein levels in cardiac tissues from Cracd-deficient mice compared with WT controls (Figure 1E). Together, these data confirm the successful establishment of the Cracd-deficient mouse line.
Echocardiography
Echocardiographic assessment on postoperative day 7 revealed pronounced pathological cardiac remodeling in WT mice after MI (WT-MI) compared with sham-operated controls (Figure 2A). The WT-MI group showed thinning of the interventricular septum (Figure 2B, C), significant left ventricular (LV) dilation as reflected by increased LVIDd (Figure 2D) and LVIDs (Figure 2E), and thinning of the posterior wall (Figure 2F, G). These structural alterations were associated with a pronounced decline in global systolic function, as demonstrated by significantly reduced EF (Figure 2H) and FS (Figure 2I). In contrast, Cracd-deficient mice displayed a cardioprotective phenotype following MI. LV dilation was significantly attenuated, with notably smaller LVIDd and LVIDs compared with the WT-MI group. Furthermore, these mice exhibited improved systolic thickening of the posterior wall and maintained significantly higher EF and FS values. These findings indicate that Cracd deficiency effectively attenuates post-infarction LV dilation and preserves global systolic function.
Speckle-tracking strain analysis
Left ventricular myocardial motion and deformation were further evaluated by speckle‑tracking echocardiography using only parasternal long‑axis views (Figure 3A). To ensure data reliability, we defined pragmatic criteria for acceptable output based on the capabilities of the VevoStrain software. Acceptable strain analysis required: (i) a clear parasternal long‑axis view with endocardial borders visible throughout the cardiac cycle; (ii) a stable heart rate between 450–550 bpm during acquisition; (iii) after automatic tracking, the colour‑coded mesh (activated via “toggle contour/vector/orbit line/B mode”) had to closely follow the endocardial and epicardial borders without jerking or losing contact; and (iv) strain curves had to be smooth, show consistent waveforms across segments, and lack sudden spikes or arrhythmic interruptions. Suboptimal output—most commonly erratic strain curves or inability to visualise clear motion trajectories—led to manual adjustment of endocardial or epicardial contours and re‑analysis. If quality remained poor after three attempts, the mouse was excluded. Using these criteria, we obtained reliable strain data in WT‑MI mice and Cracd‑deficient MI mice.
Compared with the sham group, WT-MI mice exhibited significantly reduced radial velocity (Figure 3B) and longitudinal velocity (Figure 3C), as well as radial displacement (Figure 3D) and longitudinal displacement (Figure 3E), indicating impaired global myocardial motion. The absolute values of radial strain (Figure 3F), radial strain rate (Figure 3G), longitudinal strain (Figure 3H), and longitudinal strain rate (Figure 3I) were also markedly decreased, reflecting severely compromised regional myocardial deformation and function. In contrast, Cracd-deficient mice showed significant improvement in these parameters. Compared with the WT-MI group, they displayed better recovery of radial and longitudinal displacements. Furthermore, radial velocity, radial strain, and radial strain rate were maintained at higher levels, while longitudinal strain and longitudinal strain rate were significantly improved. These results suggest that Cracd deficiency not only preserves global systolic function but also enhances regional LV myocardial deformation after MI.
The speckle‑tracking imaging analysis also included visualization of segmental strain distribution and cardiac motion trajectories. Parasternal long‑axis B‑mode images with segmented six regions (BA, MA, AA, AP, MP, BP) and color gradient mapping are displayed in Figure 4A. Cardiac motion trajectories, time‑to‑peak curves for radial and longitudinal strain, parametric distribution maps of strain synchrony, and three‑dimensional reconstructions are presented in Figure 4B. These data further support the functional improvements observed in Cracd‑deficient mice.
Histological examination
To assess the protective effect of Cracd deficiency against MI, histopathological examination was performed on heart sections from WT and Cracd-deficient mice at 7 days post-MI using H&E and Masson's trichrome staining. Whole‑heart longitudinal sections are shown in Figure 5A, with quantitative analysis of infarct size and collagen content presented in Figure 5B and Figure 5C, respectively. High‑magnification views of the infarct zone, border zone, and remote zone are displayed in Figure 5D. In WT-MI hearts, H&E staining showed pronounced left ventricular wall thinning and a well-demarcated infarct zone. Within the infarct region, extensive inflammatory cell infiltration, myocardial necrosis, and marked fibrosis with scar formation were observed. In the border zone, inflammatory infiltration, myocardial necrosis, fibrosis and cardiomyocyte hypertrophy were evident, while the remote zone displayed prominent hypertrophic changes. Corresponding Masson's trichrome staining further demonstrated extensive interstitial fibrosis within both the infarct and border zones of WT hearts following MI. In contrast, Cracd-deficient mice exhibited substantially attenuated pathological alterations, including reduced wall thinning, diminished inflammatory infiltration and myocardial necrosis, less pronounced cardiomyocyte hypertrophy, and markedly decreased interstitial fibrosis compared with WT-MI hearts. These histological findings indicate that Cracd deficiency mitigates post-infarction myocardial damage and adverse remodeling.
Successful protocol execution should yield: (i) a well‑demarcated infarct zone with extensive collagen deposition in WT-MI hearts; (ii) clear cellular morphology without staining artifacts; and (iii) significantly attenuated pathology in Cracd‑deficient MI hearts. Although infarct size may vary with ligation precision, the genotype‑dependent difference is a reliable indicator of successful performance.
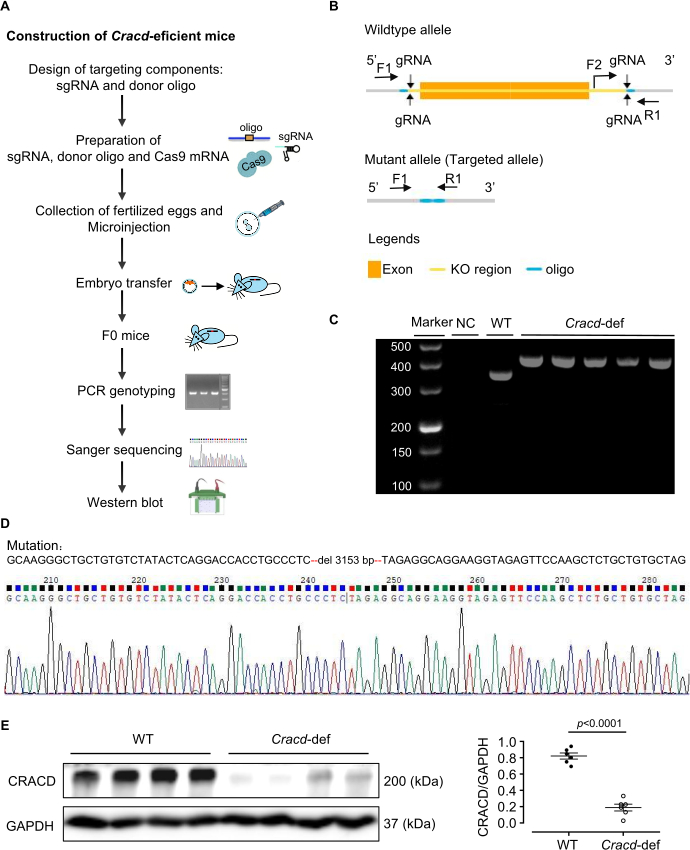
Figure 1: Generation of Cracd-deficient mice. (A) Construction of Cracd-deficient mice. (B) Schematic of the Cracd gene modification strategy. (C) PCR genotyping of tail genomic DNA. WT mice show a single 357 bp band, while homozygous (Cracd‑deficient) mice show a single 421 bp band. (D) Sanger sequencing of genomic DNA confirmed the predicted deletion in the Cracd locus of deficient mice compared to WT controls. (E) Western blot analysis showed significantly reduced CRACD protein levels in the hearts of Cracd-deficient mice compared to WT controls. n = 6 mice per group. Data are presented as mean ± SEM. Statistical significance was calculated with a two-tailed unpaired Student's t-test. Please click here to view a larger version of this figure.
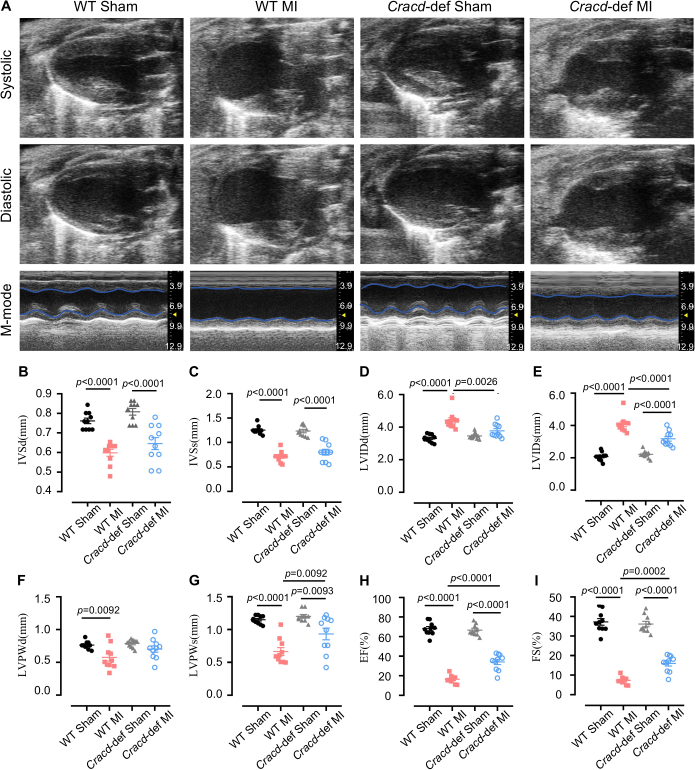
Figure 2: Echocardiographic assessment of cardiac function. (A) Representative B-mode and M-mode echocardiographic images of mouse hearts at diastole and systole. Quantitative analysis of (B) interventricular septum thickness at diastole (IVSd) and (C) systole (IVSs), (D) left ventricular internal diameter at diastole (LVIDd) and (E) systole (LVIDs), (F) left ventricular posterior wall thickness at diastole (LVPWd) and (G) systole (LVPWs), (H) ejection fraction (EF), and (I) fractional shortening (FS). n = 10 mice per group. Data are presented as mean ± SEM. Statistical significance was determined by one-way ANOVA followed by Tukey's multiple comparisons test. Please click here to view a larger version of this figure.
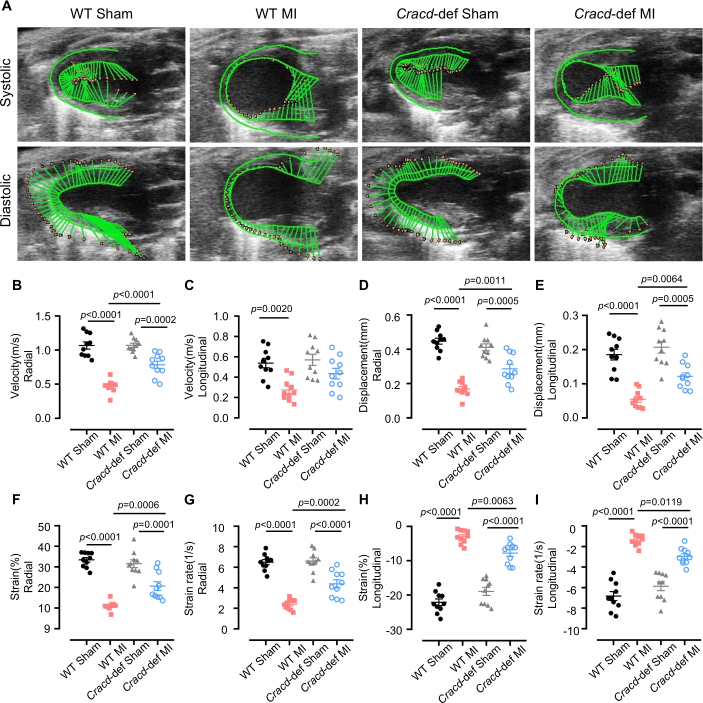
Figure 3: Speckle-tracking strain analysis. (A) Representative images of left ventricular wall motion and deformation at diastole and systole. Quantitative analyses of the following parameters: (B) radial velocity, (C) longitudinal velocity, (D) radial displacement, (E) longitudinal displacement, (F) radial strain, (G) radial strain rate, (H) longitudinal strain, and (I) longitudinal strain rate. n = 10 mice per group. Data are presented as mean ± SEM. Statistical significance was determined by one-way ANOVA followed by Tukey's multiple comparisons test. Please click here to view a larger version of this figure.
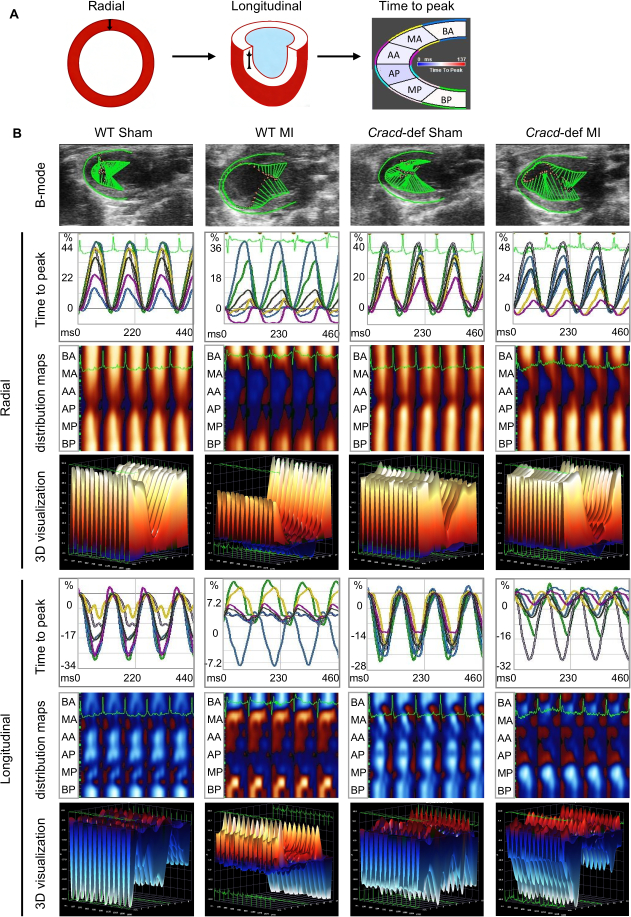
Figure 4: Speckle-tracking imaging in WT-Sham, WT-MI, Cracd-deficient Sham, and Cracd-deficient MI groups at 7 days post-MI. (A) Parasternal long‑axis B‑mode images. Left ventricular wall was segmented into six regions: BA (basal anterior), MA (mid anterior), AA (apical anterior), AP (apical posterior), MP (mid posterior), and BP (basal posterior). Color gradient from blue to red represents increasing strain magnitude. (B) Cardiac motion trajectories; time-to-peak curves for radial and longitudinal strain values along with corresponding peak times. Parametric distribution maps of strain synchrony (blue/red indicate direction: radial – away from/toward center; longitudinal – away from/toward apex). White dots = highest velocity regions, black dots = lowest velocity. Three-dimensional reconstructions (X: time, Y: spatial position, Z: strain magnitude). Please click here to view a larger version of this figure.
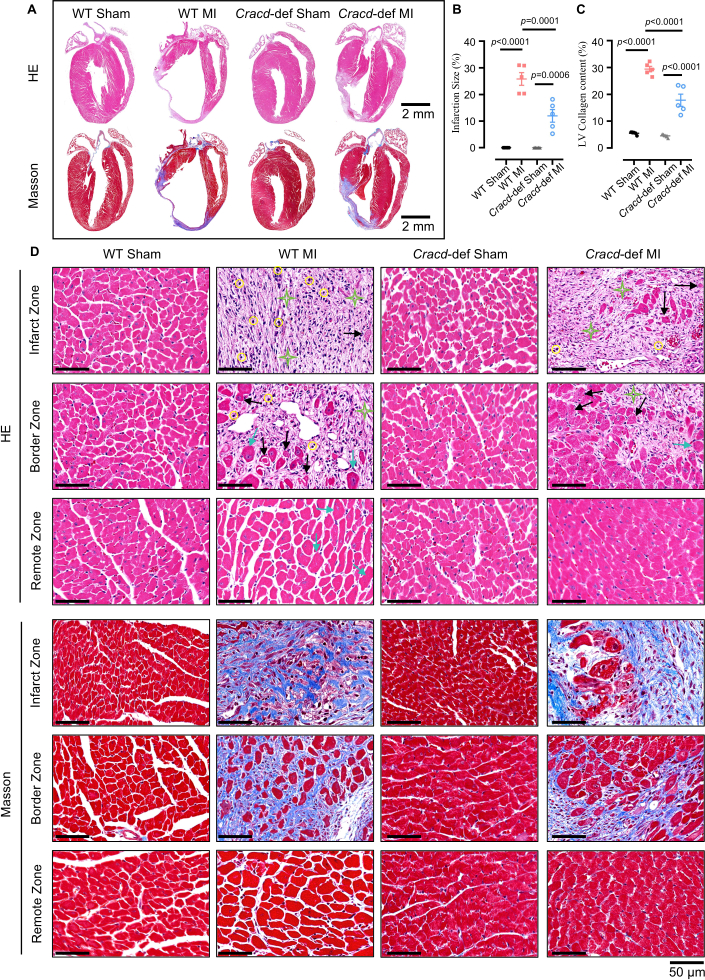
Figure 5: Histopathological analysis of cardiac remodeling after MI. (A) Whole-heart longitudinal sections with H&E and Masson's trichrome staining. Scale bars: 2 mm. (B) Quantitative analysis of infarct size and (C) collagen content. (D) High‑magnification views of infarct zone (IZ), border zone (BZ), and remote zone (RZ). H&E: yellow circles = inflammatory infiltration; black arrows = myocardial necrosis; green stars = fibrosis; blue arrows = hypertrophy. Masson’s trichrome: blue indicates collagen deposition. Scale bar: 50 μm. n = 5 mice per group. Data are presented as mean ± SEM. Statistical significance was determined by one-way ANOVA followed by Tukey's multiple comparisons test. Please click here to view a larger version of this figure.
Diskussion
In dieser Studie haben wir eine mit CRISPR/Cas9 erzeugte Cracd-defiziente Maus generiert und einen Arbeitsablauf etabliert, um sie nach Myokardinfarkt mittels konventioneller Echokardiographie, Strain-Bildgebung mit Speckle-Tracking und Histologie zu phänotypisieren. Das Protokoll erzeugte Knockouts mit nachgewiesener Abwesenheit des CRACD-Proteins. Cracd-defiziente Mäuse zeigten nach Myokardinfarkt eine geringere ventrikuläre Dilatation, eine bessere Ejektionsfraktion (EF) und reduzierte Fibrose im Vergleich zu WT-Kontrollen, was die Nützlichkeit des Modells für die Untersuchung der kardialen Remodeling-Prozesse bestätigt.
Der Erfolg dieses Modells hängt von mehreren kritischen Schritten ab. Die Gestaltung der gRNA und deren Validierung in vitro beeinflussen direkt die Effizienz der Zygoten-Editierung23. Wir verwenden CRISPick oder Benchling, um gRNAs mit CRISPRater-Scores ≥ 0,5 auszuwählen, und testen anschließend die Spaltungs-Effizienz mittels eines in-vitro-Cas9/gRNA-Assays. Nur gRNAs mit einer Spaltungseffizienz von > 50 % werden mikroinjiziert. Eine korrekte LAD-Ligatur ist ebenso entscheidend: Die 7‑0-Naht muss 2–3 mm vom Ursprung der LAD entfernt in einer Tiefe von 0,5–1 mm gesetzt werden, um eine Perforation des rechten Ventrikels (zu tief) oder ein Versagen der Gefäßokklusion (zu flach) zu vermeiden; eine sofortige Aufhellung der vorderen Wand bestätigt die Okklusion. Auch die Kontrolle der Herzfrequenz während der Echokardiographie ist wesentlich24. Durch Anpassung der Isofluran-Konzentration (typischerweise 1–2 %) wird eine Frequenz von 450–550 Schlägen pro Minute aufrechterhalten, was die Reproduzierbarkeit konventioneller und Dehnungsmessungen verbessert. Schließlich ist für die Analyse mittels Spackle-Tracking eine visuelle Beurteilung des farbcodierten Netzes unerlässlich25. Das Netz muss den myokardialen Begrenzungen folgen, ohne ruckartige Bewegungen; andernfalls ist eine manuelle Nachbearbeitung erforderlich. Falls nach drei Versuchen die Qualität weiterhin unzureichend ist, wird die Maus ausgeschlossen.
Auch bei sorgfältiger Einhaltung des Protokolls können bestimmte technische Schwierigkeiten auftreten. Systematisches Fehlerbeheben kann die meisten davon beheben. Niedrige Keimbahn-Übertragungsraten (unter 10 %) deuten gewöhnlich auf eine schlechte Integration des Donator-Oligonukleotids oder eine schwache gRNA-Aktivität hin26. Daher können eine Erhöhung der Donator-Oligo-Konzentration auf 20 ng/µL, eine Verlängerung der Homologiemarker auf 120–200 bp und eine erneute Überprüfung der gRNA-Schneideaktivität (> 50 %) die Übertragungsrate verbessern. Eine hohe Sterblichkeit nach MI (über 30 %) resultiert oft aus Pneumothorax, Blutungen und einer großen Infarktzone27. Daher senken die kontinuierliche Sauerstoffgabe bis zur Wiedererlangung der Bewusstlosigkeit und die Verwendung einer Heizplatte zur Aufrechterhaltung der Körpertemperatur die Sterblichkeitsrate deutlich. Wenn die vordere Wand nach der Ligatur nicht blass wird, wurde wahrscheinlich die LAD falsch identifiziert oder die Naht ist zu flach. In diesem Fall helfen die erneute Lokalisation der LAD (ein hellrotes diagonales Gefäß) und das erneute Einführen der Nadel in einer Tiefe von 0,5–1 mm, gegebenenfalls unter Verwendung eines Operationsmikroskops. Bei schlechter Qualität der Fleckverfolgung (Speckle-Tracking) sind üblicherweise eine niedrige Bildfrequenz, unscharfe Grenzen oder Bewegungsartefakte die Ursache28. Entsprechend helfen eine Erhöhung der Bildfrequenz, eine Feinabstimmung der Verstärkung (Gain), eine manuelle Korrektur der endokardialen Kontur und das Ausschließen von Zyklen mit Arrhythmien.
Abgesehen von diesen praktischen Überlegungen weist die Methode klare Einschränkungen auf. Der Cracd-Knockout ist global, sodass CRACD in allen Geweben fehlt. Folglich kann der beobachtete Schutz nicht ausschließlich auf Kardiomyozyten zurückgeführt werden, da auch systemische Beiträge eine Rolle spielen könnten. Um zelltypspezifische Funktionen voneinander abzugrenzen, wäre ein bedingter Knockout erforderlich. Eine weitere Einschränkung ist der einzige Zeitpunkt am Tag 7; über die chronische Umbildung erfahren wir nichts. Daher sollten spätere Zeitpunkte (4 oder 8 Wochen) für Langzeitstudien hinzugefügt werden. Die Reproduzierbarkeit leidet zudem unter der Abhängigkeit von der Bildqualität: Nicht jedes Ultraschallsystem liefert scharfe endokardiale Grenzen, und die Erfahrung des Bedieners spielt eine Rolle. Deshalb wird empfohlen, dass alle Operationen und Messungen von einem professionell ausgebildeten Personal durchgeführt werden.
Angesichts dieser Einschränkungen ist es sinnvoll, unseren Ansatz mit alternativen Strategien zur Untersuchung der Genfunktion bei der postinfarktbedingten Remodellierung zu vergleichen. Die AAV-vermittelte Genmanipulation und Antisense-Oligonukleotide (ASOs) sind zwei gängige Alternativen29,30. AAV9 kann eine kardialspezifische, vorübergehende Überexpression oder Abschaltung ohne Züchtung ermöglichen, weist jedoch Einschränkungen wie eine begrenzte Packkapazität (~4,7 kb), variable Transduktionseffizienz und Off-Target-Effekte auf31. Im Gegensatz dazu bietet unser CRISPR/Cas9-Knockout-Modell einen permanenten und vollständigen Funktionsverlust, was für Langzeitstudien vorteilhaft ist. ASOs ermöglichen eine reversible, dosisabhängige Abschaltung mit schnellem Wirkungseintritt und eignen sich daher für akute Interventionen; sie erfordern jedoch wiederholte Applikationen und weisen keine Gewebespezifität auf32. Daher eignet sich der hier beschriebene konstitutive Knockout am besten für die anfängliche Entdeckung und die chronische Phänotypisierung.
Schließlich kann das Protokoll weit über CRACD hinaus angewendet werden. Derselbe Arbeitsablauf – die Erzeugung von Knockout-Mäusen mittels CRISPR/Cas9 in Kombination mit Echokardiographie, Dehnungsabbildung und Histologie – ermöglicht die Untersuchung jedes Kandidatengens bei der postinfarktbedingten Umbildung. Der Phänotypisierungsansatz eignet sich ebenfalls für andere kardiovaskuläre Krankheitsmodelle, wie beispielsweise die transversale Aortenkonstriktion (Drucküberlastung) oder Ischämie-Reperfusionsschäden. Zudem können die im Rahmen dieses Protokolls gewonnenen Gewebeproben für Multi-Omics-Analysen (Transkriptomik, Proteomik, Metabolomik) verwendet werden, um molekulare Mechanismen aufzuklären. Das Cracd-defiziente Modell kann als Werkzeug für die Wirkstoffprüfung dienen: Verbindungen, von denen vermutet wird, dass sie über den CRACD-Signalweg wirken, können evaluiert werden. Dadurch bietet dieses Protokoll eine Plattform, die an eine breite Palette mechanistischer und translationsorientierter Studien in der kardiovaskulären Forschung angepasst werden kann.
Offenlegungen
Die Autoren erklären, dass sie keine konkurrierenden Interessen haben.
Danksagungen
Diese Arbeit wurde durch die Guangdong Basic and Applied Basic Research Foundation (2023A1515011278), das selbst finanzierte Projekt des Guangdong Provincial Biotechnology Research Institute (GDBRI-ZL202602) und den chinesisch-kanadischen akademischen Austausch und die Zusammenarbeit zu kardiovaskulären Krankheitsmodellen und Pathogenese (MS202500058) unterstützt.
Materialien
| Name | Unternehmen | Katalognummer | Kommentare |
|---|---|---|---|
| ACRISPR/Cas9 | |||
| Trizma-Hydrochlorid-Lösung | Sigma-Aldrich, USA | T2663 | Verwendung zur Herstellung des DNA-Extraktionspuffers |
| Proteinase K | Sigma-Aldrich, USA | 539480 | Verwendung zur Verdauung von Mäuseschwänzen |
| Green Taq Mix | Vazyme, China | P131 | Verwendung zur PCR-Amplifikation |
| Agarose | BioFroxx, Deutschland | 1110GR500 | Verwendung für DNA-Gelelektrophorese bei 1–2 % Konzentration |
| DNA-Marker | Thermo Scientific, USA | SM0242 | Verwendung als DNA-Ladder zur Größenbestimmung von PCR-Produkten |
| TIANamp Genomisches DNA-Kit | Tiangen Biotech, China | DP304 | Verwendung zur Extraktion genomischer DNA aus Mäuseschwanzgewebe |
| MEGAshortscript™ T7-Transkriptionskit | Thermo Scientific, USA | AM1354 | Verwendung zur in-vitro-Transkription von gRNA |
| RNA-Reinigungskit | Zymo Research, USA | R1016 | Verwendung zur Reinigung transkribierter gRNA |
| BeyoCRISPR™ sgRNA-Screening-Kit | Beyotime, China | D8412S | Verwendung zur in-vitro-Bewertung der gRNA-Spaltaktivität |
| RNase-Inhibitor | NEB, USA | M0314 | Verwendung zum Schutz vor RNA-Abbau während der in-vitro-Transkription |
| TaKaRa Taq | Takara Bio, Japan | R001A | Verwendung zur PCR-Genotypisierung von Mäuseschwanz-DNA |
| FERTIUP® Maus-Spermien-Präinkubationsmedium: PM | Cosmo Bio, Japan | KYD-002-EX | Verwendung zur Spermienkapazitation vor der In-vitro-Fertilisation |
| T7 ARCA mRNA-Kit | NEB, USA | E2060 | Verwendung zur in-vitro-Transkription von Cas9-mRNA |
| Pregnant Mare Serum Gonadotropin | MCE, USA | 9002-70-4 | Verwendung zur Superovulation, verabreicht per intraperitonealer Injektion |
| Menschliches Choriongonadotropin | ProSpec, Israel | HOR-250 | Verwendung zur Induktion des Eisprungs, verabreicht per intraperitonealer Injektion |
| RNase-freies Wasser | Aladdin, China | R665526 | Verwendung zur RNA-Auflösung und PCR-Ansatzherstellung |
| Primer | Sangon Biotech, China | / | Verwendung zur Genotypisierung |
| Chirurgie | |||
| Isofluran | RWD Life Science, China | R510-22-10 | Verwendung zur Einleitung und Aufrechterhaltung der Anästhesie während der Operation |
| Enthaarungscreme | Veet, Frankreich | 1000207 | Wird auf den Brustbereich aufgetragen, um das Fell vor der Operation und Ultraschalluntersuchung zu entfernen |
| 7-0 Nahtmaterial | Lingqiao, China | LQ7022380206 | Verwendung zur dauerhaften Ligatur der linken absteigenden Koronararterie (LAD) |
| 4-0 Nahtmaterial | Lingqiao, China | LQ4022380412 | Verwendung zum Verschluss der Hautinzision nach der Operation |
| Anästhesiebeatmungsgerät | Harvard Apparatus, USA | Tabletop | Verwendung zur Zufuhr von Isofluran und zur Unterstützung der Atmung |
| Kleintier-Beatmungsgerät | Taimeng, China | HX-101E | Verwendung zur Bereitstellung einer positiven Druckbeatmung während der Brustkorb-Operation |
| Konstanttemperatur-Heizplatte | TigerGene, USA | TG-TP-GS | Verwendung zur Aufrechterhaltung der Körpertemperatur der Maus während der Operation und Erholungsphase |
| Rippenretraktor | Shenzhen Huayon Biotech, China | LN-18-4101 | Verwendung zum Auseinanderziehen der Rippen und Freilegen des Herzens für die LAD-Ligatur |
| Schere | Shenzhen Huayon Biotech, China | 18-0551 | Verwendung zum Anlegen von Hautschnitten und zum Durchtrennen von Gewebe |
| Stereo-Mikroskop | Nikon, Japan | SMZ 745 | Verwendung zur vergrößerten Darstellung während der LAD-Arterienligatur-Operation |
| Mikroskopische Nadelhalter | Shenzhen Huayon Biotech, China | 18-2211 | Verwendung zum Handhaben der kleinen 7-0-Nadel unter dem Mikroskop |
| Chemikalien und Reagenzien | |||
| Schallkopfkopplungsmittel | Tianjin Jinya Technology Development, China | TM-100 | Wird auf die Brust für die Echokardiographie aufgetragen, sorgt für guten Sondenschluss |
| Paraformaldehyd | Sigma-Aldrich, USA | V900894 | Verwendung zur Fixierung von Herzgewebe nach der Entnahme |
| Xylol | Macklin, China | 1330-20-7 | Verwendung zur Paraffinentfernung und Gewebeaufhellung vor der Färbung |
| Hämatoxylin | Sigma-Aldrich, USA | H3136 | Kernfärbung, Verwendung in der HE-Färbung |
| Eosin | Sigma-Aldrich, USA | E4009 | Cytoplasmafärbung, Verwendung in der HE-Färbung |
| Ponceau S | Sigma-Aldrich, USA | P3504 | Verwendung in der Masson-Färbung zur Cytoplasmafärbung |
| Phosphormolybdänsäure | Sigma-Aldrich, USA | 221856 | Verwendung in der Masson-Färbung als Beize und zur Differenzierung |
| Anilinblau-Lösung | Sigma-Aldrich, USA | 415049 | Verwendung in der Masson-Färbung zur Kollagenfasernfärbung (blau) |
| CRACD-Antikörper | Absea, China | KC-35356 | Primärantikörper zum Nachweis des CRACD-Proteins mittels Western Blot, Verdünnung 1:2000 |
| GAPDH-Antikörper | CST, USA | 2118S | Ladungskontrollantikörper für den Western Blot, Verdünnung 1:5000 |
| Äthanol | Macklin, China | 64-17-5 | Verwendung zur Dehydrierung und Reagenzherstellung (70 %, 80 %, 95 %, 100 % Stufen) |
| Laborgeräte | |||
| Sorvall™ Legend™ Micro 17 Zentrifuge | Thermo Scientific, USA | 75002541 | Verwendung zur routinemäßigen Probenvorbereitung |
| PCR-Thermocycler | Bio-Rad Laboratories, USA | 1861096 | Verwendung zur DNA-Amplifikation |
| Mikroinjektionssystem | Eppendorf, Deutschland | 5193000020 | Verwendung zur Mikroinjektion von CRISPR/Cas9-Reagenzien in Zygoten |
| Vevo 2100 Bildgebungssystem | VisualSonics, Kanada | Vevo2100 | Hochfrequenz-Bildgebungssystem zur nicht-invasiven Beurteilung der Herzfunktion und -struktur nach Myokardinfarkt |
| Optisches Mikroskop | Leica, Deutschland | DM2500 | Verwendung zur Beobachtung von HE- und Masson-gefärbten Herzschnitten |
| Analyse-Software | |||
| ImageJ | National Institutes of Health, USA | / | Verwendung zur Bildanalyse, einschließlich Flächenmessung, Signalquantifizierung und Verarbeitung histologischer Bilder (HE- und Masson-Färbung) |
| VevoLab 3.2.0 / VevoStrain | VisualSonics, Kanada | / | VevoLab-Software zur Analyse der Herzfunktion; VevoStrain-Modul zur Analyse der myokardialen Dehnung zur Beurteilung der Herzleistung nach Myokardinfarkt |
| GraphPad Prism 8 | GraphPad Software, USA | / | Verwendung zur statistischen Analyse und Erstellung von Grafiken |
Referenzen
- Fauconnier, J., Meli, A. C., Thireau, J., Roberge, S., Shan, J., et al. Ryanodine receptor leak mediated by caspase-8 activation leads to left ventricular injury after myocardial ischemia-reperfusion. Proc Natl Acad Sci U S A. 108 (32), 13258-13263 (2011).
- Cohn, J. N., Ferrari, R., Sharpe, N. Cardiac remodeling-concepts and clinical implications: a consensus paper from an international forum on cardiac remodeling. J Am Coll Cardiol. , (2000).
- Liu, D., Tian, X., Liu, Y., Song, H., Cheng, X., et al. CREG ameliorates the phenotypic switching of cardiac fibroblasts after myocardial infarction via modulation of CDC42. Cell Death Dis. 12 (4), (2021).
- Contessotto, P., Pandit, A. Therapies to prevent post-infarction remodelling: from repair to regeneration. Biomaterials. 275, (2021).
- Zhu, R., Sun, H., Yu, K., Zhong, Y., Shi, H., et al. Interleukin-37 and dendritic cells treated with interleukin-37 plus troponin I ameliorate cardiac remodeling after myocardial infarction. J Am Heart Assoc. 5 (12), (2016).
- Chang, Y., Zhang, J., Huo, X., Qu, X., Xia, C., et al. Substrate rigidity dictates colorectal tumorigenic cell stemness and metastasis via CRAD-dependent mechanotransduction. Cell Rep. 38 (7), (2022).
- Seo, Y., Jang, J., Ko, K. P., Zou, G., Huang, Y., et al. Actin dysregulation induces immune evasion via oxidative stress-activated PD-L1 in gastric cancer. bioRxiv. , (2024).
- Kim, B., Zhang, S., Huang, Y., Ko, K. P., Jung, Y. S., et al. CRACD loss induces neuroendocrine cell plasticity of lung adenocarcinoma. Cell Rep. 43 (6), (2024).
- Jung, Y. S., Wang, W., Jun, S., Zhang, J., Srivastava, M., et al. Deregulation of CRAD-controlled cytoskeleton initiates mucinous colorectal cancer via β-catenin. Nat Cell Biol. 20 (11), 1303-1314 (2018).
- Liu, Z., Cao, H., Shi, Y., Yang, R. KIAA1211 plays an oncogenic role in human non-small cell lung cancer. J Cancer. 10 (26), 6747-6753 (2019).
- Snider, P. L., Snider, E., Simmons, O., Lilly, B., Conway, S. J. Analysis of uncharacterized mKiaa1211 expression during mouse development and cardiovascular morphogenesis. J Cardiovasc Dev Dis. 6 (2), (2019).
- Lin, Y. H., Warren, C. M., Li, J., McKinsey, T. A., Russell, B. Myofibril growth during cardiac hypertrophy is regulated through dual phosphorylation and acetylation of the actin capping protein CapZ. Cell Signal. 28 (8), 1015-1024 (2016).
- Yang, F. H., Pyle, W. G. Reduced cardiac CapZ protein protects hearts against acute ischemia-reperfusion injury and enhances preconditioning. J Mol Cell Cardiol. 52 (3), 761-772 (2012).
- Tong, C., Huang, G., Ashton, C., Wu, H., Yan, H., et al. Rapid and cost-effective gene targeting in rat embryonic stem cells by TALENs. J Genet Genomics. 39 (6), 275-280 (2012).
- Cordes, S. P. N-ethyl-N-nitrosourea mutagenesis: boarding the mouse mutant express. Microbiol Mol Biol Rev. 69 (3), 426-439 (2005).
- Cong, L., Ran, F. A., Cox, D., Lin, S., Barretto, R., et al. Multiplex genome engineering using CRISPR/Cas systems. Science. 339 (6121), 819-823 (2013).
- Kanke, K. L., Rayner, R. E., Bozik, J., Abel, E., Venugopalan, A., et al. Single-stranded DNA with internal base modifications mediates highly efficient knock-in in primary cells using CRISPR-Cas9. Nucleic Acids Res. 52 (22), 13561-13576 (2024).
- Mihos, C. G., Liu, J. E., Anderson, K. M., Pernetz, M. A., O'Driscoll, J. M., et al. Speckle-tracking strain echocardiography for the assessment of left ventricular structure and function: a scientific statement from the American Heart Association. Circulation. 152 (10), (2025).
- Garg, P. K., Biggs, M. L., Kizer, J. R., Shah, S. J., Psaty, B., et al. Glucose dysregulation and subclinical cardiac dysfunction in older adults: the Cardiovascular Health Study. Cardiovasc Diabetol. 21 (1), (2022).
- Asanuma, T., Fukuta, Y., Masuda, K., Hioki, A., Iwasaki, M., et al. Assessment of myocardial ischemic memory using speckle tracking echocardiography. JACC Cardiovasc Imaging. 5 (1), 1-11 (2012).
- Chong, S. Y., Zharkova, O., Yatim, S. M. J. M., Wang, X., Lim, X. C., et al. Tissue factor cytoplasmic domain exacerbates post-infarct left ventricular remodeling via orchestrating cardiac inflammation and angiogenesis. Theranostics. 11 (19), 9243-9261 (2021).
- Hung, C. L., Verma, A., Uno, H., Shin, S. H., Bourgoun, M., et al. Longitudinal and circumferential strain rate, left ventricular remodeling, and prognosis after myocardial infarction. J Am Coll Cardiol. 56 (22), 1812-1822 (2010).
- Labuhn, M., Adams, F. F., Ng, M., Knoess, S., Schambach, A., et al. Refined sgRNA efficacy prediction improves large- and small-scale CRISPR-Cas9 applications. Nucleic Acids Res. 46 (3), 1375-1385 (2018).
- Wu, J., Bu, L., Gong, H., Jiang, G., Li, L., et al. Effects of heart rate and anesthetic timing on high-resolution echocardiographic assessment under isoflurane anesthesia in mice. J Ultrasound Med. 29 (12), (2010).
- Voigt, J. U., Pedrizzetti, G., Lysyansky, P., Marwick, T. H., Houle, H., et al. Definitions for a common standard for 2D speckle tracking echocardiography: consensus document of the EACVI/ASE/Industry Task Force to standardize deformation imaging. J Am Soc Echocardiogr. 28 (2), 183-193 (2015).
- Port, F., Chen, H. M., Lee, T., Bullock, S. L. Optimized CRISPR/Cas tools for efficient germline and somatic genome engineering in Drosophila. Proc Natl Acad Sci U S A. 111 (29), (2014).
- Gao, E., Lei, Y. H., Shang, X., Huang, Z. M., Zuo, L., et al. A novel and efficient model of coronary artery ligation and myocardial infarction in the mouse. Circ Res. 107 (12), 1445-1453 (2010).
- Rösner, A., Barbosa, D., Aarsæther, E., Kjønås, D., Schirmer, H., et al. The influence of frame rate on two-dimensional speckle-tracking strain measurements: a study on silico-simulated models and images recorded in patients. Eur Heart J Cardiovasc Imaging. 16 (10), 1137-1147 (2015).
- Argiro, A., Bui, Q., Hong, K. N., Ammirati, E., Olivotto, I., et al. Applications of gene therapy in cardiomyopathies. JACC Heart Fail. 12 (2), 248-260 (2024).
- Micheletti, R., Plaisance, I., Abraham, B. J., Sarre, A., Ting, C. C., et al. The long noncoding RNA Wisper controls cardiac fibrosis and remodeling. Sci Transl Med. 9 (395), (2017).
- Wu, Z., Yang, H., Colosi, P. Effect of genome size on AAV vector packaging. Mol Ther. 18 (1), 80-86 (2010).
- Juliano, R. L. The delivery of therapeutic oligonucleotides. Nucleic Acids Res. 44 (14), 6518-6548 (2016).
Nachdrucke und Genehmigungen
