Diese Studie stellt ein simuliertes Küstensystem unter Verwendung eines Mausmodells vor, um die Retentionsrate und den photoprotektiven Wirkungsgrad von Sonnenschutzmitteln unter komplexen Umweltbelastungen – einschließlich Bestrahlung mit ultraviolettem Licht, Eintauchen in Meerwasser, Auswaschen durch Wellen und Austrocknen durch Wind – quantitativ zu bewerten. Es dient als präklinisches Screening-Verfahren und ersetzt keine standardisierten klinischen Studien.
Methodenartikel
Ein In-vivo-murines simuliertes Küstensystem zur Beurteilung der Wirksamkeit und Haltbarkeit von Sonnenschutzmitteln
* These authors contributed equally
In diesem Artikel
Zusammenfassung
Zusammenfassung
Ultraviolet (UV) radiation is a primary environmental factor causing skin photoaging, sunburn, and acute UV-induced skin injury. Sunscreen is the most common method of photoprotection; however, current evaluation methods fail to accurately simulate complex seaside environments or pose high costs and ethical limitations. This study presents a novel simulated seaside testing system combined with a live murine model to quantitatively evaluate the efficacy and durability of sunscreens under complex environmental stressors. The custom-designed chamber integrates controllable UV irradiation, seawater immersion with simulated waves, and wind-drying mechanisms. Depilated BALB/c mice were treated with different sunscreens and exposed to a standardized 120-minute simulated seaside cycle. The retention rate of the sunscreens was quantified using fluorescence imaging, while the photoprotective efficacy was evaluated by Hematoxylin and Eosin (H&E) staining for epidermal thickness and inflammatory infiltration. The results demonstrated that this system could effectively differentiate the performance of various sunscreens. Specifically, a high-protection water-resistant sunscreen exhibited the highest retention rate and provided the best protection against UV and environmental damage. This protocol offers a cost-effective, highly reproducible, and ethical preclinical screening alternative for exploring skin protection products under simulated extreme environments, serving as an exploratory bridge rather than a validated replacement for mandatory human SPF testing.
Einleitung
Ultraviolette (UV-)Strahlung, insbesondere UVA und UVB, ist die Hauptursache für photoaging der Haut, Sonnenbrand und akute, durch UV-Strahlung verursachte Hautschäden1,2,3. Die Verwendung von Sonnenschutzmitteln ist die am weitesten verbreitete Strategie, um diese nachteiligen Wirkungen zu verringern4,5. Daher ist die genaue Bewertung der Wirksamkeit von Sonnenschutzmitteln von entscheidender Bedeutung sowohl für die dermatologische Forschung als auch für die Kosmetikindustrie.
Derzeit umfassen die wichtigsten Methoden zur Prüfung der Wirksamkeit von Sonnenschutzmitteln in-vitro-Instrumentalanalysen und klinische Studien am Menschen6,7. In-vitro-Methoden, wie die UV-Spektrophotometrie an Quarzplatten oder künstlicher Haut, sind kostengünstig und hochgradig reproduzierbar8,9. Sie können jedoch die komplexen Dynamiken der Filmbildung, Wasserbeständigkeit und Auswaschbeständigkeit von Sonnenschutzmitteln auf lebender Haut nicht simulieren. Klinische Studien am Menschen hingegen, bei denen die minimale Erythem-Dosis (MED) auf dem Rücken von Probanden gemessen wird, gelten als Goldstandard zur Bestimmung des Lichtschutzfaktors (SPF) gemäß den Richtlinien der Internationalen Organisation für Normung (ISO) (SPF: ISO 24444, Wasserbeständigkeit: ISO 16217) und der FDA10,11,12,13,14. Trotz ihrer Zuverlässigkeit sind klinische Studien teuer, zeitaufwendig, starken individuellen Schwankungen unterworfen und durch ethische Erwägungen stark eingeschränkt, insbesondere bei der Prüfung unter extremen oder potenziell schädlichen Umweltbedingungen.
Eine wesentliche Einschränkung bestehender Evaluierungstechniken ist die Unfähigkeit, praktische Meeresumgebungen umfassend zu simulieren. Während Aktivitäten am Meer durchlaufen Sonnenschutzmittel einen synergistischen Abbau, der durch Eintauchen in salzhaltiges Meerwasser und Auswaschen durch Wellen verursacht wird15,16. Diese Faktoren beeinträchtigen die Haftstabilität und den Schutzzeitraum der aufgetragenen Produkte erheblich. Um diese Einschränkungen zu überwinden, stellt diese Studie ein neuartiges simuliertes Meeresumgebungstestsystem vor, das ein BALB/c-Mausmodell verwendet. Dieses System integriert mehrere entscheidende Umweltparameter – darunter UV-Intensität, Meerwasser-Salinität, Wassertemperatur, Wellenkraft und Windgeschwindigkeit – in eine einzige, hochgradig kontrollierbare Plattform. Durch die Kombination dieser Hardware mit quantitativer Fluoreszenzbildgebung und histologischer Analyse ermöglicht das Protokoll eine präzise Bewertung sowohl der Rückhalterate des Sonnenschutzmittels als auch der physiologischen Schutzwirkung. Diese Methode bietet eine zuverlässige, kostengünstige und effiziente Lösung zur Beurteilung der Leistungsfähigkeit von Sonnenschutzmitteln in komplexen, realitätsnahen marinen Szenarien.
Protokoll
All methods involving vertebrate animals were performed in compliance with the institutional guidelines and approved by the laboratory animal care and ethics committee of Guangdong Laidi Biomedical Research Institute Co., Ltd., under approval No. LDSW2025050-4.
1. Setup of the simulated seaside chamber
- Assemble the test chamber, which consists of a transparent, airtight metal box (dimensions: 40 cm length × 30 cm width × 30 cm height) with access ports for the animals.
- Integrate the UV Simulation Unit: Install UV lamps (6W) at the top of the chamber, providing an approximate intensity of 2 mW/cm2. This simulates the average strong midday seaside sunlight.
CAUTION: UV radiation is hazardous to the eyes and skin. Ensure the chamber is fully sealed and wear appropriate safety goggles and protective clothing when operating the UV unit. - Integrate the water environment unit. Fill the built-in water tank with artificial seawater.
- Prepare the seawater by dissolving commercial sea salt in purified water at a ratio of 1 kg (± 0.05 kg) salt to 30 L (± 0.5 L) water. Set the water temperature controller to maintain a constant temperature of 25 °C (± 1 °C).
- Activate the wave-maker at a flow rate of approximately 10 L/min to simulate the mechanical friction of moderate shore waves.
- Position the blower fan to direct airflow across the animal holding area. Calibrate airflow to 35 cubic feet per minute (CFM) to simulate a seaside breeze.
- Connect all components to a central control interface. Prior to testing, input the target environmental parameters into the control system and calibrate them using the corresponding measurement instruments.
NOTE: Execute this initial verification by utilizing an external handheld digital UV radiometer, a waterproof thermometer, and an anemometer, ensuring that the UV intensity (2 mW/cm2), water temperature (25 °C), and wind speed (35 CFM) match the intended setpoints prior to initiating the biological experiments. - During the experiment, toggle the UV lamps, wave-maker, and water drainage on or off via the interface to precisely execute the alternating immersion and emersion phases.
2. Preparation of the animal model
- House adult BALB/c mice (weighing approximately 20 g to 25 g) in standard conditions and allow them to acclimatize for one week prior to the experiment.
- Briefly anesthetize the mice using 1.5% isoflurane via inhalation to minimize stress. Pre-shave the fur on the backs of the mice using an animal hair removal device.
- Next, apply a commercial chemical depilatory cream evenly to the dorsal skin of the mice. After 3 to 5 min, gently wipe away the hair using warm, damp gauze.
CAUTION: Chemical depilatory creams and paraformaldehyde used in histology are toxic and irritants. Handle them in a well-ventilated area while wearing protective gloves. Disposal: Dispose of all chemical waste (paraformaldehyde) and biological waste (animal carcasses and tissues) in designated biohazard and chemical waste containers strictly in accordance with institutional and local regulatory requirements. - House the depilated mice for an additional 2 days to allow recovery. Before the experiment, visually inspect the dorsal skin to confirm the complete absence of erythema or irritation from the depilatory process.
- Draw a cross on the exposed dorsal skin using a black marker to divide the area into four distinct quadrants (Quadrants 1 to 4).
3. Sunscreen application and pre-treatment
- Prepare the test sunscreens. Randomly select three commercial sunscreens: A, B, and C.
- Apply the sunscreen to the designated areas using a 20 μL micropipette, and spread the formulation evenly with a sterile gloved fingertip in a gentle circular motion for 10 s to ensure the formation of a uniform film as follows:
NOTE: Ensure the pressure applied by the fingertip remains consistent across all quadrants. Uneven spreading or excessive pressure can lead to irregular film thickness, which will directly compromise the reproducibility of the subsequent retention evaluation. - Quadrant 1 (Top-Left): Apply 20 mg/cm2 of Sunscreen A.
- Quadrant 2 (Top-Right): Apply 20 mg/cm2 of Sunscreen B.
- Quadrant 3 (Bottom-Left): Apply 20 mg/cm2 of Sunscreen C.
- Quadrant 4 (Bottom-Right): Leave untreated (Unprotected control).
- Place the mice in a resting position for 5 min to ensure that the sunscreen is evenly and stably distributed on the dorsal skin.
4. Sunscreen retention assessment
- Mix a safe fluorescent marker (0.01% w/w Sulfo Cy7) into Sunscreen A, Sunscreen B, and Sunscreen C.
- Apply the fluorescently labeled sunscreens to the dorsal skin of the mice as described in section 3.
- Capture the initial baseline fluorescence image (F0) of the dorsal skin using an in vivo fluorescence imaging system.
NOTE: Verify that the imaging parameters, including exposure time and focal plane, remain strictly locked for each animal. An inaccurate baseline (F0) capture will invalidate the final calculation of the sunscreen retention rate. - Place the mice into the testing chamber. Turn off the UV lamps and set the water temperature to 25 °C.
- Raise the water level and activate the wave-maker so that the mice undergo a 30-minute immersion phase (swimming), ensuring their heads safely remain above the water surface.
- Next, turn off the wave-maker and lower the water level to expose a stepped metal platform inside the chamber, allowing the mice to rest safely on the platform for 30 min (emersion phase).
- Repeat the 30-minute immersion phase and the 30-minute emersion phase for a second cycle (120 min in total).
- Capture the post-exposure fluorescence image (F1) using the in vivo imaging system.
- Calculate the retention level using the formula:
Retention level = (F1 / F0) × 100% (1) - Calculate the relative fluorescence intensity using the formula:
Fluorescence intensity = (F1(X) / F1(A)) × 100% (2)
where F0 is the baseline fluorescence intensity, F1 is the post-experiment fluorescence intensity, F1(A) is the post-experiment fluorescence intensity of the area applied with Sunscreen A, and F1(X) is the post-experiment fluorescence intensity of the area applied with Sunscreen B or C.
NOTE: Ensure the UV lamps remain off during the fluorescence monitoring experiment to prevent UV-induced quenching of fluorescence. The total exposure time is 120 min, and ensure constant monitoring of the animals' respiratory rate and activity status throughout the immersion phase to confirm the absence of signs of distress or exhaustion.
5. Photoprotective efficacy detection
- Apply the standard (non-fluorescent) sunscreens to the backs of the mice as described in section 3.
- Apply a piece of black, UV-blocking tape to the upper neck area of the mouse to serve as a UV-shielded internal control. Record the baseline skin conditions via macroscopic photography.
NOTE: Press the edges of the tape firmly to prevent water seepage or accidental detachment during the wave wash phase. If the tape detaches, the internal control area will be compromised by exposure to UV and water, confounding the histological baseline. - Expose the mice to the same water cycling program described in section 4, with the UV simulation unit activated: raise the water level for 30 min (immersion), lower the water level for 30 min (emersion phase), and repeat for a second cycle (total 120 min).
- Remove the mice from the chamber and record the presence of erythema, peeling, or hardening on the skin using macroscopic photography.
NOTE: Based on the chamber dimensions (40 cm × 30 cm × 30 cm) and the animals' activity space relative to the light source, the cumulative UV dose delivered during the 120-minute cycle is estimated at approximately 2.5 J/cm2. Dosages around this level effectively induce measurable epidermal thickening and acute inflammation while ensuring the safety of the mice and strictly maintaining animal welfare limits3. - At the experimental endpoint, euthanize the mice humanely via cervical dislocation under deep isoflurane anesthesia, strictly following the American Veterinary Medical Association (AVMA) Guidelines for the Euthanasia of Animals, to harvest skin tissues for the subsequent histological evaluation. Excise the dorsal skin tissues from the four quadrants and the tape-protected area.
- Fix the tissues in 4% paraformaldehyde for 24 h, followed by standard dehydration, paraffin embedding, and sectioning.
- Stain the sections with hematoxylin and eosin (H&E). Briefly, deparaffinize the sections in xylene, rehydrate through graded ethanol solutions, stain with hematoxylin for 5 min, rinse in running tap water, counterstain with eosin for 1 min, dehydrate, and mount with a resinous mounting medium.
- Observe the stained sections under a light microscope. Measure the thickness of the epidermis and assess the level of skin inflammation by counting the infiltrating inflammatory cells.
NOTE: The UV dose delivered during the cycle is sufficient to induce acute erythema for efficacy evaluation but remains well within the safe, non-lethal threshold, as evidenced by the mice showing no signs of severe systemic damage and maintaining normal physical activity after the testing cycle.
6. Statistical analysis
- Perform statistical analysis using GraphPad Prism 9.5. Express quantitative variables as mean ± standard deviation. Use one-way ANOVA followed by Tukey’s post-hoc test for comparisons among multiple groups. Statistical significance was defined as *p < 0.05, **p < 0.01, and ns indicates no significance (p > 0.05).
Ergebnisse
Environmental characterization of the testing system
Before the in vivo evaluation, the physical parameters of the simulated seaside chamber were calibrated to ensure high environmental fidelity. The UV simulation unit utilized a 6 W lamp emitting a broad spectrum ranging from 300 to 420 nm with a peak wavelength at 340 nm. This specific spectral distribution ensures a dominant UVA emission accompanied by a biologically relevant portion of UVB, which effectively mirrors the typical ultraviolet spectrum of natural midday sunlight reaching the Earth's surface17. The wave maker operated at a flow rate of 10 L/min, which generates a mild fluid shear stress comparable to gentle coastal wave washout. Additionally, the airflow unit provided a constant wind speed of 35 CFM, translating to a wind velocity of approximately 3 to 4 m/s over the test area. This correlates with a gentle breeze (Beaufort scale 3) typical of seaside meteorological conditions18. These combined parameters reliably replicate the cyclic mechanical and environmental stressors experienced during typical seaside activities.
Sunscreen retention assessment
First, the simulated seaside apparatus was assembled. As shown in Figure 1A, the system primarily consists of a blower fan, a UV irradiation system, a simulated seawater tank, and a control system, which are respectively used for wind-drying, UV irradiation, seawater immersion, and centralized control. After placing the mice in the apparatus and starting the system, the conditions of immersion and emersion phases on the shore were successfully simulated (Figure 1B). Based on this setup, we first investigated sunscreen retention under these conditions. Initially, commercially available Sunscreens A, B, and C, labeled with a fluorescent marker, were applied to the dorsal skin of the mice. Subsequently, these mice were subjected to an alternating cycle in the simulation apparatus, consisting of 30 min of immersion (simulating swimming) and 30 min of emersion phase (simulating sunbathing on the shore). After 2 h, following a complete cycle of wave and wind, the retained fluorescence on the skin was detected using in vivo imaging. As shown in Figure 2A–B, compared to pre-simulation, all sunscreen groups exhibited a decrease in fluorescence intensity, indicating that the wash-off effect of seawater waves causes a significant amount of sunscreen to be removed. Among them, the quadrant treated with Sunscreen C retained a relatively high amount of fluorescence, Sunscreen B showed a moderate retention rate, and Sunscreen A exhibited the lowest retention rate (Figure 2C). This indicates that Sunscreens C and B possess relatively stronger retention capabilities. These data confirm that our apparatus can quantitatively differentiate the durability of different formulations under complex environmental stress.
Photoprotective efficacy
To further investigate the UV-protective effects of these sunscreens in a simulated seaside environment, macroscopic observations of the dorsal skin of mice were conducted. As shown in Figures 3A and 3B, the unprotected control exhibited UV-induced damage, characterized by pronounced erythema, redness, and sunburn. In contrast, the regions treated with sunscreens showed significantly alleviated sunburn symptoms. Furthermore, histological analysis using H&E staining was performed and was consistent with the aforementioned macroscopic observations (Figure 4A–B). When the unprotected control was exposed to the seaside simulator, significant thickening of the epidermis and marked infiltration of inflammatory cells (Figure 4C) in the dermis were observed, demonstrating that the simulated seaside testing system effectively replicates skin sunburn in a practical seaside environment. The application of sunscreens significantly mitigated these pathological changes. Notably, the epidermis thickness and inflammatory cell infiltration of the skin tissue treated with Sunscreen C were remarkably similar to those of the UV-shielded internal control subjected to the same environmental stress. This indicates that Sunscreen C provides the optimal protective effect in the simulated marine environment, likely attributable to its high retention rate and inherent photoprotective properties.
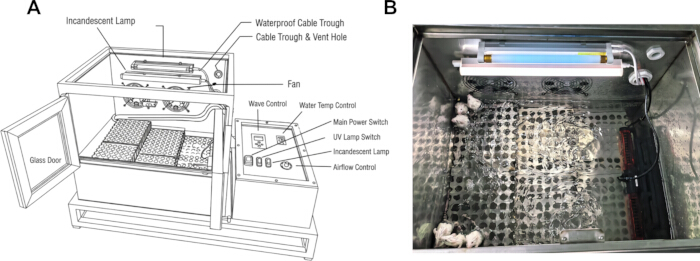
Figure 1: Overview of the simulated seaside testing system. (A) Schematic diagram of the apparatus. (B) Mice inside the testing chamber. The customized test chamber integrates a UV irradiation device, a water tank with a wave generator, and a blower fan, effectively simulating a practical seaside environment. No copyright concerns are associated with this figure as it is obtained by the authors. Please click here to view a larger version of this figure.
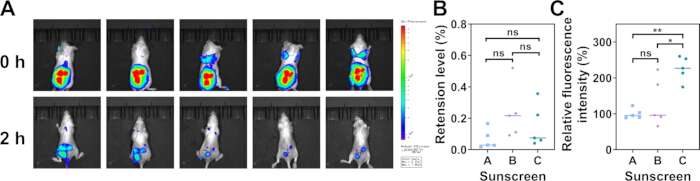
Figure 2: Sunscreen retention fluorescence analysis. (A) Representative fluorescence images of the mouse dorsal skin before and after the 120-minute experiment. (B) Quantitative analysis of fluorescence retention. (C) Relative fluorescence intensity analysis. Data are presented as mean ± SD (n = 5). Statistical analysis was performed using one-way ANOVA followed by Tukey’s post-hoc test. *p < 0.05, **p < 0.01. Please click here to view a larger version of this figure.
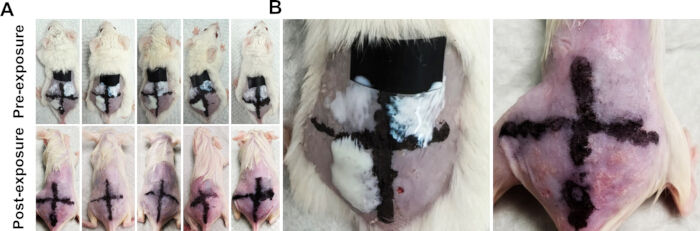
Figure 3: Macroscopic appearance of mouse skin after environmental exposure. (A) Representative macroscopic images of the mouse dorsal skin after a 120-minute exposure to the simulated seaside environment. (B) Locally enlarged views showing the occurrence of erythema and peeling in the unprotected control area compared to the sunscreen-protected areas and the UV-shielded internal control (Normal). Please click here to view a larger version of this figure.
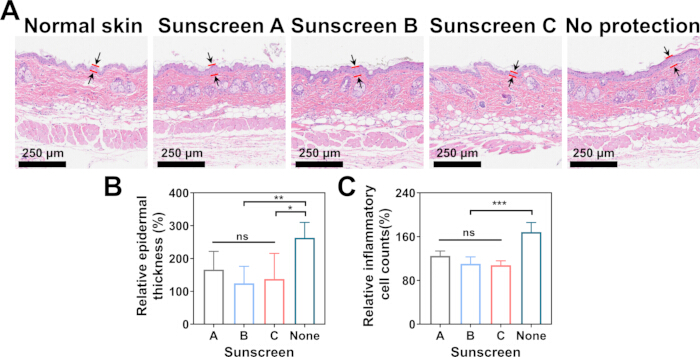
Figure 4: Histological evaluation of photoprotective efficacy. (A) Representative H&E-stained sections of the mouse dorsal skin from different treatment areas following environmental exposure. Indicator lines identify the boundaries of the measured epidermis. Scale bar = 250 µm. (B) Quantitative analysis of epidermal thickness in each designated area. (C) Quantitative assessment of relative inflammatory cell counts (%). The UV-shielded internal control (Normal) was set as the baseline (100%). Data are presented as mean ± SD (n = 5). Statistical analysis was performed using one-way ANOVA followed by Tukey’s post-hoc test. *p < 0.05, **p < 0.01, ***p < 0.001. Please click here to view a larger version of this figure.
Diskussion
In this study, a multi-factor simulated seaside testing system combined with a live murine model was successfully developed and validated. Beyond providing a novel apparatus, this integrated protocol enables the dynamic evaluation of sunscreen durability and photoprotective efficacy under synergistic environmental stressors. By bridging the gap between simplified in vitro assays and complex human clinical trials, this method establishes a comprehensive preclinical platform for understanding how skin barrier formulations perform in practical marine settings.
The primary advantage of this protocol over conventional methods is its high environmental fidelity. Standard water-resistance tests typically involve static water immersion in a laboratory tub19. In contrast, our system integrates the mechanical friction of wave action, the osmotic stress of high-salinity seawater, the evaporative effect of wind, and continuous UV irradiation. These factors act synergistically to break down the sunscreen film, providing a much more rigorous and realistic stress test. It should be noted that during the fluorescence retention assessment, UV lamps were turned off to prevent fluorophore quenching. Consequently, this specific test evaluates physical durability against mechanical washout and osmotic stress, but lacks the UV-induced chemical degradation factor. To compensate for this, the subsequent histological evaluation was conducted with the UV module activated, providing a holistic assessment of practical efficacy. The results clearly demonstrated that while all sunscreens provided some baseline protection, the retention rate (Figure 2) and the corresponding histological protection (Figure 4) varied significantly depending on the formulation's resistance to these combined dynamic forces.
The use of BALB/c mice provides an excellent in vivo platform that accounts for biological variables such as sebum secretion, transepidermal water loss, and dynamic skin movement, which artificial skin models cannot replicate. The UV dose delivered during the 120-minute cycle was strictly controlled to effectively induce acute sunburn on the exposed skin area without causing any systemic toxicity or severe damage, keeping it strictly within ethical limits for BALB/c mice. Furthermore, by dividing a single mouse's back into four quadrants, we eliminated inter-individual biological variation, allowing for highly accurate paired comparisons between different sunscreen formulations.
A critical step in this protocol is ensuring the complete recovery of the murine skin after depilation, as any baseline irritation will confound the histological readout. Furthermore, the uniform application of the sunscreen film, stable calibration of the environmental parameters prior to testing, and precise timing of the immersion and emersion phases are vital to ensuring high reproducibility between batches. Regarding troubleshooting, several foreseeable issues may arise. If uneven sunscreen spreading is observed, recalibrate the pipetting volume and ensure a gentle circular motion. If erythema resulting from depilation persists, the recovery period should be extended, or the affected animals should be excluded. To prevent animal fatigue during immersion, strictly monitor their activity and ensure the resting platform is fully accessible during the immersion phase.
A limitation of this model is the anatomical and physiological difference between murine skin and human skin (e.g., hair follicle density and epidermal thickness). Murine skin possesses higher hair follicle density and a thinner epidermis, which may alter sunscreen film formation. The abundant hair follicle invaginations might act as micro-reservoirs, potentially favoring the mechanical retention of particulate-based (inorganic) sunscreens over strictly organic formulations. While it is a robust comparative tool for screening formulations, human clinical trials remain necessary for final SPF labeling. Future applications of this system are broad. Beyond sunscreens, this apparatus can be adapted to evaluate the durability of other topical cosmetics, barrier creams, wound dressings, and even UV-protective textiles under harsh environmental conditions. The integration of this system streamlines the R&D process, offering cosmetic chemists and dermatological researchers a rapid, cost-effective, and ethical screening method before moving to human trials.
Offenlegungen
Die Autoren haben keine konkurrierenden Interessen zu erklären.
Danksagungen
Diese Arbeit wurde durch Fördermittel aus dem Foshan Self-funded Science and Technology Innovation Project (Nr. 2220001004842) unterstützt.
Materialien
| Name | Unternehmen | Katalognummer | Kommentare |
|---|---|---|---|
| Eosin | Macklin | 770427 | Wird für H&E-Färbung verwendet |
| Äthanol | Macklin | E809059 | Wird für H&E-Färbung verwendet |
| Enthaarungscreme | Veet | TMG-001 | Wird zum Entfernen feiner Haare verwendet |
| Hamatoxylin | Macklin | H810910 | Wird für H&E-Färbung verwendet |
| Image J | Wird für die Bildanalyse verwendet | ||
| In-vivo-Bildgebungssystem | Perkinelmer | IVIS Lumina III | Wird zum Nachweis der Fluoreszenzretention verwendet |
| Isofluran | RWD Life Science | R510-22-10 | Wird zur Anästhesie von Mäusen verwendet |
| Paraformaldehyd | Biosharp | BL539A | Wird zur Fixierung von Hautgeweben verwendet |
| Enthaarungsrasierer | Chemmole | CM700015 | Wird zum Entfernen des Großteils der Haare verwendet |
| Natriumchlorid | Macklin | S805285 | Wird zur Herstellung von simuliertem Meerwasser verwendet |
| Sulfo Cy7 | Ruixibio | R-Z54515 | Wird zur Markierung von Sonnencreme verwendet |
| UV-Lampe | Kanfu Lighting Technology | T5-6W | Wird zur Bereitstellung von ultraviolettem Licht verwendet |
| Xylol | Macklin | X821391 | Wird für H&E-Färbung verwendet |
Referenzen
- RK Gupta, L Parvadiya, K Dudhat. Advancements in skin cancer prevention and treatment: harnessing technology, natural therapies, and emerging diagnostic approaches. Crit Rev Ther Drug Carrier Syst. 2025; 5: 1-54.
- Q Gao, C Xu, M Tan, et al. Hydrogel-based therapies for photoaging: current advances and future perspectives. J Cosmet Dermatol. 2025; 6: e70295.
- Hong S, Peng Z, Wu M, et al. Human-hair-derived natural particles as multifunctional sunscreen for effective UV protection. ACS nano. 2023; 17(15): 14943-14953.
- S Lautenschlager, HC Wulf, MR Pittelkow. Photoprotection. Lancet. 2007; 9586: 528-37.
- E Biba. Protection: the sunscreen pill. Nature. 2014; 7527: S124-5.
- M Pelizzo, E Zattra, P Nicolosi, et al. In vitro evaluation of sunscreens: an update for the clinicians. ISRN Dermatol. 2012; 352135.
- S Bielfeldt. Performance metrics of sunscreen formulations: in vitro and in vivo techniques. Curr Probl Dermatol. 2021; 124-132.
- J Akrman, L Kubác, H Bendová, et al. Quartz plates for determining sun protection in vitro and testing the photostability of commercial sunscreens. Int J Cosmet Sci. 2009; 2: 119-29.
- DL Lott, J Stanfield, RM Sayre, et al. Uniformity of sunscreen product application: a problem in testing, a problem for consumers. Photodermatol Photoimmunol Photomed. 2003; 1: 17-20.
- SM Tuchayi, Z Wang, J Yan, et al. Sunscreens: misconceptions and misinformation. J Invest Dermatol. 2023; 8: 1406-1411.
- A Breneman, DV Belsito. Sun protection factor testing: a call for an in vitro method. Cutis. 2022; 2: E15-e17.
- U Osterwalder, JC Hubaud, E Perroux-David, et al. Sun-protection factor of zinc-oxide sunscreens: SPF(in vitro) too low compared to SPF(in vivo)-a brief review. Photochem Photobiol Sci. 2024; 10: 1999-2009.
- International Organization for Standardization. ISO 24444:2019 Cosmetics — Sun protection test methods — In vivo determination of the sun protection factor (SPF). Geneva: ISO; 2019.
- International Organization for Standardization. ISO 16217:2020 Cosmetics — Sun protection test methods — Water resistance percentage. Geneva: ISO; 2020.
- G Ruiz-Gutiérrez, A Rodríguez-Romero, A Tovar-Sánchez, et al. Analysis and modeling of sunscreen ingredients’ behavior in an aquatic environment. Oceans. 2022; 3: 340-363.
- JK Saxe, L Mullins, R Jones, et al. Influence of sunscreen formulation on the transfer of mineral and organic ultraviolet filters from skin to seawater in simulated ocean bathing tests. Int J Cosmet Sci. 2023; 84-92.
- D’orazio, J, Jarrett S, Amaro-Ortiz A, et al. UV radiation and the skin. Int J Mol Sci. 2013; 14(6): 12222-12248.
- Met Office. Beaufort wind force scale [Internet]. Exeter: Met Office. Available from: https://weather.metoffice.gov.uk/guides/coast-and-sea/beaufort-scale
- K Geoffrey, A Mwangi, S Maru. Sunscreen products: rationale for use, formulation development and regulatory considerations. Saudi Pharmaceutical Journal. 2019; 7: 1009-1018.
Nachdrucke und Genehmigungen
Dieser Artikel wurde veröffentlicht
Video demnächst verfügbar