This study characterizes age-stratified patterns of allergen sensitization, polysensitization burden, and clinically interpretable sensitization phenotypes in children undergoing standardized skin-prick testing in a 1-year outpatient cohort.
Artículo de investigación
Age-Stratified Sensitization Patterns in Children Undergoing Skin Prick Testing: A 1-Year Retrospective Single-Center Cohort
En este artículo
Resumen
Resumen
Pediatric allergen sensitization varies by age, exposure context, and clinical presentation, yet routine outpatient skin-prick testing data are often interpreted without an integrated age-stratified framework. This study tested the hypothesis that standardized skin-prick testing data could identify age-associated differences in allergen category distribution, polysensitization burden, wheal-response intensity (defined as the size of the raised skin reaction measured after allergen exposure during skin-prick testing), and clinically interpretable sensitization phenotypes in children with suspected allergic diseases.This one-year, retrospective single-center cohort included 647 children who underwent standardized skin-prick testing between March 2024 and February 2025. Age-stratified analyses were used to compare airborne and food allergen sensitization, polysensitization burden, and wheal-response intensity. Hierarchical clustering was applied to identify sensitization phenotypes, and multivariable logistic regression was used to examine factors associated with polysensitization and dominant airborne sensitization. Older age groups showed higher prevalence of airborne sensitization, mixed airborne-food sensitization, polysensitization, and larger wheal responses, whereas food-only sensitization was more frequent in younger children. Clustering identified four clinically interpretable phenotypes: skin prick test-negative, airborne-only sensitization, food-only sensitization, and mixed sensitization. Polysensitization was associated with older age, atopic family history, allergic comorbidities, higher allergic inflammatory markers, and selected indoor environmental exposures. These findings indicate that routine skin prick testing data can be organized into a structured age-stratified interpretation framework. Such a framework may support allergen panel refinement, risk stratification, follow-up planning, and individualized management in pediatric allergy clinics, while requiring external validation in multicenter and longitudinal cohorts.
Introducción
Pediatric allergic diseases place a growing burden on outpatient care, long-term symptom control, and quality of life. Allergic rhinitis, asthma, atopic dermatitis, and food allergy often overlap in clinical practice, and their coexistence can complicate diagnosis, follow-up, and management decisions1. In children with suspected immunoglobulin E-mediated allergy, skin prick testing and serum-specific immunoglobulin E testing are commonly used to support clinical assessment, guide allergen avoidance, and inform treatment planning2. Skin prick testing remains especially useful in routine pediatric clinics because it is rapid, relatively low-cost, and capable of providing immediate information on sensitization to common airborne and food allergens3. However, the clinical meaning of a positive test result depends not only on the allergen tested, but also on age, symptom pattern, exposure context, wheal-response intensity, and the broader structure of co-sensitization4.
Existing studies have shown that allergen sensitization patterns differ across childhood, with food-related sensitization more common in younger children and airborne sensitization more common in older children5. Regional exposure profiles further shape sensitization patterns because dust mite, pollen, mold, cockroach, and animal dander exposures vary by geography, season, housing conditions, and lifestyle6. These findings are clinically important, but their translation into outpatient decision-making remains incomplete. Many studies focus on individual allergens or disease-specific populations, whereas clinicians often need to interpret a single skin prick testing encounter in a child with overlapping respiratory, skin, or food-related symptoms7. In this setting, isolated positivity rates may be less informative than an integrated interpretation of allergen category, sensitization burden, co-sensitization structure, and clinical phenotype.
Several methodological issues limit the comparability and clinical applicability of routine skin-prick testing studies. Allergen panels, positivity thresholds, medication washout requirements, and inclusion criteria often differ across centers, making it difficult to transfer findings directly into local outpatient practice8. Longitudinal cohorts provide valuable evidence on sensitization trajectories, but repeated skin prick testing is not routinely available for many children in real-world clinical care9. As a result, cross-sectional outpatient cohorts remain highly relevant, provided that their findings are interpreted as age-associated patterns rather than individual developmental trajectories. In addition, polysensitization burden, wheal-response intensity, and co-sensitization networks may better capture allergic complexity than single-allergen positivity alone, yet these dimensions are still underused in routine clinical interpretation10.
The present study addresses these gaps by analyzing a one-year retrospective single-center outpatient cohort of children who underwent standardized skin prick testing. The authors hypothesized that routine skin prick testing data, when analyzed through an age-stratified and phenotype-oriented framework, would reveal clinically meaningful differences in allergen category distribution, polysensitization burden, wheal-response intensity, and sensitization phenotype structure. The novelty of this study does not lie in proposing a new skin prick testing procedure, but in integrating standardized test results with age grouping, allergen category classification, polysensitization thresholds, co-sensitization structure, hierarchical phenotype classification, and multivariable modeling within one reproducible clinical dataset. This approach was designed to improve the interpretability of routine outpatient skin prick testing data and to provide a practical basis for age-specific screening panel refinement, risk stratification, and individualized pediatric allergy management11.
Protocolo
This retrospective study was conducted in accordance with the Declaration of Helsinki and the ethical requirements of Beijing Shunyi District Women and Children’s Hospital. The study protocol was reviewed and approved by the Medical Ethics Committee of Beijing Shunyi District Women and Children’s Hospital, with the approval number 2025-015-1. The committee approved the use of routinely collected clinical data and skin prick testing records for this retrospective research project. All patient-level data were anonymized before analysis to protect participant privacy.
Study design and setting
This one-year retrospective single-center clinical cohort study analyzed children who underwent standardized skin prick testing between March 2024 and February 2025 in the pediatric allergy-related outpatient clinic and affiliated clinical departments of Beijing Shunyi District Women and Children’s Hospital. The study period covered 12 consecutive months to include seasonal variation in outpatient visits and allergen exposure. The study was designed as an original research study using routine clinical skin-prick testing data. The analytic workflow included participant screening, skin prick testing validity assessment, age-stratified sensitization profiling, allergen-category and individual-allergen analysis, polysensitization burden assessment, wheal-response intensity analysis, co-sensitization analysis, phenotype classification, multivariable modeling, and sensitivity analyses.
Source data were extracted from the electronic medical record system and standardized skin prick testing record forms using a predefined variable dictionary. Extracted variables included age, sex, visit date, primary symptoms, clinical diagnosis, personal allergy history, family history of atopy, medication discontinuation status, allergen-level skin prick testing results, wheal measurements, positive and negative control responses, laboratory indicators, and environmental exposure variables. A data extraction log and a data-cleaning log were used to document duplicate handling, exclusions, variable coding, missing-data rules, and data harmonization. The analytic dataset was frozen before statistical modeling. The overall study design, participant screening process, and analytic workflow are summarized in Figure 1.
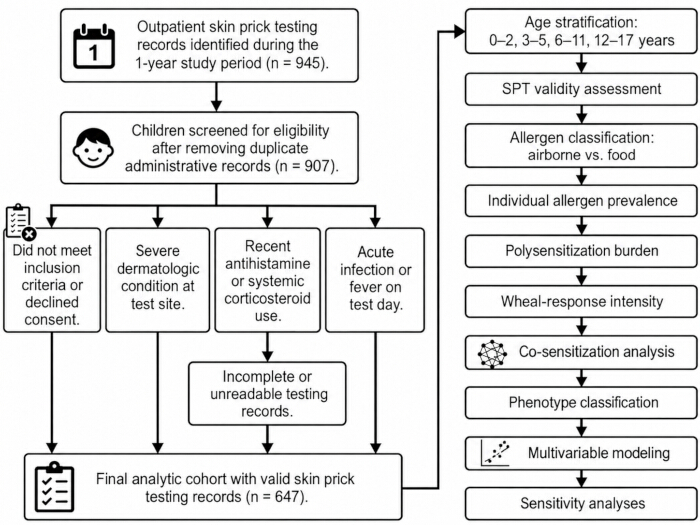
Figure 1: Study flowchart of participant screening and cohort construction. Flowchart showing continuous enrollment, eligibility screening, exclusion steps, and final inclusion of 647 children with valid skin prick testing records. The figure also summarizes the downstream analytic workflow, including age stratification, allergen-specific prevalence analysis, sensitization-burden assessment, co-sensitization analysis, phenotype classification, multivariable modeling, and sensitivity analyses. Please click here to view a larger version of this figure.
Participants and eligibility criteria
Children were eligible if they underwent skin prick testing for allergy-related symptoms or suspected immunoglobulin E-mediated allergic disease during the study period, had a complete and interpretable skin prick testing record, and had available age and sex data. Records were excluded if they represented repeated testing for the same child during the study period, incomplete testing, invalid control responses, failure to meet medication discontinuation requirements, clinical unsuitability for skin prick testing, or missing variables required for primary outcome construction. Repeated records were identified using the patient identifier and the visit date. When more than one eligible record was available for the same child, the first eligible record was retained. If multiple records were generated on the same date, the record with valid control responses and complete wheal-level measurements was retained. The final analytic cohort included 647 children. All eligible consecutive patients meeting inclusion criteria within the study window were enrolled; no formal a-priori sample-size calculation was performed.
Age stratification
Age was the primary stratification variable. Children were grouped into four predefined clinical age strata: 0–2 years, 3–5 years, 6–11 years, and 12–17 years. These groups corresponded to infancy and toddlerhood, preschool age, school age, and adolescence. Skin-prick testing results were not used to determine age groups because outcome-driven age clustering would introduce circularity into subsequent comparisons of sensitization patterns. All age-related findings were interpreted as cross-sectional age-associated differences within the cohort. The study did not infer individual longitudinal sensitization trajectories.
Skin prick testing procedure and quality control
Skin prick testing was performed according to the institutional standard operating procedure for clinical allergy testing and established recommendations for allergen skin testing12. Testing was conducted on the volar forearm using single-use sterile lancets and standardized allergen extracts covering common indoor and outdoor airborne allergens and selected food allergens used in routine pediatric allergy assessment at the study center. Reagent and consumable details are reported in the Table of Materials.
Antihistamines were discontinued for at least 72 h before testing. Medication discontinuation status was confirmed and recorded before the procedure. Testing was deferred if the test site showed acute dermatitis, severe eczema, ulceration, infection, or other local conditions that could affect wheal interpretation.
Positive and negative controls were applied in parallel with the allergen panel for each test. Histamine solution at 10 mg/mL was used as the positive control, and isotonic saline was used as the negative control. A test was considered valid when the positive-control mean wheal diameter was at least 3 mm, and the negative control did not show nonspecific cutaneous hyperreactivity. Nonspecific hyperreactivity was defined as a negative-control wheal greater than or equal to one-third of the positive-control wheal. Records failing either criterion were excluded. For each allergen and control site, the longest wheal diameter and the longest perpendicular diameter were measured. Mean wheal diameter (MWD) was calculated as:
 (1)
where D was the longest diameter and d was the longest perpendicular diameter. All readings were performed 15 min after the skin prick. Borderline or unclear wheal readings were checked by a second trained reader before data entry.
After data import, the dataset was screened for missing control values, negative wheal diameters, duplicate allergen entries, invalid allergen identifiers, and inconsistent control responses. Corrections were documented before dataset freezing.
Allergen classification and sensitization outcomes
All allergens were classified before analysis as airborne allergens or food allergens using a fixed allergen mapping table. Category-level analyses were used to summarize airborne, food, and mixed sensitization patterns. Individual allergen-level analyses were also performed to avoid masking age-specific trends for single allergens. Binary allergen positivity was defined as a mean wheal diameter of at least 3 mm and greater than the negative-control wheal, consistent with commonly used skin prick testing interpretation criteria13. This definition was applied consistently across prevalence analysis, polysensitization analysis, co-sensitization matrices, phenotype classification, and regression models. The main sensitization outcomes included allergen-specific positivity, any airborne allergen sensitization, any food allergen sensitization, airborne-only sensitization, food-only sensitization, mixed airborne-food sensitization, and skin prick test negativity. Prevalence denominators were defined as the number of valid skin prick testing records in each analytic subset.
Polysensitization burden and wheal-response intensity
Polysensitization burden was calculated from allergen-level binary positivity. The indicators included the total number of positive allergens, the number of positive airborne allergens, and the number of positive food allergens. Polysensitization was defined as positivity to two or more allergens, a threshold commonly used to distinguish single sensitization from broader sensitization burden in pediatric allergy research14. High-burden polysensitization was defined as positivity to four or more allergens. Sensitivity analyses tested alternative burden definitions, including total positive allergen count as a continuous variable, polysensitization defined as positivity to three or more allergens, and high-burden polysensitization defined as positivity to five or more allergens. Wheal-response intensity outcomes included maximum wheal diameter per child, mean wheal diameter across positive allergens per child, and semiquantitative skin prick testing grade distribution. These variables were derived directly from raw wheal measurements.
Clinical diagnoses, laboratory indicators, and environmental exposures
Clinical diagnoses were extracted from outpatient records and grouped into allergic rhinitis, asthma or recurrent wheezing, atopic dermatitis or eczema, allergic conjunctivitis, and suspected or diagnosed food allergy. Laboratory indicators included total immunoglobulin E and, when available, eosinophil count. Total immunoglobulin E was log-transformed for regression analysis when used as a continuous predictor. The visit season was derived from the visit date and coded as spring (March to May), summer (June to August), autumn (September to November), and winter (December to February). Environmental exposure variables were extracted from clinical records. Indoor dampness or mold exposure was coded as present when the record documented visible mold, persistent indoor dampness, water damage, or damp housing exposure. Household pet exposure was coded as present when regular exposure to cats, dogs, or other furred pets in the home was recorded. Passive smoking exposure was coded as present when household smoking exposure was documented. Absence of documentation was not coded as absence of exposure unless the record explicitly indicated a negative response. Environmental exposure variables were analyzed as clinically recorded contextual covariates rather than direct causal exposure measurements.
Co-sensitization analysis
Co-sensitization was analyzed using pairwise co-positivity between allergens under the fixed binary positivity rule. Pairwise co-positivity frequencies and phi coefficients were calculated from the binary allergen matrix. The co-sensitization matrix was used to generate network visualizations. The network edge display threshold was fixed before figure generation at a minimum co-positivity frequency of 10 cases per allergen pair. The same edge threshold, layout algorithm, and node-scaling rule were applied to the full-cohort and age-stratified networks.
Phenotype classification
Phenotype classification was performed using patient-level sensitization features. The feature matrix included allergen-level binary positivity, total positive allergen count, airborne-positive allergen count, and food-positive allergen count. Hierarchical clustering was performed using Gower distance and Ward’s linkage (R package cluster, function agnes) because the feature matrix combined binary and count variables15. The number of clusters was selected using dendrogram structure, silhouette width, bootstrap stability, and clinical interpretability.
Cluster stability was assessed using 500 bootstrap resamples. Final phenotype labels were assigned according to sensitization composition and burden pattern. The four phenotype groups were skin prick test-negative, airborne-only sensitization, food-only sensitization, and mixed sensitization. Phenotype groups were then compared by diagnosis distribution, polysensitization burden, and wheal-response intensity. Phenotypes were treated as clinically interpretable sensitization groups, not as final diagnostic categories.
Statistical analysis and model robustness
Continuous variables were summarized as mean ± standard deviation or median with interquartile range. Categorical variables were summarized as counts and percentages. Group comparisons used chi-square tests or Fisher’s exact tests for categorical variables and Student’s t-test, one-way analysis of variance, or nonparametric rank-based tests for continuous variables. All tests were two-sided, and P < 0.05 was considered statistically significant. The two prespecified regression outcomes were polysensitization and dominant airborne sensitization. Polysensitization was defined as positivity to at least two allergens. Dominant airborne sensitization was defined as at least one positive airborne allergen, with the number of positive airborne allergens exceeding the number of positive food allergens in the same child.
Multivariable logistic regression models included prespecified covariates based on clinical relevance and data completeness: age, sex, visit season, diagnosis category, atopic family history, total immunoglobulin E, eosinophil count, indoor dampness or mold exposure, household pet exposure, passive smoking exposure, and urban residence. Adjusted odds ratios and 95% confidence intervals were reported. Model robustness was assessed using variance inflation factors, the Hosmer–Lemeshow goodness-of-fit test, calibration inspection, event-per-variable review, bootstrap internal validation, and sensitivity analyses16. Event-per-variable (EPV) assessment for multivariable logistic regression is reported in Supplementary Table 1. Variance inflation factor values greater than 5 were considered evidence of problematic collinearity. Sparse categories were regrouped when clinically appropriate before model fitting. Sensitivity analyses included complete-case modeling, missing-indicator coding for categorical covariates, restricted-sample analysis among children with available laboratory indicators, alternative polysensitization thresholds, and modeling total positive allergen count as a burden indicator. The direction and consistency of associations were compared across models.
Missing-data rules were fixed before analysis. Records missing mandatory variables for skin prick testing validity or primary outcome construction were excluded. For regression covariates, the primary analysis used complete-case modeling, and sensitivity analyses used missing-indicator coding or restricted-sample analysis where appropriate. Data management and statistical analyses were performed in R version 4.3.2. The main packages included tidyverse, tableone, ggplot2, igraph, cluster, factoextra, rms, and ResourceSelection. The variable dictionary, data-cleaning rules, analysis code, and figure-generation scripts were finalized before final table and figure generation.
Resultados
Cohort baseline characteristics
A total of 647 children with valid skin-prick test records were included in the final analytic cohort. The cohort included 132 children aged 0–2 years, 158 aged 3–5 years, 221 aged 6–11 years, and 136 aged 12–17 years. The median age was 7.0 years (interquartile range, 4.0–11.0 years). Overall, 368 children were boys (56.9%), and 421 children lived in urban areas (65.1%) (Table 1). The cohort was classified into four patient-level sensitization groups: skin prick test-negative (n = 164), airborne-only sensitization (n = 288), food-only sensitization (n = 77), and mixed airborne-food sensitization (n = 118). Age differed across these groups, with median ages of 5.1 years in the skin prick test-negative group, 8.6 years in the airborne-only group, 4.2 years in the food-only group, and 8.1 years in the mixed sensitization group (P < 0.001). Male sex was more frequent in the airborne-only and mixed sensitization groups than in the other two groups (P = 0.038) (Table 1).
Environmental and family history variables also varied across sensitization groups. Urban residence was recorded in 421 children (65.1%), passive smoking exposure in 173 (26.7%), household pet exposure in 119 (18.4%), indoor dampness or mold exposure in 86 (13.3%), and atopic family history in 254 (39.3%). Household pet exposure, indoor dampness or mold exposure, and atopic family history differed significantly across the four sensitization groups (Table 1). Allergic rhinitis was the most common clinical diagnosis (286/647, 44.2%), followed by asthma or recurrent wheezing (148/647, 22.9%), atopic dermatitis or eczema (132/647, 20.4%), suspected food allergy (81/647, 12.5%), and allergic conjunctivitis (112/647, 17.3%). Allergic rhinitis was most frequent in the airborne-only group (170/288, 59.0%), whereas atopic dermatitis or eczema was more frequent in the skin prick test-negative group (58/164, 35.4%) and food-only group (30/77, 39.0%). Total immunoglobulin E, eosinophil count, eosinophil percentage, and maximum wheal diameter also differed significantly across sensitization groups (Table 1).
| Characteristic | Total cohort | SPT-negative | Airborne-only sensitization | Food-only sensitization | Mixed airborne-food sensitization | P value |
| No. of children | 647 | 164 | 288 | 77 | 118 | — |
| Age, years, median (IQR) | 7.0 (4.0–11.0) | 5.1 (2.7–9.0) | 8.6 (5.6–12.0) | 4.2 (1.9–7.1) | 8.1 (5.0–11.6) | <0.001 |
| Age group, n (%) | <0.001 | |||||
| 0–2 years | 132 (20.4) | 52 (31.7) | 36 (12.5) | 26 (33.8) | 18 (15.3) | |
| 3–5 years | 158 (24.4) | 44 (26.8) | 70 (24.3) | 22 (28.6) | 22 (18.6) | |
| 6–11 years | 221 (34.2) | 38 (23.2) | 122 (42.4) | 18 (23.4) | 43 (36.4) | |
| 12–17 years | 136 (21.0) | 30 (18.3) | 60 (20.8) | 11 (14.3) | 35 (29.7) | |
| Male sex, n (%) | 368 (56.9) | 84 (51.2) | 170 (59.0) | 39 (50.6) | 75 (63.6) | 0.038 |
| BMI z-score, mean ± SD | 0.34 ± 1.02 | 0.27 ± 1.05 | 0.41 ± 0.98 | 0.30 ± 1.07 | 0.38 ± 1.01 | 0.42 |
| Urban residence, n (%) | 421 (65.1) | 98 (59.8) | 202 (70.1) | 44 (57.1) | 77 (65.3) | 0.011 |
| Passive smoking exposure, n (%) | 173 (26.7) | 47 (28.7) | 73 (25.3) | 23 (29.9) | 30 (25.4) | 0.63 |
| Household pet exposure, n (%) | 119 (18.4) | 18 (11.0) | 65 (22.6) | 12 (15.6) | 24 (20.3) | 0.004 |
| Indoor dampness or mold exposure, n (%) | 86 (13.3) | 15 (9.1) | 46 (16.0) | 7 (9.1) | 18 (15.3) | 0.032 |
| Atopic family history, n (%) | 254 (39.3) | 51 (31.1) | 132 (45.8) | 24 (31.2) | 47 (39.8) | 0.002 |
| Initial clinical diagnosis at visit, n (%) | <0.001 | |||||
| Allergic rhinitis | 286 (44.2) | 46 (28.0) | 170 (59.0) | 18 (23.4) | 52 (44.1) | |
| Asthma or recurrent wheezing | 148 (22.9) | 36 (22.0) | 78 (27.1) | 8 (10.4) | 26 (22.0) | |
| Atopic dermatitis or eczema | 132 (20.4) | 58 (35.4) | 28 (9.7) | 30 (39.0) | 16 (13.6) | |
| Suspected food allergy | 81 (12.5) | 24 (14.6) | 12 (4.2) | 21 (27.3) | 24 (20.3) | |
| Allergic conjunctivitis, n (%) | 112 (17.3) | 14 (8.5) | 66 (22.9) | 9 (11.7) | 23 (19.5) | <0.001 |
| Prior allergy history, n (%) | 9 (1.4) | 2 (1.2) | 3 (1.0) | 2 (2.6) | 2 (1.7) | 0.59 |
| Total immunoglobulin E, kU/L, median (IQR) | 132 (58–312) | 74 (33–160) | 168 (81–382) | 112 (49–238) | 224 (109–468) | <0.001 |
| Eosinophil count, ×10⁹/L, median (IQR) | 0.38 (0.21–0.62) | 0.26 (0.15–0.44) | 0.41 (0.25–0.66) | 0.33 (0.18–0.55) | 0.49 (0.30–0.78) | <0.001 |
| Eosinophil percentage, %, median (IQR) | 5.2 (3.1–8.6) | 4.0 (2.5–6.4) | 5.8 (3.6–9.1) | 4.9 (2.9–7.8) | 6.7 (4.2–10.3) | <0.001 |
| Maximum wheal diameter, mm, median (IQR) | 5.1 (0–7.8) | 0 (0–0) | 6.4 (4.8–8.6) | 5.3 (4.0–7.2) | 7.6 (5.9–10.2) | <0.001 |
Table 1: Baseline characteristics of the study population stratified by patient-level sensitization pattern. This table summarizes the demographic, environmental, clinical, laboratory, and skin-prick testing characteristics of the cohort, stratified by skin-prick test-negative, airborne-only sensitization, food-only sensitization, and mixed airborne-food sensitization groups.
Age-stratified allergen sensitization profiles
Age-stratified sensitization profiles differed by patient-level category, allergen category, and individual allergen. Skin prick test negativity decreased from 52/132 (39.4%) in the 0–2-year group to 38/221 (17.2%) in the 6–11-year group, then increased to 30/136 (22.1%) in the 12–17-year group. In contrast, airborne-only sensitization increased from 36/132 (27.3%) at 0–2 years to 122/221 (55.2%) at 6–11 years, before slightly decreasing to 68/136 (50.0%) at 12–17 years. Food-only sensitization declined from 26/132 (19.7%) to 11/136 (8.1%), whereas mixed airborne-food sensitization increased from 18/132 (13.6%) to 35/136 (25.7%) across the same age range (Figure 2A). Among airborne allergens, Dermatophagoides pteronyssinus was the dominant sensitizing allergen, increasing from 24/132 (18.2%) at 0–2 years to 86/136 (63.2%) at 12–17 years. Pollen sensitization also increased with age, from 7/132 (5.3%) in the youngest group to 40/136 (29.4%) in adolescents. Cat dander, dog dander, mold, and cockroach sensitization were less frequent overall but were generally more common in older children (Figure 2B).
Food allergen sensitization showed a different pattern. Egg white and milk sensitization were more frequent in children aged 0–2 years, whereas wheat and soybean sensitization remained low across age groups. Shrimp or shellfish sensitization was more frequent in older children than in the youngest group (Figure 2C). At the category level, any airborne sensitization increased from 54/132 (40.9%) at 0–2 years to 95/136 (69.9%) at 12–17 years. Any food sensitization decreased from 45/132 (34.1%) to 27/136 (19.9%), while mixed airborne-food sensitization increased from 18/132 (13.6%) to 35/136 (25.7%) across the same age range (Figure 2D). The full age-stratified allergen-specific results are shown in Table 2 and Figure 2.
| Allergen | 0–2 years, n | 3–5 years, n | 6–11 years, n | 12–17 years, n | Total, n | P value |
| (%) | (%) | (%) | (%) | (%) | ||
| No. of children | 132 | 158 | 221 | 136 | 647 | — |
| Airborne allergens | ||||||
| Dermatophagoides pteronyssinus | 24 (18.2) | 52 (32.9) | 123 (55.7) | 86 (63.2) | 285 (44.0) | <0.001 |
| Pollen | 7 (5.3) | 16 (10.1) | 42 (19.0) | 40 (29.4) | 105 (16.2) | <0.001 |
| Cat dander | 6 (4.5) | 11 (7.0) | 26 (11.8) | 22 (16.2) | 65 (10.0) | <0.001 |
| Dog dander | 5 (3.8) | 10 (6.3) | 24 (10.9) | 20 (14.7) | 59 (9.1) | <0.001 |
| Mold | 4 (3.0) | 7 (4.4) | 13 (5.9) | 10 (7.4) | 34 (5.3) | 0.034 |
| Cockroach | 6 (4.5) | 11 (7.0) | 25 (11.3) | 18 (13.2) | 60 (9.3) | 0.002 |
| Any airborne allergen sensitization | 54 (40.9) | 92 (58.2) | 165 (74.7) | 95 (69.9) | 406 (62.8) | <0.001 |
| Food allergens | ||||||
| Egg white | 30 (22.7) | 28 (17.7) | 27 (12.2) | 12 (8.8) | 97 (15.0) | <0.001 |
| Milk | 23 (17.4) | 22 (13.9) | 18 (8.1) | 8 (5.9) | 71 (11.0) | <0.001 |
| Wheat | 13 (9.8) | 14 (8.9) | 15 (6.8) | 8 (5.9) | 50 (7.7) | 0.082 |
| Soybean | 10 (7.6) | 11 (7.0) | 13 (5.9) | 9 (6.6) | 43 (6.6) | 0.64 |
| Peanut | 8 (6.1) | 10 (6.3) | 18 (8.1) | 13 (9.6) | 49 (7.6) | 0.124 |
| Shrimp or shellfish | 5 (3.8) | 11 (7.0) | 27 (12.2) | 23 (16.9) | 66 (10.2) | <0.001 |
| Any food allergen sensitization | 44 (33.3) | 44 (27.8) | 61 (27.6) | 46 (33.8) | 195 (30.1) | 0.72 |
| Mixed airborne-food sensitization | 18 (13.6) | 22 (13.9) | 43 (19.5) | 35 (25.7) | 118 (18.2) | 0.006 |
Table 2: Age-specific prevalence of sensitization to individual airborne and food allergens based on skin prick testing. This table reports the age-stratified prevalence of individual airborne and food allergen sensitization, including house dust mite, pollen, cat dander, dog dander, mold, cockroach, egg white, milk, wheat, soybean, peanut, and shrimp or shellfish.
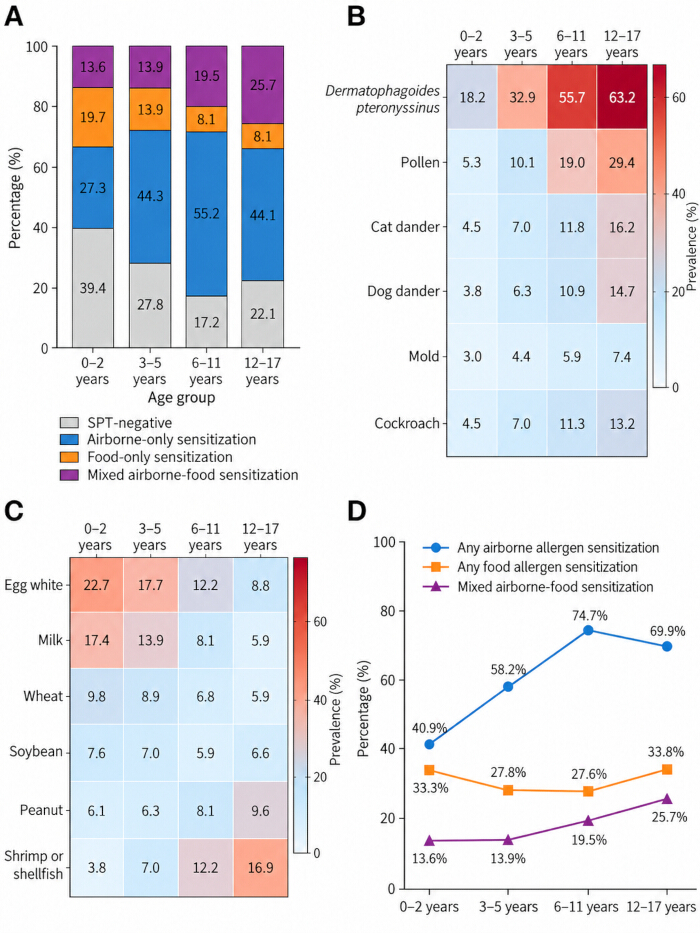
Figure 2: Age-stratified allergen sensitization profiles based on skin prick testing. This figure shows sensitization categories and individual allergen prevalence across age groups. (A) Distribution of patient-level sensitization categories, including skin prick test-negative, airborne-only sensitization, food-only sensitization, and mixed airborne-food sensitization. (B) Age-stratified prevalence of major airborne allergens. (C) Age-stratified prevalence of major food allergens. (D) Category-level prevalence of any airborne allergen sensitization, any food allergen sensitization, and mixed sensitization across age groups. Please click here to view a larger version of this figure.
Polysensitization burden and wheal-response intensity
Table 3 and Figure 3 summarize age-stratified skin-prick test positivity, sensitization burden, and wheal response intensity. Any skin prick test positivity increased from 80/132 (60.6%) at 0–2 years to 183/221 (82.8%) at 6–11 years, then slightly decreased to 106/136 (77.9%) at 12–17 years. The opposite pattern was observed for skin prick test negativity, which decreased from 52/132 (39.4%) to 38/221 (17.2%) before increasing to 30/136 (22.1%) in adolescents (Figure 3A).
The median total number of positive allergens increased from 1 in the youngest group to 3 in both the 6–11–year and 12–17–year groups (Figure 3B). Positive airborne allergen counts increased with age, whereas food allergen counts remained lower and showed less age-related expansion (Figure 3C). Polysensitization increased from 53/132 (40.2%) at 0–2 years to 142/221 (64.3%) at 6–11 years and 87/136 (64.0%) at 12–17 years. High-burden polysensitization also increased, from 11/132 (8.3%) in the youngest group to 34/136 (25.0%) in adolescents (Figure 3D). Wheal-response intensity followed a similar age-associated pattern. Median maximum wheal diameter increased from 4.1 mm at 0–2 years to 5.9 mm at 12–17 years (Figure 3E). The proportion of children with a largest wheal diameter of at least 8 mm increased from 6/132 (4.5%) to 18/136 (13.2%), while the proportion with a largest wheal diameter of at least 10 mm increased from 2/132 (1.5%) to 9/136 (6.6%) across the same age range (Figure 3F).
| Indicator | 0–2 years | 3–5 years | 6–11 years | 12–17 years | P value |
| No. of children | 132 | 158 | 221 | 136 | — |
| Any SPT positivity, n (%) | 80 (60.6) | 114 (72.2) | 183 (82.8) | 106 (77.9) | <0.001 |
| SPT-negative, n (%) | 52 (39.4) | 44 (27.8) | 38 (17.2) | 30 (22.1) | <0.001 |
| Airborne-only sensitization, n (%) | 36 (27.3) | 70 (44.3) | 122 (55.2) | 60 (44.1) | <0.001 |
| Food-only sensitization, n (%) | 26 (19.7) | 22 (13.9) | 18 (8.1) | 11 (8.1) | 0.002 |
| Mixed airborne-food sensitization, n (%) | 18 (13.6) | 22 (13.9) | 43 (19.5) | 35 (25.7) | 0.006 |
| Total positive allergens, median (IQR) | 1 (0–3) | 2 (0–4) | 3 (1–5) | 3 (1–5) | <0.001 |
| Positive airborne allergens, median (IQR) | 0 (0–1) | 1 (0–2) | 2 (1–3) | 2 (1–4) | <0.001 |
| Positive food allergens, median (IQR) | 1 (0–2) | 0 (0–1) | 0 (0–1) | 0 (0–1) | 0.018 |
| Single sensitization, n (%) | 27 (20.5) | 34 (21.5) | 41 (18.6) | 19 (14.0) | 0.132 |
| Polysensitization, ≥2 allergens, n (%) | 53 (40.2) | 80 (50.6) | 142 (64.3) | 87 (64.0) | <0.001 |
| High-burden polysensitization, ≥4 allergens, n (%) | 11 (8.3) | 22 (13.9) | 52 (23.5) | 34 (25.0) | <0.001 |
| Maximum wheal diameter, mm, median (IQR) | 4.1 (0–6.2) | 4.8 (0–7.1) | 5.6 (3.2–8.4) | 5.9 (3.0–8.8) | <0.001 |
| Mean wheal diameter across positive allergens, mm, median (IQR) | 3.2 (0–4.8) | 3.6 (0–5.4) | 4.1 (2.6–6.3) | 4.3 (2.8–6.6) | <0.001 |
| Largest wheal diameter ≥8 mm, n (%) | 6 (4.5) | 11 (7.0) | 25 (11.3) | 18 (13.2) | 0.026 |
| Largest wheal diameter ≥10 mm, n (%) | 2 (1.5) | 5 (3.2) | 13 (5.9) | 9 (6.6) | 0.08 |
Table 3: Sensitization burden and wheal-response intensity across age groups. This table compares skin prick test positivity, patient-level sensitization categories, total positive allergen count, airborne and food allergen counts, polysensitization, high-burden polysensitization, and wheal-response intensity across age groups.
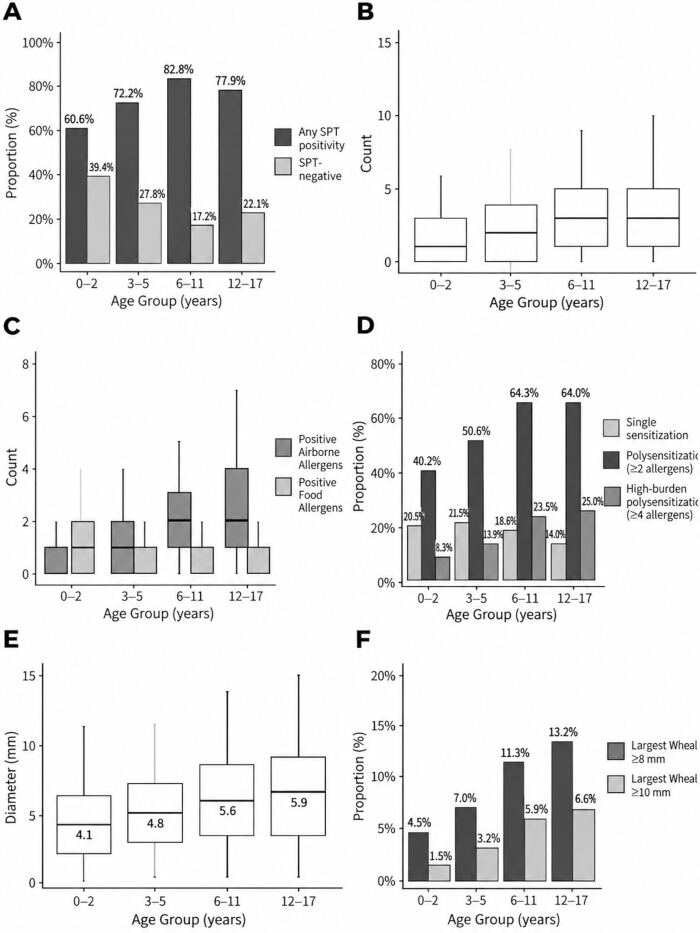
Figure 3: Age-stratified comparison of sensitization burden and wheal-response intensity. This figure compares sensitization burden and wheal-response intensity across the four age groups. (A) Prevalence of any skin prick test positivity and patient-level sensitization categories. (B) Total number of positive allergens per child. (C) Number of positive airborne and food allergens per child. (D) Prevalence of polysensitization and high-burden polysensitization. (E) Maximum wheal diameter across age groups. (F) Proportion of children with the largest wheal diameter ≥8 mm and ≥10 mm. Please click here to view a larger version of this figure.
Co-sensitization structure and pairwise allergen patterns
Table 4 and Figure 4 summarize the pairwise co-sensitization matrix and network structure across the full cohort and age strata. In the full-cohort network, co-sensitization analysis showed denser pairwise connectivity among airborne allergens than among food allergens. House dust mite-centered connections formed the main airborne module, whereas food allergen connections formed smaller modules. Cross-category links between airborne and food allergens were mainly concentrated among children with mixed sensitization (Figure 4A).
Age-stratified networks showed different co-sensitization structures across age groups. In children aged 0–2 years and 3–5 years, frequent co-sensitization pairs were concentrated among food allergens, including egg white-milk, egg white-wheat, and milk-wheat (Figure 4B and Figure 4C). In children aged 6–11 years and 12–17 years, airborne co-sensitization pairs became more prominent, including house dust mite with cockroach or mold and pollen with mold or pet dander (Figure 4D and Figure 4E). Cross-category pairs included pollen–peanut and house dust mite paired with egg white or milk (Table 4; Figure 4A–E).
| Co-sensitization pair | 0–2 years | 3–5 years | 6–11 years | 12–17 years | Total cases | Pattern |
| Egg white–milk | 18 | 14 | 7 | 3 | 42 | Food-food |
| Egg white–wheat | 11 | 8 | 5 | 2 | 26 | Food-food |
| Milk–wheat | 9 | 7 | 5 | 2 | 23 | Food-food |
| Shrimp/shellfish–peanut | 1 | 4 | 7 | 9 | 21 | Food-food |
| Dermatophagoides pteronyssinus–cockroach | 4 | 10 | 35 | 23 | 72 | Airborne-airborne |
| Dermatophagoides pteronyssinus–mold | 3 | 7 | 22 | 16 | 48 | Airborne-airborne |
| Pollen–mold | 1 | 4 | 16 | 15 | 36 | Airborne-airborne |
| Cat dander–dog dander | 2 | 5 | 14 | 12 | 33 | Airborne-airborne |
| Pollen–pet dander | 1 | 3 | 13 | 11 | 28 | Airborne-airborne |
| Dermatophagoides pteronyssinus–egg white | 6 | 8 | 9 | 6 | 29 | Airborne-food |
| Dermatophagoides pteronyssinus–milk | 5 | 7 | 8 | 5 | 25 | Airborne-food |
| Pollen–peanut | 1 | 3 | 10 | 11 | 25 | Airborne-food |
Table 4: Polysensitization patterns and common co-sensitization pairs across age groups. This table summarizes frequent allergen co-sensitization pairs across age groups, including food-food, airborne-airborne, and airborne-food co-sensitization patterns.
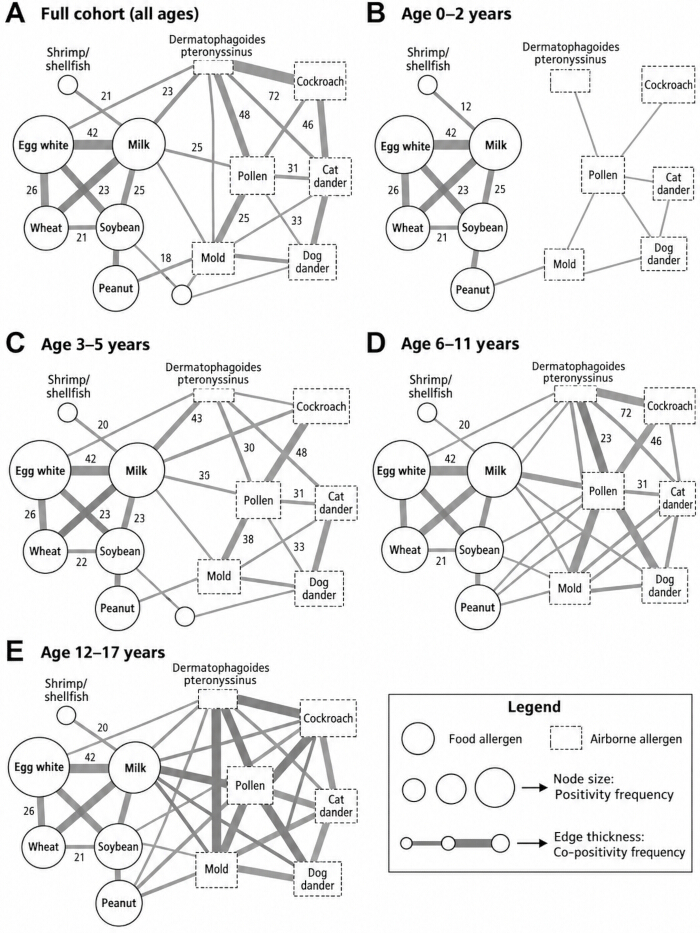
Figure 4: Co-sensitization network of common childhood allergens. This figure presents co-sensitization networks derived from the binary allergen positivity matrix. (A) Full-cohort co-sensitization network. (B) Network for children aged 0–2 years. (C) Network for children aged 3–5 years. (D) Network for children aged 6–11 years. (E) Network for children aged 12–17 years. Nodes represent allergens, and edges represent pairwise co-positivity above the prespecified display threshold. Node size represents allergen positivity frequency, and edge thickness represents pairwise co-positivity frequency. Please click here to view a larger version of this figure.
Seasonal distribution of outpatient visits and airborne allergen sensitization
Table 5 and Figure 5 summarize seasonal outpatient visits and airborne allergen sensitization patterns during the one-year study period. Seasonal visit volume differed across the study period, with the highest number of visits occurring in autumn (191/647, 29.5%) and spring (176/647, 27.2%), followed by summer (143/647, 22.1%) and winter (137/647, 21.2%) (Figure 5A).
The prevalence of any airborne sensitization did not differ significantly across seasons, with rates of 61.4% in spring, 58.7% in summer, 64.9% in autumn, and 65.7% in winter (P = 0.318) (Figure 5B). House dust mite sensitization was present throughout the year and was highest in winter (67.2%), followed by autumn (48.2%), spring (31.8%), and summer (31.5%) (Figure 5C). Pollen sensitization showed clearer seasonal variation, with higher prevalence in autumn (23.6%) and spring (19.9%) than in summer (9.8%) and winter (8.0%) (Figure 5C). Pet dander, mold, and cockroach sensitization showed smaller seasonal differences. Cat dander sensitization ranged from 8.8% in winter to 11.0% in autumn, dog dander from 8.4% in summer to 9.9% in autumn, mold from 4.9% in summer to 5.8% in autumn, and cockroach from 8.4% in summer to 10.5% in autumn (Figure 5D).
| Season | Total Visits (n, %) | Any Airborne Sensitization (n, %) | Dermatophagoides pteronyssinus (n, %) | Pollen (n, %) | Cat Dander (n, %) | Dog Dander (n, %) | Mold (n, %) | Cockroach (n, %) |
| Spring | 176 (27.2) | 108 (61.4) | 56 (31.8) | 35 (19.9) | 19 (10.8) | 16 (9.1) | 9 (5.1) | 15 (8.5) |
| Summer | 143 (22.1) | 84 (58.7) | 45 (31.5) | 14 (9.8) | 13 (9.1) | 12 (8.4) | 7 (4.9) | 12 (8.4) |
| Autumn | 191 (29.5) | 124 (64.9) | 92 (48.2) | 45 (23.6) | 21 (11.0) | 19 (9.9) | 11 (5.8) | 20 (10.5) |
| Winter | 137 (21.2) | 92 (67.2) | 90 (65.7) | 11 (8.0) | 12 (8.8) | 12 (8.8) | 7 (5.1) | 13 (9.5) |
| P value | — | 0.318 | <0.001 | <0.001 | 0.84 | 0.91 | 0.97 | 0.88 |
Table 5: Seasonal distribution of outpatient visits and sensitization to major airborne allergen groups. This table presents seasonal variation in outpatient visit volume and sensitization to major airborne allergen groups, including any airborne sensitization, house dust mite, pollen, cat dander, dog dander, mold, and cockroach.
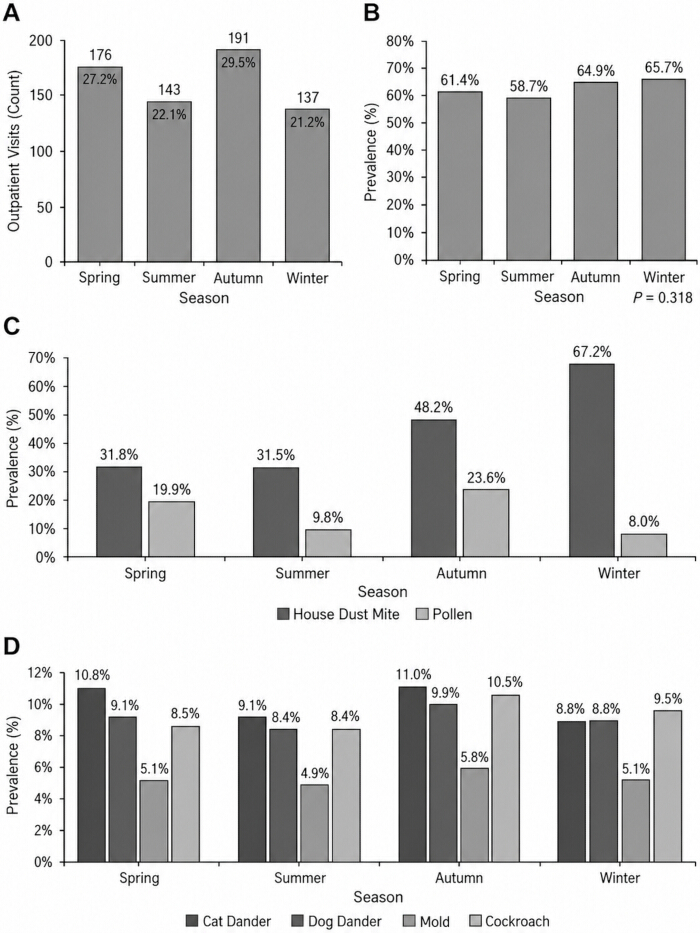
Figure 5: Seasonal distribution of outpatient visits and airborne allergen sensitization. This figure shows seasonal variation in outpatient visits and airborne allergen sensitization. (A) Distribution of outpatient visits across spring, summer, autumn, and winter. (B) Seasonal prevalence of any airborne allergen sensitization. (C) Seasonal prevalence of house dust mite and pollen sensitization. (D) Seasonal prevalence of cat dander, dog dander, mold, and cockroach sensitization. Please click here to view a larger version of this figure.
Phenotype-level allergen composition and co-sensitization structure
Figure 6 summarizes the hierarchical clustering results and phenotype-level sensitization composition. Hierarchical clustering classified the cohort into four sensitization phenotypes: skin prick test-negative, airborne-only sensitization, food-only sensitization, and mixed airborne-food sensitization. The clustering heatmap showed separation across these four groups based on allergen-level positivity and sensitization-burden features (Figure 6A). The distribution of the four phenotypes reflected the overall sensitization structure of the cohort, with airborne-only sensitization as the largest phenotype group, followed by skin-prick test-negative, mixed airborne-food sensitization, and food-only sensitization (Figure 6B). Phenotype-level allergen-category composition showed that the airborne-only phenotype was mainly characterized by indoor and outdoor airborne allergens, whereas the food-only phenotype was mainly characterized by early-life food allergens, including egg white and milk (Figure 6C). The mixed phenotype showed concurrent airborne and food allergen positivity and had a higher total positive allergen count than the single-category phenotypes (Figure 6D).
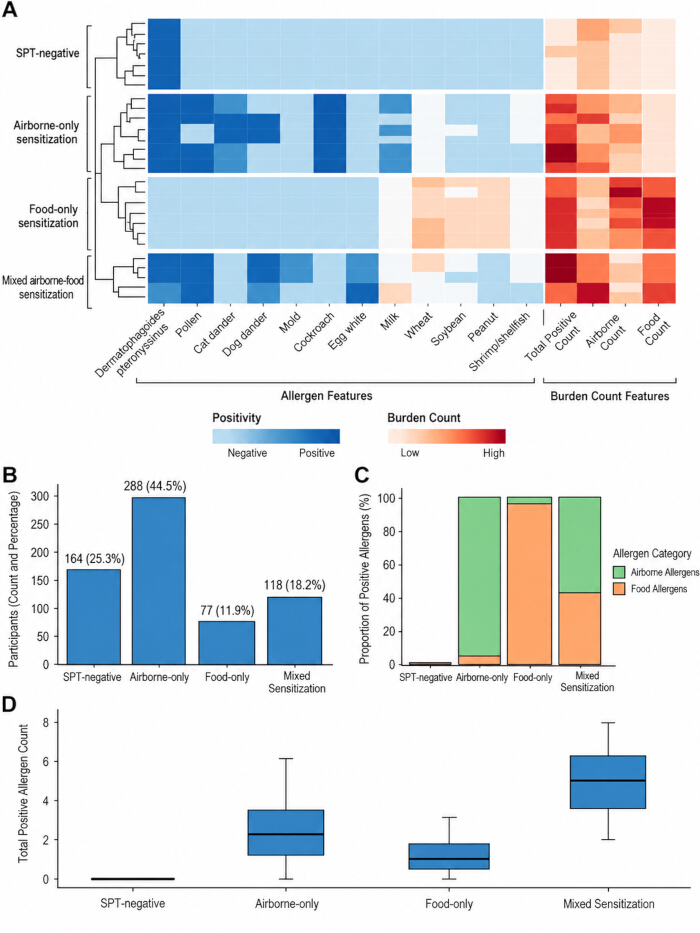
Figure 6: Identification and composition of sensitization phenotypes. This figure shows sensitization phenotype classification and phenotype-level allergen composition. (A) Hierarchical clustering heatmap based on allergen-level positivity and sensitization-burden features. (B) Distribution of the four sensitization phenotypes: skin prick test-negative, airborne-only sensitization, food-only sensitization, and mixed airborne-food sensitization. (C) Allergen-category composition across phenotypes. (D) Total positive allergen count across phenotypes. Please click here to view a larger version of this figure.
Associations between sensitization phenotypes and clinical diagnoses
Table 6 summarizes the adjusted associations between sensitization phenotypes and common allergic disease diagnoses, with the skin-prick test-negative group as the reference. The airborne-only phenotype was associated with allergic rhinitis and allergic conjunctivitis. The food-only phenotype was associated with atopic dermatitis or eczema and suspected food allergy. The mixed phenotype showed associations across respiratory, ocular, skin, and food-related diagnoses. For allergic rhinitis, the adjusted odds ratio was 2.96 for the airborne-only phenotype and 2.28 for the mixed phenotype. For allergic conjunctivitis, the adjusted odds ratio was 2.41 for the airborne-only phenotype and 2.12 for the mixed phenotype. For asthma or recurrent wheezing, the adjusted odds ratio was 1.86 for the mixed phenotype. For atopic dermatitis (eczema), the adjusted odds ratio was 1.78 for the food-only phenotype. For suspected food allergy, the adjusted odds ratio was 2.36 for the food-only phenotype and 2.02 for the mixed phenotype.
| Clinical diagnosis | Airborne-only sensitization | P value | Food-only sensitization | P value | Mixed sensitization | P value |
| Allergic rhinitis | 2.96 (1.91–4.58) | <0.001 | 0.89 (0.46–1.72) | 0.72 | 2.28 (1.39–3.74) | 0.001 |
| Asthma/recurrent wheezing | 1.31 (0.83–2.06) | 0.24 | 0.62 (0.28–1.37) | 0.24 | 1.86 (1.08–3.22) | 0.026 |
| Atopic dermatitis/eczema | 0.41 (0.25–0.67) | <0.001 | 1.78 (1.01–3.14) | 0.046 | 1.32 (0.74–2.35) | 0.34 |
| Suspected/diagnosed food allergy | 0.25 (0.12–0.52) | <0.001 | 2.36 (1.21–4.61) | 0.012 | 2.02 (1.08–3.78) | 0.028 |
| Allergic conjunctivitis | 2.41 (1.27–4.57) | 0.007 | 0.94 (0.39–2.24) | 0.89 | 2.12 (1.05–4.29) | 0.036 |
Table 6: Associations between sensitization phenotypes and common allergic disease diagnoses. This table shows adjusted associations between sensitization phenotypes and common allergic disease diagnoses, using the skin prick test-negative phenotype as the reference group.
Multivariable modeling of polysensitization and dominant airborne sensitization
Multivariable logistic regression models were fitted for two prespecified outcomes: polysensitization and dominant airborne sensitization. Adjusted estimates are shown in Table 7. For polysensitization, age was associated with higher odds (adjusted odds ratio [aOR], 1.14 per year; 95% confidence interval [CI], 1.07–1.22; P < 0.001). Atopic family history was also associated with polysensitization (aOR, 1.68; 95% CI, 1.18–2.39; P = 0.004). Atopic dermatitis or eczema (aOR, 1.59; 95% CI, 1.09–2.33; P = 0.017), asthma or recurrent wheezing (aOR, 1.74; 95% CI, 1.12–2.71; P = 0.014), and allergic rhinitis symptoms (aOR, 1.42; 95% CI, 1.00–2.03; P = 0.049) were associated with higher odds of polysensitization. Total immunoglobulin E (aOR, 1.83 per log10 increase; 95% CI, 1.29–2.60; P = 0.001), eosinophil count (aOR, 1.09 per 0.1 × 10⁹/L increase; 95% CI, 1.03–1.16; P = 0.003), and indoor dampness or mold exposure (aOR, 1.46; 95% CI, 1.01–2.11; P = 0.044) were also associated with polysensitization.
For dominant airborne sensitization, age was associated with higher odds (aOR, 1.26 per year; 95% CI, 1.17–1.36; P < 0.001). Allergic rhinitis symptoms were associated with dominant airborne sensitization (aOR, 2.14; 95% CI, 1.52–3.01; P < 0.001), as was asthma or recurrent wheezing (aOR, 1.49; 95% CI, 1.00–2.21; P = 0.049). Total immunoglobulin E (aOR, 1.51 per log10 increase; 95% CI, 1.10–2.07; P = 0.011), eosinophil count (aOR, 1.05 per 0.1 × 10⁹/L increase; 95% CI, 1.00–1.10; P = 0.041), household pet exposure (aOR, 1.63; 95% CI, 1.14–2.33; P = 0.007), and indoor dampness or mold exposure (aOR, 1.72; 95% CI, 1.19–2.49; P = 0.004) were associated with dominant airborne sensitization. Spring visits were associated with higher odds of dominant airborne sensitization than winter visits (aOR, 1.58; 95% CI, 1.03–2.42; P = 0.036).
| Variable | Polysensitization aOR (95% CI) | P value | Dominant airborne sensitization aOR (95% CI) | P value |
| Age, per year | 1.14 (1.07–1.22) | <0.001 | 1.26 (1.17–1.36) | <0.001 |
| Male sex | 1.08 (0.75–1.55) | 0.68 | 1.12 (0.77–1.62) | 0.55 |
| Spring vs winter | 1.21 (0.80–1.84) | 0.36 | 1.58 (1.03–2.42) | 0.036 |
| Summer vs winter | 0.96 (0.61–1.52) | 0.87 | 1.09 (0.68–1.74) | 0.72 |
| Autumn vs winter | 1.14 (0.76–1.71) | 0.52 | 1.24 (0.81–1.90) | 0.32 |
| Allergic rhinitis symptoms | 1.42 (1.00–2.03) | 0.049 | 2.14 (1.52–3.01) | <0.001 |
| Asthma/recurrent wheezing | 1.74 (1.12–2.71) | 0.014 | 1.49 (1.00–2.21) | 0.049 |
| Atopic dermatitis/eczema | 1.59 (1.09–2.33) | 0.017 | 0.69 (0.44–1.08) | 0.1 |
| Atopic family history | 1.68 (1.18–2.39) | 0.004 | 1.37 (0.98–1.91) | 0.066 |
| Total immunoglobulin E, per log10 increase | 1.83 (1.29–2.60) | 0.001 | 1.51 (1.10–2.07) | 0.011 |
| Eosinophil count, per 0.1 × 10⁹/L increase | 1.09 (1.03–1.16) | 0.003 | 1.05 (1.00–1.10) | 0.041 |
| Indoor dampness/mold exposure | 1.46 (1.01–2.11) | 0.044 | 1.72 (1.19–2.49) | 0.004 |
| Household pet exposure | 1.22 (0.86–1.74) | 0.25 | 1.63 (1.14–2.33) | 0.007 |
| Passive smoking exposure | 0.94 (0.65–1.36) | 0.72 | 0.91 (0.63–1.32) | 0.62 |
| Urban residence | 1.11 (0.77–1.61) | 0.57 | 1.18 (0.81–1.72) | 0.39 |
Table 7: Multivariable logistic regression analysis of factors associated with polysensitization and dominant airborne sensitization. This table presents adjusted odds ratios and 95% confidence intervals for demographic, clinical, laboratory, seasonal, and environmental factors associated with polysensitization and dominant airborne sensitization.
Model robustness and sensitivity analyses
Supplementary Table 1 summarizes the model diagnostics, internal validation, and sensitivity analyses. Model diagnostics did not show problematic collinearity among the prespecified covariates. The maximum variance inflation factor was 2.14 in the polysensitization model and 2.08 in the dominant airborne sensitization model. Hosmer-Lemeshow testing did not indicate poor model fit for the polysensitization model (P = 0.61) or the dominant airborne sensitization model (P = 0.48). The C-statistic was 0.76 for the polysensitization model and 0.81 for the dominant airborne sensitization model. Bootstrap internal validation showed optimism-corrected C-statistics of 0.74 for the polysensitization model and 0.79 for the dominant airborne sensitization model. Complete-case models and missing-indicator models showed consistent directions of association for age, total immunoglobulin E, eosinophil count, atopic family history, and indoor exposure variables. Sensitivity analyses using alternative burden definitions, including positivity to at least three allergens and high-burden positivity to at least five allergens, did not change the direction of the main associations.
Conclusions derived from the results
The results showed age-associated differences in allergen sensitization categories, individual allergen prevalence, polysensitization burden, and wheal-response intensity. Airborne sensitization, mixed sensitization, polysensitization, and larger wheal responses were more frequent in older age groups, whereas food-only sensitization was more frequent in younger children. Phenotype classification separated children into four sensitization groups with different allergen-composition and diagnosis-association patterns. Multivariable models showed that age, atopic family history, allergic inflammatory indicators, allergic comorbidities, and selected indoor environmental exposures were associated with polysensitization or dominant airborne sensitization.
DATA AVAILABILITY:
The anonymized dataset generated and analyzed in this study is publicly available in Figshare: Chang, De; Yang, Shiqing; Huang, Yingjie; Li, Longjie; Liu, Bo (2026). Age-Stratified Sensitization Patterns in Children Undergoing Skin Prick Testing: A 1-Year Single-Center Cohort. Figshare. Dataset. https://doi.org/10.6084/m9.figshare.32101552.v2. The deposited dataset contains de-identified analytic data from the final cohort of 647 children and supports the age-stratified sensitization, polysensitization, phenotype, and regression analyses reported in this manuscript.
Supplementary Table 1: Model diagnostics, internal validation, and sensitivity analyses. This supplementary table summarizes model robustness checks, including variance inflation factors, Hosmer–Lemeshow goodness-of-fit testing, C-statistics, bootstrap internal validation, sensitivity analyses for missing data, and alternative polysensitization threshold analyses. Please click here to download this file.
Discusión
This one-year retrospective single-center cohort study organized routine pediatric skin prick testing data into an age-stratified and phenotype-oriented interpretation framework. The main finding was that sensitization patterns differed across age groups, with younger children showing a higher proportion of food-only sensitization or negative skin prick testing results, while older children showed more frequent airborne-only sensitization, mixed sensitization, polysensitization, and larger wheal responses. This pattern is broadly consistent with population-based and clinical studies showing that pediatric aeroallergen sensitization varies by age, allergen type, and local exposure context17. Importantly, the present findings should be interpreted as cross-sectional age-associated differences within a one-year outpatient cohort, not as evidence that individual children necessarily pass through a fixed sensitization sequence.
At the allergen level, house dust mite remained the dominant airborne allergen in this cohort, while pollen sensitization was more frequent in older age groups and showed clearer seasonal variation. Previous age-specific aeroallergen studies have similarly reported that indoor and outdoor allergen sensitization may differ in timing, intensity, and clinical correlates during childhood18. In the present study, the broad airborne-versus-food grouping captured the main age-associated pattern, but individual allergen-level analysis was necessary to show that food sensitization did not change uniformly across all food allergens. Egg white and milk sensitization were more frequent in younger children, whereas shrimp or shellfish sensitization was more frequent in older children.
The regional setting also matters when interpreting these findings. Sensitization patterns in children are influenced by local allergen exposure, housing conditions, climate, seasonal pollen distribution, and healthcare-seeking patterns. Studies from the greater Beijing region have reported substantial aeroallergen sensitization among children with respiratory allergy, supporting the relevance of local allergen profiles when designing or interpreting pediatric testing panels19. The present results therefore support the use of age-stratified and region-sensitive interpretation of routine skin prick testing results, while avoiding the assumption that a single fixed allergen panel is equally informative for all pediatric age groups.
The phenotype analysis added a second level of interpretation beyond single-allergen positivity. The four phenotype groups separated children into skin prick test-negative, airborne-only, food-only, and mixed sensitization patterns, and these groups differed in allergen composition, sensitization burden, and associated clinical diagnoses. Childhood allergic disease is heterogeneous, and sensitization patterns do not always map directly onto one clinical label or one disease pathway20. In this study, airborne-only and mixed phenotypes were more closely aligned with rhinitis and conjunctivitis, whereas food-only and mixed phenotypes were more closely aligned with skin and food-related presentations. These findings support the clinical interpretability of the phenotype framework, although the phenotypes should not be treated as diagnostic categories.
The regression results further showed that age, atopic family history, allergic comorbidities, total immunoglobulin E, eosinophil count, and selected indoor environmental exposures were associated with polysensitization or dominant airborne sensitization. Longitudinal evidence has shown that inhalant allergen sensitization can be dynamic during childhood, but the present study cannot directly evaluate within-child sensitization trajectories because each child contributed one skin prick testing record21. For that reason, the adjusted associations in this study should be interpreted as factors associated with broader or airborne-dominant sensitization within the observed clinical cohort, rather than as causal predictors of future sensitization progression.
Several practical implications follow from the findings. Age-stratified interpretation may help clinicians decide which allergen categories require closer attention in different pediatric age groups. In children with airborne-only or mixed sensitization and respiratory symptoms, the testing results may support more focused assessment of rhinitis, conjunctivitis, asthma, or recurrent wheezing, and environmental exposure history. Current pediatric allergic rhinitis guidance emphasizes integrated diagnosis and management based on clinical symptoms, exposure assessment, and sensitization evidence22. The framework used in this study may therefore be useful as an outpatient interpretation tool, especially when clinicians need to connect multiple positive skin prick testing results with symptom patterns and follow-up planning.
This study has limitations. First, it was conducted at a single center and included children who underwent skin prick testing in outpatient care, so the sample may overrepresent symptomatic children and may not reflect the general pediatric population. Second, the study was based on cross-sectional skin prick testing records within a one-year period, which limits causal interpretation and prevents direct assessment of individual sensitization trajectories. Third, environmental exposure variables were extracted from clinical records rather than measured through standardized home inspection or prospective exposure monitoring, so exposure misclassification is possible. Fourth, although model diagnostics and sensitivity analyses supported internal stability, external validation is still needed before the phenotype framework can be generalized to other regions, hospitals, or allergen panels.
Future studies should use multicenter designs, repeated follow-up, standardized symptom scores, serum-specific immunoglobulin E testing, component-resolved diagnostics, and more precise exposure assessment. Phenotype-oriented studies of allergic disease have shown that clinically meaningful subgroups may differ in later allergic outcomes, but such subgroups require prospective validation before they can be used as clinical decision rules23. In summary, this study shows that routine pediatric skin prick testing data can be organized into an age-stratified framework that captures allergen category, individual allergen prevalence, polysensitization burden, wheal-response intensity, co-sensitization structure, and phenotype-level clinical associations. The findings do not establish longitudinal progression, but they provide a structured basis for interpreting sensitization patterns in pediatric allergy outpatient practice.
Divulgaciones
The authors declare that they have no competing financial or non-financial interests related to this work.
Author Contributions:
De Chang and Bo Liu conceived and designed the study framework. De Chang, Shiqing Yang, Yingjie Huang, and Longjie Li collected and curated the clinical and skin prick testing data. De Chang and Yingjie Huang performed the data analysis and interpretation. De Chang drafted the manuscript. Shiqing Yang, Longjie Li, and Bo Liu critically reviewed and revised the manuscript for important intellectual content. Bo Liu supervised the overall study and served as the corresponding author. All authors read and approved the final version of the manuscript.
Agradecimientos
We thank the pediatric allergy clinic nurses, technicians, and administrative staff for their support with participant recruitment, skin prick testing coordination, and data collection. We are also deeply grateful to the children and their families for their trust and participation in this study.
Materiales
| Nombre | Empresa | Número de catálogo | Comentarios |
|---|---|---|---|
| Isotretinoin soft capsules, 10 mg | Shanghai Xinyi Yan’an Pharmaceutical Co., Ltd. | NMPA approval no. H10930210; specification: 10 mg × 20 capsules/box | Used in the control group. Patients received one capsule twice daily. |
| Adapalene gel, 0.1%, 30 g/tube | Galderma International / Laboratoires Galderma | NMPA registration no. HJ20160022; product name: Differin; specification: 0.1%, 30 g/tube | Used in both groups as topical nightly spot treatment for raised acne lesions. |
| Disposable sterile acupuncture needle | Suzhou Medical Appliance Factory Co., Ltd.; Hwato brand | Example specification: 0.40 mm × 40 mm; order no. V278110; medical device registration no. 20162200970 | Used for mili-fire needle puncture under aseptic clinical conditions. The exact needle size should match the hospital treatment record. |
| Red-blue LED phototherapy device | Shenzhen Lifotronic Technology Co., Ltd. | Model: JY-A red-blue phototherapy device; medical device registration no. 20172090677 | Used for 20 min once every 14 days in both groups. This device is fixed as the phototherapy device for the final material table. |
| Skin imaging analysis system | Canfield Scientific, Inc. | VISIA Complexion Analysis System or VISIA 3D Complexion Analysis System | Used for standardized facial imaging and imaging-based erythema assessment during follow-up. The exact installed model should be confirmed from the imaging room record. |
| 75% alcohol disinfectant | Shandong Lircon Medical Technology Co., Ltd., or the hospital’s actual disinfectant supplier | Specification and batch number recorded from hospital stock, e.g., 75% alcohol disinfectant, 100 mL or 500 mL | Used for skin disinfection before mili-fire needle treatment and comedone extraction. |
| Stainless-steel comedone extractor | Hospital sterile dermatologic instrument supplier | Manufacturer, instrument code, and sterilization batch recorded by the hospital | Used to gently express lesion contents after needling when clinically appropriate. |
| Sterile gauze pads | Hospital central sterile supply department or local medical consumable supplier | Size and batch number recorded from hospital stock, e.g., 5 cm × 5 cm or 7.5 cm × 7.5 cm | Used for local cleaning and compression after puncture or extraction. |
| Sterile cotton swabs | Hospital central sterile supply department or local medical consumable supplier | Size and batch number recorded from hospital stock | Used for skin disinfection and local cleaning. |
| Disposable medical gloves | Hospital central sterile supply department or local medical consumable supplier | Size, material, and batch number recorded from hospital stock | Used during disinfection, mili-fire needle treatment, lesion expression, and post-treatment care. |
| Modified Zhibai Dihuang Wan combined with Erzhi Wan decoction | Hospital pharmacy or certified Chinese herbal decoction-piece supplier | Supplier, GMP qualification, production batch number, dispensing date, and decoction batch number recorded by the hospital pharmacy | Used in the treatment group. The prescription was prepared from individual herbal decoction pieces rather than as a single commercial patent medicine. |
| Anemarrhena asphodeloides rhizome | Certified Chinese herbal decoction-piece supplier / hospital pharmacy | Batch number recorded by the hospital pharmacy | Used at 10 g in the treatment-group prescription. |
| Phellodendron chinense bark | Certified Chinese herbal decoction-piece supplier / hospital pharmacy | Batch number recorded by the hospital pharmacy | Used at 10 g in the treatment-group prescription. |
| Ligustrum lucidum fruit | Certified Chinese herbal decoction-piece supplier / hospital pharmacy | Batch number recorded by the hospital pharmacy | Used at 15 g in the treatment-group prescription. |
| Eclipta prostrata | Certified Chinese herbal decoction-piece supplier / hospital pharmacy | Batch number recorded by the hospital pharmacy | Used at 15 g in the treatment-group prescription. |
| Rehmannia glutinosa | Certified Chinese herbal decoction-piece supplier / hospital pharmacy | Batch number recorded by the hospital pharmacy | Used at 15 g in the treatment-group prescription. The processed form should match the original hospital prescription record. |
| Prunella vulgaris | Certified Chinese herbal decoction-piece supplier / hospital pharmacy | Batch number recorded by the hospital pharmacy | Used at 10 g in the treatment-group prescription. |
| Taraxacum mongolicum | Certified Chinese herbal decoction-piece supplier / hospital pharmacy | Batch number recorded by the hospital pharmacy | Used at 15 g in the treatment-group prescription. |
| Forsythia suspensa fruit | Certified Chinese herbal decoction-piece supplier / hospital pharmacy | Batch number recorded by the hospital pharmacy | Used at 15 g in the treatment-group prescription. |
| Salvia miltiorrhiza root | Certified Chinese herbal decoction-piece supplier / hospital pharmacy | Batch number recorded by the hospital pharmacy | Used at 25 g in the treatment-group prescription. |
| Glycyrrhiza uralensis root | Certified Chinese herbal decoction-piece supplier / hospital pharmacy | Batch number recorded by the hospital pharmacy | Used at 5 g in the treatment-group prescription. |
| Case report form | Fifth People’s Hospital of Changshu / study team | Internal study document; version number and date recorded | Used for screening, allocation, treatment completion, adverse-event recording, and follow-up data capture. |
| Global Acne Grading System assessment sheet | Study team | Not applicable | Used to assess acne severity at baseline, after three treatment courses, and after six treatment courses. |
| Acne Disability Index questionnaire | Study team | Not applicable | Used to assess acne-related quality-of-life impairment. |
| Vancouver Scar Scale assessment sheet | Study team | Not applicable | Used to assess scar pigmentation or color, vascularity, pliability, and thickness during follow-up. |
| ECCA acne scar scoring sheet | Study team | Not applicable | Used to assess post-acne scar burden during follow-up. |
| Clinical laboratory safety tests | Clinical laboratory, Fifth People’s Hospital of Changshu | Analyzer model and reagent batch numbers recorded from the hospital laboratory system | Used for liver function, renal function, and blood lipid monitoring at baseline, after three treatment courses, and after six treatment courses. |
| Statistical analysis software | IBM / SPSS Inc. | SPSS Statistics version 13.0 | Used for independent-samples t tests, chi-square tests, Fisher’s exact tests, rank-sum tests, and analysis of variance. |
Referencias
- Hill, D. A., Grundmeier, R. W., Ram, G., Spergel, J. M. The epidemiologic characteristics of healthcare provider-diagnosed eczema, asthma, allergic rhinitis, and food allergy in children: a retrospective cohort study. BMC Pediatr. 16, 133 (2016).
- Ansotegui, I. J., et al. IgE allergy diagnostics and other relevant tests in allergy, a World Allergy Organization position paper. World Allergy Organization Journal. 13 (2), 100080 (2020).
- Bousquet, J., et al. Practical guide to skin prick tests in allergy to aeroallergens. Allergy. 67 (1), 18-24 (2012).
- Tourlas, K., Burman, D. Allergy testing. Primary Care. 43 (3), 363-374 (2016).
- Nokkaew, S., et al. Impact of age and allergen type on sensitization changes in children with chronic rhinitis. International Journal of Pediatric Otorhinolaryngology. 196, 112508 (2025).
- Huang, Z., et al. Multicenter study of seasonal and regional airborne allergens in Chinese preschoolers with allergic rhinitis. Scientific Reports. 14 (1), 4754 (2024).
- Muthupalaniappen, L., Jamil, A. Prick, patch or blood test? A simple guide to allergy testing. Malaysian Family Physician. 16 (2), 19-26 (2021).
- Heinzerling, L., et al. The skin prick test–European standards. Clinical and Translational Allergy. 3 (1), 3 (2013).
- Lee, E., et al. Longitudinal trajectories of allergen sensitization in children with different transcriptome profiles from the COCOA study. Allergology International. 75 (2), 218-230 (2026).
- Ha, E. K., et al. Association of polysensitization, allergic multimorbidity, and allergy severity: a cross-sectional study of school children. International Archives of Allergy and Immunology. 171 (3-4), 251-260 (2016).
- Zhao, Z., et al. Allergen sensitization patterns in children with allergic rhinitis: insights from a four-year retrospective study in Shenzhen, China. BMC Pediatrics. 25 (1), 544 (2025).
- Bernstein, I. L., et al. Allergy diagnostic testing: an updated practice parameter. Annals of Allergy, Asthma & Immunology. 100 (3 Suppl 3), S1-S148 (2008).
- Zarei, M., et al. Optimal skin prick wheal size for diagnosis of cat allergy. Annals of Allergy, Asthma & Immunology. 92 (6), 604-610 (2004).
- Bakır, D. B., et al. Demographics and clinical features of pediatric patients with allergic rhinitis: a single-center study from Western Turkey. BMC Pediatrics. 25 (1), 170 (2025).
- Hummel, M., Edelmann, D., Kopp-Schneider, A. Clustering of samples and variables with mixed-type data. PLoS One. 12 (11), e0188274 (2017).
- Shipe, M. E., Deppen, S. A., Farjah, F., Grogan, E. L. Developing prediction models for clinical use using logistic regression: an overview. Journal of Thoracic Disease. 11 (Suppl 4), S574-S584 (2019).
- Sheehan, W. J., et al. Age-specific prevalence of outdoor and indoor aeroallergen sensitization in Boston. Clinical Pediatrics. 49 (6), 579-585 (2010).
- Yildiz, Y. K., Yaytokgil, S. B., Vezir, E. Evaluation of clinical and demographic characteristics in children with aeroallergen sensitization: a study based on skin prick test results. Allergologia et Immunopathologia. 53 (6), 46-54 (2025).
- Guan, K., et al. Prevalence of sensitization to aeroallergens in children in the greater Beijing region with respiratory allergy. Frontiers in Pediatrics. 10, 848357 (2022).
- Custovic, A., Custovic, D., Fontanella, S. Understanding the heterogeneity of childhood allergic sensitization and its relationship with asthma. Current Opinion in Allergy and Clinical Immunology. 24 (2), 79-87 (2024).
- Asarnoj, A., et al. Sensitization to inhalant allergens between 4 and 8 years of age is a dynamic process: results from the BAMSE birth cohort. Clinical & Experimental Allergy. 38 (9), 1507-1513 (2008).
- Editorial Committee of the Nasal Medicine and Pediatric Subspecialty, Chinese Society of Otorhinolaryngology Head and Neck Surgery. Guideline for diagnosis and treatment of pediatric allergic rhinitis 2022 revision. Chinese Journal of Otorhinolaryngology Head and Neck Surgery. 57 (4), 392-404 (2022).
- Sitarik, A. R., et al. Phenotypes of atopic dermatitis and development of allergic diseases. JAMA Network Open. 8 (6), e2515094 (2025).