Here, a retrospective electronic health record workflow for evaluating the use of adjunctive Danshen injection after acute myocardial infarction is described. An archived cohort of 89 patients illustrates the analyses that are executable; however, the unavailability of source information limits verification and prevents causal interpretation of the treatment associations.
Artículo de método
A Pilot Retrospective Electronic Health Record Workflow for Evaluating Adjunctive Danshen Injection After Acute Myocardial Infarction
En este artículo
Resumen
Resumen
Danshen injection is used as an adjunctive cardiovascular therapy in some Chinese hospitals, but retrospective evaluations are vulnerable to exposure misclassification, nonuniform measurement timing, baseline imbalance, complete-case selection, and time-related bias. This article presents an audit-ready electronic health record workflow for adults with acute myocardial infarction who underwent percutaneous coronary intervention and received inpatient aspirin plus clopidogrel. The workflow adds TCM-specific fields for syndrome differentiation, indication, prescriber specialty, product formulation, and administration timing; separates outcome-specific analysis sets; and defines propensity-score overlap weighting for the population with clinical equipoise. An archived 89-patient cohort (45 with documented Danshen administration and 44 controls) illustrates the analytical sequence. In the archived file, only analysis-file checks, model fitting, balance diagnostics, bootstrap estimation, and visualization could be executed. Source-record steps requiring unrecovered treatment timestamps, echocardiographic metadata, assay boundaries, exact exclusion variables, or adjudicated events are presented as workflow specifications and were not treated as completed procedures. The groups were strongly imbalanced at baseline. In the primary ANCOVA using HC3 standard errors, the adjusted between-group difference in pre-discharge left ventricular ejection fraction was 6.82 percentage points (95% confidence interval, 4.54–9.10). The separate overlap-weighted estimate was 6.95 percentage points (patient-level bootstrap standard error: 1.08; 95% percentile confidence interval: 4.90–9.07; 2,000 resamples). These estimates are numerical demonstrations rather than causal treatment effects. Database-coded cardiovascular and bleeding indicators were excluded because component events, dates, follow-up completeness, and a common time origin could not be verified. The workflow has not been externally validated and should be considered a pilot demonstration.
Introducción
Acute myocardial infarction remains a major cause of death, heart failure, recurrent ischemic events, and long-term disability. Current treatment focuses on rapid diagnosis, timely reperfusion, percutaneous coronary intervention when appropriate, antithrombotic therapy, intensive lipid lowering, and secondary prevention. Although these strategies have improved early survival, many patients still develop left ventricular dysfunction, microvascular damage, hemodynamic instability, and an inflammatory response after myocardial injury1,2,3,4. Recovery after myocardial infarction cannot be assessed by a single measure. Left ventricular ejection fraction is commonly used to evaluate systolic function and is often reassessed before discharge5,6. Ventricular dimensions and N-terminal pro-B-type natriuretic peptide provide additional information on cardiac loading and early recovery, while inflammatory markers reflect the response to myocardial injury and reperfusion. These measurements, however, can vary with sampling time, treatment, loading conditions, renal function, assay performance, and the timing of repeat testing7,8,9.
Danshen, derived from Salvia miltiorrhiza, is used as an adjunctive cardiovascular treatment in some Chinese hospitals. Experimental and clinical literature describes possible effects on oxidative stress, inflammation, endothelial function, apoptosis, platelet activity, and microcirculation10,11,12,13,14. Retrospective studies must nevertheless distinguish documented product exposure from syndrome-guided TCM care. They should capture the TCM syndrome diagnosis, the basis for syndrome differentiation, the clinical indication, prescriber specialty, approved product indication, formulation, dose, route, timing, and adverse-reaction monitoring. If these fields are absent, the study evaluates the use of a TCM-derived product within a Western biomedical disease pathway; it does not evaluate individualized treatment based on Bian Zheng.
Electronic health records make it possible to study inpatient treatment patterns and repeated clinical measurements in routine practice. Within the same hospitalization, they can link medication administration, echocardiography, laboratory tests, procedural details, and clinical outcomes. However, retrospective analyses have important limitations. Treatment exposure may be misclassified, measurements may be taken at different times, and complete-case selection can introduce bias. Treatment choice is also influenced by clinical condition, and therapies started after admission can create time-related bias. Assay floor values and small numbers of composite events add further uncertainty that may not be apparent from summary tables alone15,16.
The individual analytical methods used here are established. The distinctive contribution is their integration into a single filmable, audit-ready sequence for heterogeneous injectable TCM exposures: source-record verification of administered products; explicit capture of syndrome and indication variables; a common time-zero rule; paired-measurement selection; outcome-specific cohorts; overlap-population diagnostics; patient-level visualization; and a final numerical audit. A video can show the steps that are difficult to reproduce from prose alone, including how a synthetic source record becomes an exposure record, how paired echocardiograms are selected, how exclusions are assigned, and how balance and output checks are performed.
The goal is to present a pilot workflow for a single-center retrospective evaluation of adjunctive Danshen injection among patients with acute myocardial infarction treated with percutaneous coronary intervention and dual antiplatelet therapy between August 2022 and December 2025. The intended users are clinical investigators, pharmacists, data managers, cardiologists, TCM clinicians, and statisticians who need to audit heterogeneous inpatient exposure. The primary numerical illustration is pre-discharge left ventricular ejection fraction after adjustment for the admission value and clinically selected prognostic covariates. Secondary cardiac and biomarker analyses are exploratory. Unverified database-coded cardiovascular and bleeding indicators are excluded from the representative results.
Protocolo
This retrospective study was conducted in the Department of Cardiology at Qidong New District Hospital and was reviewed and approved by the Ethics Committee of Qidong New District Hospital on July 11, 2026 (approval No. qdxqyy-0503). The Ethics Committee waived the requirement for written informed consent because this was a retrospective analysis of de-identified records. The principal investigator and corresponding author is a cardiologist. Patient-level records were de-identified before analysis; the re-identification key was stored separately within the institution's approved secure environment, and access was limited to authorized personnel. Percutaneous coronary intervention was performed onsite. Clinical data were extracted from the inpatient electronic medical record, procedural data from cardiac catheterization records, echocardiographic measurements from echocardiography reports, laboratory results from the laboratory information system, and treatment exposure from medication-order and administration records. The study was designed and performed by the corresponding author, a cardiologist; no additional cardiologists, echocardiographers, statisticians, pharmacists, or TCM specialists participated. The complete target workflow comprises Steps 1–9. The archived 89-patient file was used only for components whose retained variables could be used. Source-record verification of exclusion variables, complete exposure timing, standardized echocardiographic timing and methods, assay-boundary handling, and clinical-event adjudication could not be completed from the frozen file; these elements are therefore specified as requirements for future implementation and are not reported as procedures completed in the archived cohort. See the Table of Materials for the materials, equipment, and software associated with this workflow.
1. Define the study specification and data dictionary
- Prespecify the study window, index hospitalization, target population, exposure definition, primary and secondary outcomes, covariates, missing-data rules, and statistical estimands before comparing treatment groups.
- Prepare a data dictionary for all variables, including the source system, definition, unit, permitted values, timing, and handling of missing data.
- Define the start and end dates of the study period. Check the admission date of each screened record against the hospital screening log.
NOTE: The archived single-center pilot cohort covered hospitalizations from August 2022 to December 2025 at Qidong New District Hospital.
2. Identify candidate hospitalizations and apply eligibility criteria
- Query the electronic health record or discharge database for adult hospitalizations with a confirmed diagnosis of ST-segment elevation or non-ST-segment elevation acute myocardial infarction.
- Retain the first eligible hospitalization for each patient during the study window. Record repeat admissions separately and do not count them as independent index cases.
- Define the primary LVEF analysis set as eligible patients who underwent percutaneous coronary intervention, received inpatient aspirin plus clopidogrel, and had admission and pre-discharge LVEF measurements within prespecified common windows together with covariates required for the primary model. Do not require completion of a minimum hospital stay because that criterion can be conditioned on post-admission survival and length of stay.
- Exclude patients from the primary analysis only for prespecified clinical criteria or missing data required for the primary outcome model. Do not exclude a patient from the primary LVEF analysis solely because a secondary biomarker is missing.
- Create a de-identified record-level screening log with one primary exclusion reason per record. For every missing-data exclusion, identify the exact variable and whether it was required for the primary model or only for a secondary analysis.
- Preserve the screened denominator, exclusion counts, and final analytic sample for the cohort-flow figure.
- Construct outcome-specific analysis sets. Use the primary LVEF cohort for the main numerical illustration and biomarker-specific available-case cohorts for each paired laboratory outcome.
- Create a clinical-event cohort only after a common time origin, component-level event adjudication, and complete outcome ascertainment have been verified. Report the denominator for every analysis.
3. Verify dual antiplatelet therapy and classify Danshen exposure
- Review the medication administration record and verify actual inpatient administrations of aspirin and clopidogrel. Do not classify treatment from medication orders alone.
- Search generic names, exact product names, formulations, concentration, route, formulary codes, manufacturers, lot numbers when available, orders, and administration records.
- Classify exposure from actual administration, not from an order or completion of a planned 5–7-day course.
- Record the exact first administration time, approved indication, TCM syndrome diagnosis, prescriber specialty, preparation name, composition or concentration, route, diluent, infusion procedure, daily dose, number of administrations, duration, manufacturer, lot number when available, interruptions, discontinuation rules, final administration time, and adverse-reaction monitoring.
- Define eligibility, treatment assignment, and follow-up from a common baseline or prespecified landmark. Identify events and measurements that precede the first Danshen administration.
- When complete medication timestamps are available, use a time-varying exposure model or a common-landmark analysis. A patient must not be assigned to the exposed group if they survived long enough to complete treatment.
NOTE: The archived analytical file recorded daily doses of 40–60 mL, durations of 5–7 days, and three manufacturers. It did not retain the complete formulation, concentration, route, approved indication, initiation criterion, discontinuation rule, or adverse-reaction monitoring fields required to treat these products as a uniform intervention. The pilot analysis, therefore, represents documented use of a heterogeneous Danshen injection class. Product-specific or dose-response inference is not supported by this sample. - Determine whether syndrome differentiation was performed before treatment. Extract the syndrome name, diagnostic elements, clinician, date, and relationship to the treatment decision.
- If no structured or narrative evidence exists, record syndrome differentiation as not captured and do not characterize the study as an evaluation of syndrome-guided TCM care.
- Verify the approved product indication, contraindications, institutional formulary status, and the clinical and ethical basis for use with percutaneous coronary intervention and dual antiplatelet therapy.
- Record whether a TCM clinician participated in prescribing or study design. Do not infer this participation from product use alone.
4. Extract baseline clinical and procedural variables
- Extract age, sex, body mass index, smoking, hypertension, diabetes, hyperlipidemia, previous myocardial infarction, infarction type, culprit vessel, Killip class, and multivessel disease.
- Extract symptom-to-balloon time, door-to-balloon time, pre- and post-procedure thrombolysis in myocardial infarction flow grade, stent number, admission cardiac function, peak cardiac troponin, renal function, and concomitant cardiovascular medications.
- Retain the original source field, collection time, and unit for audit. Do not overwrite source values during cleaning; create separate analysis variables.
5. Select paired echocardiographic and laboratory measurements
- Identify the earliest eligible echocardiogram after admission and the last eligible examination before discharge. Extract left ventricular ejection fraction, end-diastolic diameter, and end-systolic diameter.
- Prespecify common eligibility windows for the admission and pre-discharge echocardiograms.
- Record the interval from admission and PCI to each examination, the LVEF quantification method, equipment, transducer, software version, image-quality criteria, reader identity and experience, treatment blinding, and whether the same method was used at both examinations.
- If these essential fields cannot be verified, label the analysis as a numerical demonstration and do not interpret the between-group estimate as a clinical effect.
- Select the earliest eligible admission result and the last eligible pre-discharge result for high-sensitivity C-reactive protein, interleukin-6, tumor necrosis factor-alpha, and N-terminal pro-B-type natriuretic peptide.
- Verify specimen times and units. Do not combine results reported in different units without a documented conversion. Calculate change as the pre-discharge value minus the admission value.
- Identify assay-boundary and database-floor values before transformation. Record the platform, assay, reportable range, lower limit of quantification, unit, and below-limit coding rule.
- Apply a prespecified rule and repeat the analysis under defensible alternative rules. Do not treat repeated boundary codes as exact quantitative measurements.
6. Ascertain clinical outcomes
- Before final clinical-event analysis, retrieve and adjudicate each source-record event using a prespecified four-component MACE definition: cardiovascular death, nonfatal recurrent myocardial infarction, nonfatal ischemic stroke, or unplanned ischemia-driven coronary revascularization. A binary database composite field without component-level documentation is insufficient to establish an adjudicated endpoint.
- Record every MACE component, event date and time, supporting source document, adjudication decision, and reviewer identity. Count each patient once within an analysis window, based on the first qualifying event.
- Record all-cause death separately and classify bleeding according to the highest Bleeding Academic Research Consortium grade during the same window.
- Apply a common and verifiable time origin to both treatment groups. Define the in-hospital window from admission through discharge.
- Define the 30-day window from the same calendar landmark in both groups, preferably discharge when post-discharge follow-up is available. Do not label a database variable as 30-day post-treatment unless the event dates and treatment landmarks have been verified.
- When a treatment-initiation landmark sensitivity analysis is feasible, apply the same landmark eligibility rule to both groups, include only patients alive, event-free, and under observation at that landmark, and report all pre-landmark exclusions.
- Re-estimate the risk set rather than assigning a fixed reference day only to the control group.
- Resolve contradictions between composite and component fields against the source record. Retain the adjudication decision, event date, supporting documentation, and reviewer identity in an audit log.
- Until this audit is complete, report the available binary fields as database-coded indicators rather than as validated MACE endpoints.
7. De-identify, clean, and freeze the analytic dataset
- Replace direct identifiers with study identifiers and store the re-identification key separately in the approved secure environment.
- Check duplicate hospitalizations, group sizes, variable types, units, missingness, date order, physiologic ranges, paired-measurement availability, and consistency between event fields.
- Review extreme and boundary values against the source records. Document every correction in a data query log and preserve the original value.
- Freeze a read-only analysis dataset before generating tables, figures, or manuscript numbers. Record the file version and analysis-code version.
8. Perform the statistical analysis
- Summarize approximately symmetric variables as mean ± standard deviation, skewed variables as median [interquartile range], and categorical variables as count and percentage. Describe baseline imbalance with standardized mean differences.
- Fit an analysis of covariance (ANCOVA) model with pre-discharge LVEF as the dependent variable. Include treatment group, admission LVEF, age, sex, diabetes, multivessel disease, Killip class III/IV, and log-transformed admission NT-proBNP.
- Select covariates on clinical grounds before model fitting. Avoid data-driven variable selection in the small pilot sample, and interpret the treatment coefficient as an adjusted association.
NOTE: Admission LVEF represents baseline cardiac function. Age, sex, diabetes, multivessel disease, and Killip class III/IV represent clinical prognostic factors. Admission NT-proBNP represents heart-failure severity; log transformation reduces its skewness. - Compute heteroscedasticity-consistent (HC3) standard errors for the primary ANCOVA and linear sensitivity models using vcovHC(fit, type = "HC3") from the sandwich package in R.
- Obtain coefficient tests and confidence intervals with coeftest() and coefci() from the lmtest package, using the HC3 covariance matrix. Archive the executable analysis script, including data preparation.
NOTE: The archived analysis used R version 4.5.2, sandwich version 3.1.1, and lmtest version 0.9.40. The executable analysis script, including data preparation, is archived as supplementary material. - Inspect residuals, leverage (hat values), externally studentized residuals, and Cook's distance. Archive the diagnostic outputs.
- Flag observations with a hat value > 2p/n, an absolute externally studentized residual above the 97.5th percentile of the relevant t distribution, or Cook's distance > 4/n. Define n as the number of analyzed observations and p as the number of fitted coefficients, including the intercept.
- Repeat the primary model using a natural cubic spline with 3 degrees of freedom for admission LVEF. Retain the remaining covariates and HC3 standard errors.
- Repeat the primary model after excluding observations with Cook's distance > 4/n. Report the number excluded and compare the sensitivity estimate with the primary estimate.
NOTE: The archived primary estimate was 6.82 percentage points (HC3 95% CI, 4.54–9.10; p < 0.001). With nonlinear admission LVEF, the estimate was 7.08 percentage points (95% CI, 4.79–9.36; p < 0.001).
NOTE: Excluding four influential observations yielded an estimate of 7.69 percentage points (95% CI, 5.61–9.77; p < 0.001). These results illustrate adjusted associations and do not establish a causal treatment effect. - Analyze secondary continuous outcomes with analogous baseline-adjusted models. Log-transform high-sensitivity C-reactive protein, interleukin-6, tumor necrosis factor-alpha, and N-terminal pro-B-type natriuretic peptide, and report ratios of adjusted geometric means.
- Estimate the probability of documented Danshen administration with a logistic regression model. Include an intercept and main effects for age, male sex, body mass index, current smoking, diabetes mellitus, multivessel disease, Killip class III/IV, ST-segment elevation myocardial infarction, admission LVEF, log-transformed admission NT-proBNP, and estimated glomerular filtration rate.
- Enter continuous propensity-score covariates as linear terms and code binary covariates as 0/1. Fit the specified model without interaction terms, splines, variable selection, trimming, or post-fit calibration.
- Assign overlap weights of 1 − e(X) to Danshen-treated patients and e(X) to controls, where e(X) is the fitted propensity score. Estimate the between-group difference for the overlap population.
NOTE: The estimand is the quantity the analysis aims to estimate: the average treatment effect in the overlap population. This population emphasizes patients with covariate profiles compatible with either treatment. In the archived cohort, unresolved biases limit the result to an adjusted association. - Assess positivity and overlap using group-specific propensity scores and weight distributions, numerical summaries, and empirical common support. Count observations outside the common propensity-score range.
NOTE: Propensity scores ranged from 0.198 to 0.945 in the Danshen group and from 0.093 to 0.811 in controls. Overlap weights ranged from 0.055 to 0.802 and from 0.093 to 0.811, respectively.
NOTE: The empirical common propensity-score range was 0.198–0.811; 9 treated patients and 4 controls were outside it. No score was below 0.05 or above 0.95, and no trimming was performed. Tail separation indicated limited overlap. - Report the effective sample size for each group, calculated as (Σw)2/Σw2, and absolute standardized mean differences before and after weighting.
NOTE: Effective sample sizes were 35.8 in the Danshen group and 37.1 in controls. Exact balance of modeled covariates is an algebraic property of overlap weighting; it does not establish randomization, absence of unmeasured confounding, model validation, or external validity. - Prespecify the number of bootstrap resamples and record a fixed random seed. Draw patient-level nonparametric bootstrap samples with replacement, each containing the same number of records as the analysis cohort.
NOTE: The archived analysis used 2,000 bootstrap resamples, each of size 89, with random seed 20260701. - Refit the complete propensity-score model in each bootstrap sample. Recalculate the overlap weights and re-estimate the between-group difference for the overlap population.
- Calculate the bootstrap standard error as the standard deviation of successful replicate estimates. Obtain the percentile 95% confidence interval from the 2.5th and 97.5th percentiles of the bootstrap distribution.
- Record the number of successful resamples and any convergence warnings.
NOTE: All 2,000 resamples in the archived analysis succeeded without convergence warnings. - Perform a treatment-timing analysis only after complete medication timestamps are recovered. Use a common exposure-assignment time or a time-varying model.
- Remove post-exposure labels from measurements and events that occurred before treatment initiation. Report all landmark exclusions. If timestamps cannot be recovered, state that the immortal-time bias remains unresolved and do not make a causal claim.
- Analyze cardiovascular and bleeding outcomes only after component-level source adjudication, verified event dates, a common time origin, and complete follow-up.
- Omit unverified cardiovascular and bleeding indicators from the representative results and figures until the required verification is complete.
- Use two-sided tests with p < 0.05 for the primary numerical illustration. Label all secondary analyses as exploratory and do not imply multiplicity control.
- Report confidence intervals as the primary measure of precision. Describe how cohort size was determined, and record all software and package versions.
NOTE: The archived cohort size was determined by the available records; no prospective sample size calculation was performed.
9. Generate outputs and complete a numerical audit
- Generate the cohort-flow diagram directly from the screening log. Display the screened population, exclusions with one primary reason per record, treatment-group allocation, follow-up completion, and final analysis counts.
- Plot admission and pre-discharge left ventricular ejection fraction by treatment group and display individual changes in ejection fraction. Show individual observations together with medians, interquartile ranges, and group means.
- Plot high-sensitivity C-reactive protein and N-terminal pro-B-type natriuretic peptide at admission and before discharge on logarithmic axes so that skewed distributions and group overlap remain visible.
- Generate a balance plot that displays absolute standardized mean differences before and after propensity-score overlap weighting. Display reference lines at 0.10 and 0.20, report the effective sample size, and interpret the plot as a diagnostic rather than a significance test.
- Demonstrate the end-to-end workflow in the video using a synthetic record: source-system review, exposure and syndrome-field capture, paired-measurement selection, analysis-set construction, model fitting, overlap diagnostics, and numerical audit. Do not display patient identifiers or unverified clinical-event results.
- Deposit the reproducibility package before resubmission. Include a data dictionary, eligibility algorithm, event-adjudication form, synthetic dataset, extraction pseudocode or SQL, complete scripts, software versions, random seeds, and a one-command or stepwise regeneration guide. Cite the persistent identifier in the Data Availability section.
Resultados
Analytic cohort and exposure
The archived screening log contained 112 potentially eligible records. Twenty-three were excluded: 15 were labeled as missing key variables, and 8 as prior exposure to Danshen products. The frozen analytical file did not retain the exact set of missing variables, their frequencies by treatment group, or sufficient information to compare included and excluded patients. Multiple imputation was not performed because the missingness pattern and affected variables could not be reconstructed from the available file. The 89-patient dataset (45 with documented Danshen administration and 44 controls) is therefore used only as an archived pilot cohort. The analytical file also lacked structured TCM syndrome-differentiation fields, an approved-indication field, and a verified prescriber-specialty field. The workflow cannot determine whether treatment was based on Bian Zheng or whether a TCM specialist participated. Among exposed patients, recorded doses were 40, 50, or 60 mL/day, and recorded durations were 5, 6, or 7 days; exact formulations and initiation criteria require source verification (Figure 1; Table 1).
Source-verification status
The frozen analytical file contained complete values for the variables displayed in Table 2 and Table 3 for all 89 records (45 in the DAPT-plus-Danshen group and 44 controls). Completeness at the analysis-file level did not establish source-record verification. The file did not preserve the identities of the missing variables that led to screening exclusions, complete medication-administration timestamps, echocardiographic intervals, and acquisition metadata, assay platforms and reporting limits, or component-level clinical-event documentation. Accordingly, the reported numerical analyses comprise analysis-file checks, model fitting, diagnostics, bootstrap estimation, and visualization. Treatment-timing, imaging-standardization, assay-boundary, and event-adjudication procedures remain unexecuted requirements for a future fully verified dataset.
Baseline characteristics
The archived pilot groups were not well balanced at baseline (Table 2; Figure 2). The largest absolute unweighted standardized mean differences were observed for body mass index (0.572), diabetes (0.536), age (0.519), multivessel disease (0.472), current smoking (0.459), Killip class III/IV (0.455), admission LVEF (0.397), and log-transformed admission NT-proBNP (0.387). Propensity scores ranged from 0.198 to 0.945 in the Danshen group and from 0.093 to 0.811 in controls; the corresponding overlap weights ranged from 0.055 to 0.802 and from 0.093 to 0.811. The empirical common propensity-score range was 0.198–0.811, with 9 treated patients and 4 controls outside this range; no score was below 0.05 or above 0.95 (Supplementary Figure 1; Supplementary Tables 1–2). After overlap weighting, modeled covariates had absolute standardized mean differences below 0.001 by construction; effective sample sizes were 35.8 and 37.1. These diagnostics characterize the overlap population and do not resolve unmeasured confounding, model misspecification, prescribing preference, or treatment-timing bias.
Primary outcome
In the archived pilot cohort, mean LVEF changed from 45.6% to 53.3% in the Danshen group and from 42.2% to 43.2% in controls (Figure 3A–B and Figure 4). The mean change was 7.7 versus 1.0 percentage points. These values illustrate the paired-measurement and plotting workflow. They should not be interpreted as evidence of efficacy because the groups were not randomized and the frozen file did not retain complete treatment timestamps, echocardiographic windows, quantification methods, reader information, or all clinically relevant prescribing factors.
In the primary ANCOVA adjusting for admission LVEF, age, sex, diabetes, multivessel disease, Killip class III/IV, and log-transformed admission NT-proBNP, the adjusted between-group difference in pre-discharge LVEF was 6.82 percentage points (HC3 95% CI, 4.54–9.10; p < 0.001). The estimate was 7.08 percentage points (95% CI, 4.79–9.36; p < 0.001) when a nonlinear effect of admission LVEF was allowed and 7.69 percentage points (95% CI, 5.61–9.77; p < 0.001) after four influential observations were excluded. In a separate overlap-weighting analysis, the estimated difference for the overlap population was 6.95 percentage points. Across 2,000 patient-level bootstrap resamples, the bootstrap mean was 6.99, the standard error was 1.08, and the percentile 95% confidence interval was 4.90–9.07; the complete propensity-score model was refitted, and the overlap weights were recalculated in every resample (Supplementary Figure 2). The agreement between these analyses does not remove residual confounding, regression-to-the-mean concerns, measurement-timing bias, or immortal-time bias, and the workflow has not been validated in an independent dataset. These numerical associations should not be used to support a treatment recommendation or to infer efficacy.
Secondary cardiac and biomarker outcomes
Adjusted differences in ventricular dimensions and exploratory biomarker outcomes were not statistically significant (Table 3; Figure 5A–B). The raw biomarker distributions were skewed and overlapped substantially. Repeated apparent floor values were present, but assay platforms, reportable ranges, and below-limit coding rules were not retained. These analyses are included only to demonstrate outcome-specific data handling and require source-system verification before clinical interpretation.
Clinical outcomes and bleeding: excluded pending source adjudication
The archived database-coded cardiovascular and bleeding indicators were not analyzed or displayed. Component events, event dates, follow-up completeness, and a common time origin could not be verified from the frozen analytical file. The revised workflow requires source adjudication before any clinical-event estimate is reported.
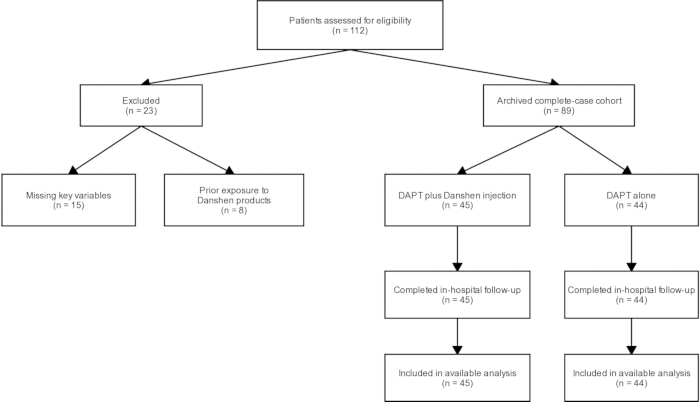
Figure 1: Archived cohort identification and pilot analysis set. Of 112 screened records, 15 were labeled as missing key variables and 8 as prior exposure to Danshen products. The exact missing variables were not retained in the frozen analytical file. The resulting 89-patient dataset is an archived pilot cohort and not a verified outcome-specific cohort. Please click here to view a larger version of this figure.
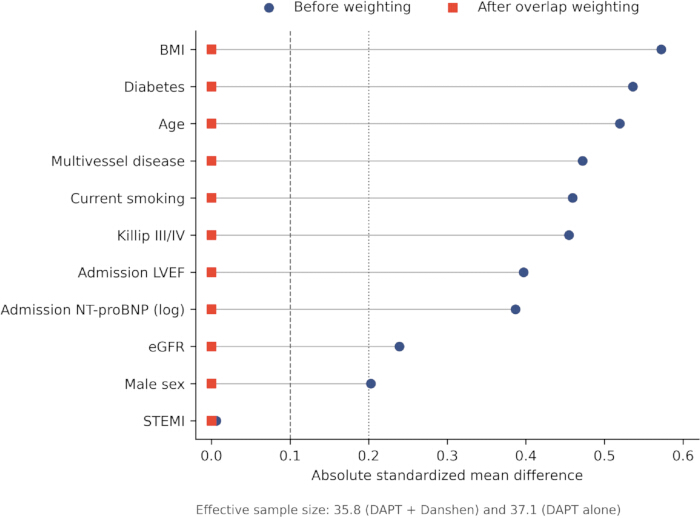
Figure 2: Covariate balance before and after propensity-score overlap weighting. Circles show absolute standardized mean differences before weighting, and squares show values after weighting. The target estimand is the average treatment effect in the overlap population. Propensity-score ranges were 0.198–0.945 and 0.093–0.811, corresponding to overlap-weight ranges of 0.055–0.802 and 0.093–0.811 in the Danshen and control groups, respectively. Effective sample sizes were 35.8 and 37.1. Full distributional diagnostics are shown in Supplementary Figure 1 and Supplementary Table 2. The exact balance of modeled covariates is a property of overlap weighting and does not imply randomization or external validation. Please click here to view a larger version of this figure.
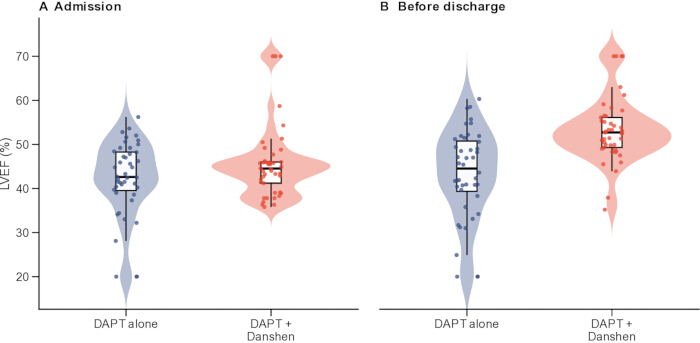
Figure 3: Distribution of admission and pre-discharge left ventricular ejection fraction by treatment group. (A) This panel shows admission values. (B) This panel shows the last eligible pre-discharge values in the archived pilot cohort. The figure is a numerical demonstration; echocardiographic timing and measurement methods require source verification. Please click here to view a larger version of this figure.
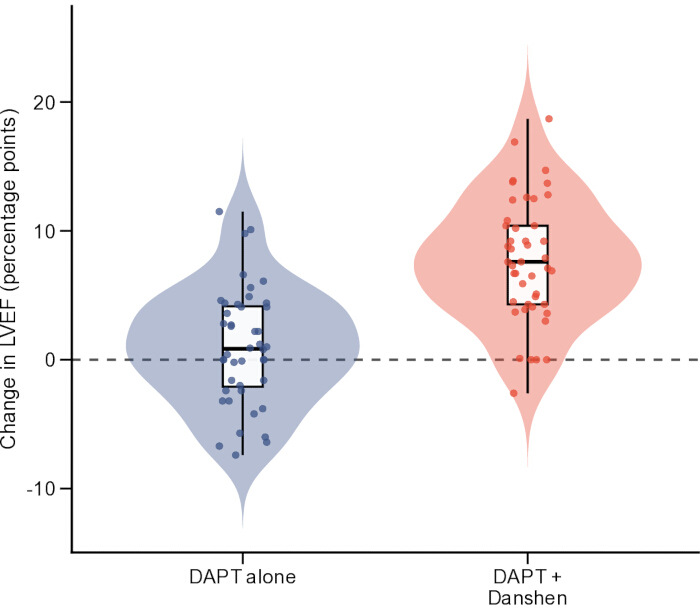
Figure 4: Individual changes in left ventricular ejection fraction from admission to the pre-discharge assessment. Boxes show the median and interquartile range, whiskers extend to 1.5 times the interquartile range, individual points represent patients, and triangles indicate group means. The horizontal reference line indicates no change. Please click here to view a larger version of this figure.
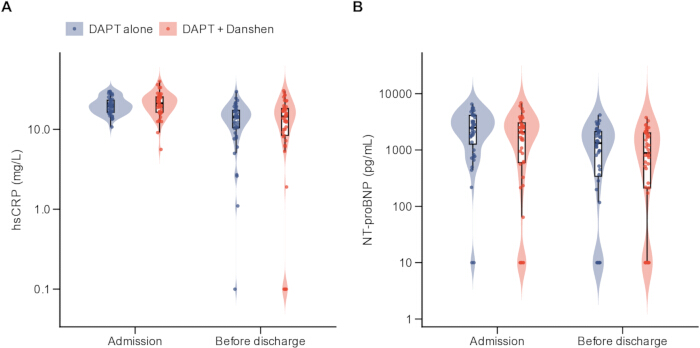
Figure 5: Exploratory biomarker distributions at admission and pre-discharge. (A) shows high-sensitivity C-reactive protein, and (B) shows NT-proBNP on logarithmic axes. Assay platforms, reportable ranges, and below-limit coding rules require source verification. Please click here to view a larger version of this figure.
| Exposure characteristic | Category | n (%) or data status |
| Daily dose | 40 mL | 12 (26.7%) |
| Daily dose | 50 mL | 23 (51.1%) |
| Daily dose | 60 mL | 10 (22.2%) |
| Duration | 5 days | 7 (15.6%) |
| Duration | 6 days | 23 (51.1%) |
| Duration | 7 days | 15 (33.3%) |
| Manufacturer | Chiatai Qingchunbao | 22 (48.9%) |
| Manufacturer | Buchang Pharma | 14 (31.1%) |
| Manufacturer | Tasly | 9 (20.0%) |
| Exact preparation/formulation | Not retained in frozen analytical file | Not available |
| Concentration and route | Not retained in frozen analytical file | Not available |
| Approved indication and treatment-initiation criteria | Not retained in frozen analytical file | Not available |
| Prescriber specialty and TCM syndrome differentiation | Not retained in frozen analytical file | Not available |
| Discontinuation rules and adverse-reaction monitoring | Not retained in frozen analytical file | Not available |
Table 1: Archived Danshen injection exposure records. The table reports dose, duration, and manufacturer fields available in the frozen file. Exact formulation, concentration, route, approved indication, prescriber specialty, initiation criteria, discontinuation rules, and adverse-reaction monitoring require source verification.
| Characteristic | DAPT + Danshen (n = 45) | DAPT alone (n = 44) | SMD (Danshen minus control) | ||
| Age, years | 70.5 ± 10.8 | 76.0 ± 10.2 | -0.52 | ||
| Male sex | 30 (66.7%) | 25 (56.8%) | 0.2 | ||
| Body mass index, kg/m² | 24.1 ± 1.3 | 23.3 ± 1.4 | 0.57 | ||
| Current smoking | 20 (44.4%) | 10 (22.7%) | 0.46 | ||
| Hypertension | 41 (91.1%) | 43 (97.7%) | -0.29 | ||
| Diabetes mellitus | 27 (60.0%) | 37 (84.1%) | -0.54 | ||
| Hyperlipidemia | 24 (53.3%) | 22 (50.0%) | 0.07 | ||
| Previous myocardial infarction | 3 (6.7%) | 4 (9.1%) | -0.09 | ||
| ST-segment elevation myocardial infarction | 42 (93.3%) | 41 (93.2%) | 0.01 | ||
| Multivessel disease | 15 (33.3%) | 25 (56.8%) | -0.47 | ||
| Killip class III/IV | 9 (20.0%) | 18 (40.9%) | -0.45 | ||
| Admission LVEF, % | 45.6 ± 8.1 | 42.2 ± 8.6 | 0.4 | ||
| Admission NT-proBNP, pg/mL | 2079 [597, 3035] | 2479 [1281, 4114] | -0.39 | ||
| Peak hs-cTnI | 18.82 [6.53, 29.37] | 20.66 [12.84, 31.95] | -0.19 | ||
| Symptom-to-balloon time, h | 5.4 [3.7, 8.3] | 6.2 [4.3, 8.2] | -0.21 | ||
| Door-to-balloon time, min | 68 [54, 87] | 70 [58, 88] | -0.01 | ||
| Estimated glomerular filtration rate, mL/min/1.73 m² | 80.9 ± 24.1 | 75.1 ± 23.8 | 0.24 | ||
| Pre-PCI TIMI flow grade 0–1 | 34 (75.6%) | 34 (77.3%) | -0.04 | ||
| Post-PCI TIMI flow grade 3 | 34 (75.6%) | 40 (90.9%) | -0.41 | ||
| Beta-blocker use | 38 (84.4%) | 35 (79.5%) | 0.13 | ||
| ACE inhibitor or ARB use | 39 (86.7%) | 39 (88.6%) | -0.06 | ||
| Mineralocorticoid receptor antagonist use | 18 (40.0%) | 11 (25.0%) | 0.32 | ||
Table 2: Baseline characteristics of the archived pilot cohort. Data are mean ± standard deviation, median [interquartile range], or n (%). Standardized mean differences describe imbalance and are not significance tests. Signed SMDs are calculated as DAPT plus Danshen minus DAPT alone. Abbreviations: SMD = standardized mean difference; LVEF = left ventricular ejection fraction; NT-proBNP = N-terminal pro-B-type natriuretic peptide; hs-cTnI = high-sensitivity cardiac troponin I; PCI = percutaneous coronary intervention; TIMI = Thrombolysis In Myocardial Infarction; ACE = angiotensin-converting enzyme; ARB = angiotensin receptor blocker.
| Outcome | DAPT + Danshen (n = 45) | DAPT alone (n = 44) | Adjusted effect: DAPT + Danshen vs DAPT alone (95% CI); P value |
| LVEF | Admission: 45.6 ± 8.1 | Admission: 42.2 ± 8.6 | Mean difference 6.82 (HC3 95% CI, 4.54 to 9.10); p < 0.001 |
| Discharge: 53.3 ± 7.4 | Discharge: 43.2 ± 10.2 | ||
| Change: 7.7 ± 4.7 | Change: 1.0 ± 4.5 | ||
| LVEDD | Admission: 48.6 ± 5.8 | Admission: 49.3 ± 6.8 | Mean difference 1.77 (-1.21 to 4.74); p = 0.244 |
| Discharge: 46.8 ± 6.7 | Discharge: 46.0 ± 5.1 | ||
| Change: -1.9 ± 8.3 | Change: -3.3 ± 7.8 | ||
| LVESD | Admission: 31.9 ± 7.7 | Admission: 32.9 ± 8.8 | Mean difference -1.19 (-5.45 to 3.07); p = 0.585 |
| Discharge: 30.4 ± 9.1 | Discharge: 31.6 ± 10.2 | ||
| Change: -1.5 ± 10.5 | Change: -1.2 ± 13.2 | ||
| hs-CRP | Admission: 21.2 [16.4, 25.4] | Admission: 19.8 [16.4, 23.1] | Geometric mean ratio 0.81 (0.41 to 1.61); p = 0.549 |
| Discharge: 14.5 [8.4, 18.2] | Discharge: 14.2 [10.4, 17.3] | ||
| Change: -7.2 [-12.9, -1.3] | Change: -5.2 [-10.8, -0.7] | ||
| Interleukin-6 | Admission: 25.9 [18.5, 28.9] | Admission: 24.0 [19.6, 31.2] | Geometric mean ratio 1.20 (0.82 to 1.75); p = 0.349 |
| Discharge: 19.1 [10.9, 24.9] | Discharge: 16.9 [10.7, 23.2] | ||
| Change: -6.3 [-17.4, 2.6] | Change: -8.5 [-15.8, -3.0] | ||
| TNF-α | Admission: 36.4 [29.8, 41.9] | Admission: 35.5 [32.2, 40.8] | Geometric mean ratio 0.75 (0.42 to 1.36); p = 0.345 |
| Discharge: 26.2 [13.7, 34.0] | Discharge: 25.1 [18.2, 30.2] | ||
| Change: -9.2 [-20.2, 1.3] | Change: -13.8 [-20.5, -4.1] | ||
| NT-proBNP | Admission: 2079 [597, 3035] | Admission: 2479 [1281, 4114] | Geometric mean ratio 1.43 (0.81 to 2.55); p = 0.219 |
| Discharge: 885 [212, 2011] | Discharge: 1326 [344, 2126] | ||
| Change: -904 [-1494, -223] | Change: -1346 [-1890, -603] |
Table 3: Paired cardiac and exploratory biomarker outcomes in the archived pilot cohort. Estimates are numerical demonstrations. Biomarker results require verification of assay platforms, reportable ranges, and boundary-value coding. All estimates are numerical demonstrations from the archived pilot cohort. All displayed outcomes contain 45 DAPT-plus-Danshen records and 44 control records in the frozen analytical file. The LVEF analysis lacks complete timing and measurement metadata. Biomarker analyses lack verified assay platforms, reportable ranges, and boundary-value coding. Secondary outcomes are exploratory and were not adjusted for multiplicity. For the primary LVEF outcome, the adjusted effect is from ANCOVA with HC3 standard errors, adjusting for admission LVEF, age, sex, diabetes, multivessel disease, Killip class III/IV, and log-transformed admission NT-proBNP: 6.82 percentage points (HC3 95% CI, 4.54–9.10; p < 0.001). In a separate, additional overlap-weighting analysis, the ATO estimate was 6.95 percentage points; the patient-level bootstrap standard error was 1.08, and the percentile 95% CI was 4.90–9.07 based on 2,000 resamples. No p value was calculated for the bootstrap ATO analysis.
Supplementary Figure 1: Propensity-score and overlap-weight distributions by treatment group. Histograms display the original 89-patient cohort. The treated overlap weight is 1 − e(X), and the control overlap weight is e(X). The distributions demonstrate useful overlap but separation at the tails; these diagnostics do not establish exchangeability or eliminate residual confounding. Please click here to download this file.
Supplementary Figure 2: Patient-level bootstrap distribution of the overlap-weighted effect on pre-discharge LVEF. The original ATO estimate was 6.95 percentage points. With 2,000 ordinary nonparametric bootstrap resamples and propensity-model refitting in every resample, the bootstrap standard error was 1.08, and the percentile 95% confidence interval was 4.90–9.07. All 2,000 resamples succeeded. Please click here to download this file.
Supplementary Table 1: Propensity-score overlap-weighting diagnostics. Propensity scores ranged from 0.198 to 0.945 in the DAPT plus Danshen group and from 0.093 to 0.811 in the DAPT-alone group. The corresponding overlap weights ranged from 0.055 to 0.802 and from 0.093 to 0.811. The empirical common propensity score range was 0.198–0.811; 9 treated patients and 4 controls fell outside that range. No fitted score was below 0.05 or above 0.95, and no trimming was performed. The overlap-weighted effective sample sizes were 35.8 and 37.1. The exact post-weighting balance of modeled covariates is algebraic and does not imply randomization. Abbreviations: SMD = standardized mean difference; LVEF = left ventricular ejection fraction; NT-proBNP = N-terminal pro-B-type natriuretic peptide; eGFR = estimated glomerular filtration rate; STEMI = ST-segment elevation myocardial infarction. Please click here to download this file.
Supplementary Table 2: Five-number summaries of propensity scores and overlap weights. The table presents the minimum, first quartile, median, third quartile, and maximum values for each treatment group. Please click here to download this file.
Discusión
This article presents a pilot workflow that integrates source verification, TCM-specific exposure characterization, common time-zero rules, paired-measurement selection, outcome-specific cohorts, overlap-population diagnostics, and a numerical audit. The individual statistical methods are established; the practical contribution is the filmable sequence and the audit trail linking each source field to the final output. In the archived cohort, only the components supported by the frozen analytical variables were executed. Steps requiring unavailable timestamps, imaging metadata, assay metadata, screening details, or adjudicated events remain explicit specifications for future implementation.
The archived pilot cohort produced a higher adjusted pre-discharge LVEF estimate in the Danshen group. This is an illustrative association, not evidence that Danshen caused improvement. Strong baseline imbalance, incomplete exposure timing, uncertain echocardiographic timing and method, and unmeasured prescribing factors remain plausible explanations. Independent validation has not been performed17,18. The exploratory secondary outcomes did not identify a clear biological pattern. Ventricular dimensions and biomarkers were not significantly different after adjustment, and the raw distributions overlapped. Apparent assay-floor values further limit interpretation. These results demonstrate why source-specific assay metadata and patient-level plots are necessary before transformed biomarker models are interpreted19,20,21.
Missing covariate information can introduce selection and confounding biases in observational analyses, while incomplete treatment-timing information may additionally introduce immortal-time bias22,23,24. Overlap weighting balanced the modeled baseline variables by construction and retained effective sample sizes of 35.8 and 37.1. The resulting estimand applies to the overlap population with the greatest clinical equipoise, not to all eligible patients. An exact modeled balance does not address unmeasured disease severity, physician preference, frailty, TCM syndrome, or treatment timing, and it is not equivalent to randomization25,26. Unverified cardiovascular and bleeding indicators were not included in the representative results, tables, or figures. This avoids presenting large database-coded differences without component events, dates, complete follow-up, and a shared time origin. The protocol retains an adjudication framework for future datasets27,28,29,30,31.
The workflow may be adapted to other hospitals and inpatient treatments, but transferability requires institution-specific validation of source systems, coding, timing, imaging, and outcome ascertainment. The video adds value by demonstrating operational steps that are difficult to reproduce from a checklist alone. A complete reproducibility bundle should include the data dictionary, eligibility algorithm, event-adjudication form, synthetic demonstration data, extraction pseudocode or SQL, scripts, software versions, random seeds, and instructions for regenerating every output16,32.
This is a small, single-center pilot demonstration based on an archived analytical file. It was not externally validated. Complete source-data verification was not possible for the archived cohort; checks of the frozen analytical file could not establish the accuracy or completeness of the underlying records. The exact missing variables and their group-wise frequencies among excluded patients could not be reconstructed, preventing assessment of complete-case selection bias. Complete Danshen administration timestamps were unavailable, so treatment timing and immortal time bias remain unresolved. LVEF measurement timing, quantification methods, equipment and software, reader identity and experience, treatment blinding, and measurement reproducibility could not be verified. Consequently, the comparability of admission and pre-discharge measurements and of measurements between groups could not be established.
The exact Danshen formulation, concentration, route, approved indication, treatment initiation and discontinuation criteria, and adverse-reaction monitoring were unavailable. Product heterogeneity, incomplete syndrome-differentiation, and prescriber information preclude product-specific and syndrome-specific inference. Biomarker assay platforms, reportable ranges, and boundary-value coding could not be verified, limiting interpretation of the biomarker analyses. Treatment was not randomized, and adjudicated clinical-event information was unavailable. These limitations prevent causal inference and immediate clinical application. The numerical findings should not guide treatment decisions. The workflow should be evaluated prospectively or in a multicenter dataset after all required source fields and quality checks are completed.
Divulgaciones
The author declares no commercial or financial relationships that could be construed as a potential conflict of interest. During manuscript preparation, the author used ChatGPT with Codex (OpenAI, San Francisco, CA, USA) for English-language editing, structural reorganization, statistical consistency checking, and document formatting. The tool was not used to generate or alter patient-level data or to replace clinical or statistical judgment. The author independently reviewed and verified all data, analyses, citations, and statements and remains fully responsible for the accuracy, integrity, and final content of the manuscript. The data dictionary, synthetic demonstration dataset, complete analysis code, and supporting reproducibility materials have been deposited in ScienceDB (https://doi.org/10.57760/sciencedb.011da). The de-identified patient-level analytic dataset has been deposited under controlled access in Zenodo (https://doi.org/10.5281/zenodo.22255799).
Agradecimientos
The author thanks the clinical, pharmacy, echocardiography, laboratory, health information, and data management staff of Qidong New District Hospital for supporting patient care and record retrieval. This work received no specific grant from any funding agency in the public, commercial, or not-for-profit sectors.
Materiales
| Nombre | Empresa | Número de catálogo | Comentarios |
|---|---|---|---|
| Electronic health record system | Not retained in frozen analytical file | System name and version not retained | Eligibility, diagnoses, procedures, and source-record verification |
| Echocardiography reporting archive | Not retained in frozen analytical file | Archive name and version not retained | Paired LVEF, LVEDD, and LVESD retrieval |
| Echocardiography equipment and software | Manufacturer not retained in frozen analytical file | Model, transducer, and software version not retained | LVEF acquisition and quantification |
| Laboratory information system and assays | Developers and assay manufacturers not retained | System, assay platforms, reportable ranges, and lower limits not retained | Laboratory extraction and assay-boundary verification |
| Medication administration record module | Developer not retained in frozen analytical file | Module name and version not retained | Verification of administered aspirin, clopidogrel, and Danshen products |
| Danshen injection products | Chiatai Qingchunbao; Buchang Pharma; Tasly | Exact product names, formulations, concentrations, approval numbers, and routes not retained | Archived exposure doses of 40-60 mL/day for 5-7 days |
| R statistical environment | R Foundation for Statistical Computing | R 4.5.2 | Statistical analysis and reproducible output generation |
| R packages | CRAN package maintainers | ggplot2 3.5.1; dplyr 1.1.4; tidyr 1.3.1; readr 2.1.5; purrr 1.0.2; patchwork 1.3.0; svglite 2.1.3; sandwich 3.1.1; lmtest 0.9.40 | Data cleaning, visualization, and output assembly |
| Secure analysis workstation | Qidong New District Hospital | Institutional secure environment; detailed operating-system, encryption, access-control, and backup configuration not retained in the analytical file | Secure storage and analysis of de-identified records |
Referencias
- Rao SV, O’Donoghue ML, Ruel M. 2025 ACC/AHA/ACEP/NAEMSP/SCAI Guideline for the Management of Patients With Acute Coronary Syndromes. Circulation. 2025;151(13):e771–862.
- Byrne RA, Rossello X, Coughlan JJ. 2023 ESC Guidelines for the Management of Acute Coronary Syndromes. Eur Heart J. 2023;44(38):3720–826.
- Anderson JL, Morrow DA. Acute Myocardial Infarction. N Engl J Med. 2017;376(21):2053–64.
- Roth GA, Mensah GA, Johnson CO. Global Burden of Cardiovascular Diseases and Risk Factors, 1990–2019: Update From the GBD 2019 Study. J Am Coll Cardiol. 2020;76(25):2982–3021.
- Mueller C, McDonald K, de Boer RA. Heart Failure Association of the European Society of Cardiology Practical Guidance on the Use of Natriuretic Peptide Concentrations. Eur J Heart Fail. 2019;21(6):715–31.
- Lang RM, Badano LP, Mor-Avi V. Recommendations for Cardiac Chamber Quantification by Echocardiography in Adults: An Update From the American Society of Echocardiography and the European Association of Cardiovascular Imaging. J Am Soc Echocardiogr. 2015;28(1):1–39.e14.
- Heusch G. Myocardial Ischemia-Reperfusion Injury and Cardioprotection in Perspective. Nat Rev Cardiol. 2020;17(12):773–89.
- Prabhu SD, Frangogiannis NG. The Biological Basis for Cardiac Repair After Myocardial Infarction: From Inflammation to Fibrosis. Circ Res. 2016;119(1):91–112.
- Westman PC, Lipinski MJ, Luger D. Inflammation as a Driver of Adverse Left Ventricular Remodeling After Acute Myocardial Infarction. J Am Coll Cardiol. 2016;67(17):2050–60.
- Li ZM, Xu SW, Liu PQ. Salvia miltiorrhiza Burge (Danshen): A Golden Herbal Medicine in Cardiovascular Therapeutics. Acta Pharmacol Sin. 2018;39(5):802–24.
- Spatz ES, Wang Y, Beckman AL. Traditional Chinese Medicine for Acute Myocardial Infarction in Western Medicine Hospitals in China. Circ Cardiovasc Qual Outcomes. 2018;11(3):e004190.
- Jung I, Kim H, Moon S. Overview of Salvia miltiorrhiza as a Potential Therapeutic Agent for Various Diseases: An Update on Efficacy and Mechanisms of Action. Antioxidants (Basel). 2020;9(9):857.
- Ren J, Fu L, Nile SH, Zhang J, Kai G. Salvia miltiorrhiza in Treating Cardiovascular Diseases: A Review on Its Pharmacological and Clinical Applications. Front Pharmacol. 2019;10:753.
- Wu T, Ni J, Wei J. Danshen Preparations for Acute Myocardial Infarction. Cochrane Database Syst Rev. 2008;(2):CD004465.
- Sherman RE, Anderson SA, Dal Pan GJ. Real-World Evidence—What Is It and What Can It Tell Us? N Engl J Med. 2016;375(23):2293–7.
- Benchimol EI et al. The REporting of studies Conducted using Observational Routinely-collected health Data (RECORD) Statement. PLoS Med. 2015;12(10):e1001885.
- Hernán MA, Robins JM. Using Big Data to Emulate a Target Trial When a Randomized Trial Is Not Available. Am J Epidemiol. 2016;183(8):758–64.
- VanderWeele TJ, Ding P. Sensitivity Analysis in Observational Research: Introducing the E-Value. Ann Intern Med. 2017;167(4):268–74.
- Tardif JC, Kouz S, Waters DD. Efficacy and Safety of Low-Dose Colchicine after Myocardial Infarction. N Engl J Med. 2019;381(26):2497–505.
- Kang DI, Park Y, Seo JH. Time-Dependent Prognostic Effect of High Sensitivity C-Reactive Protein With Statin Therapy in Acute Myocardial Infarction. J Cardiol. 2019;74(1):74–83.
- Zhang X, Yu B, Xu X. Prognostic Role of High-Sensitivity C-Reactive Protein in Acute Myocardial Infarction: Association With In-Hospital Heart Failure and All-Cause Mortality. Front Cardiovasc Med. 2021;8:659446.
- Austin PC, White IR, Lee DS, van Buuren S. Missing Data in Clinical Research: A Tutorial on Multiple Imputation. Can J Cardiol. 2021;37(9):1322–31.
- Leyrat C, Seaman SR, White IR. Propensity Score Analysis With Partially Observed Covariates: How Should Multiple Imputation Be Used? Stat Methods Med Res. 2019;28(1):3–19.
- Suissa S. Immortal Time Bias in Pharmaco-Epidemiology. Am J Epidemiol. 2008;167(4):492–9.
- Li F, Morgan KL, Zaslavsky AM. Balancing Covariates via Propensity Score Weighting. J Am Stat Assoc. 2018;113(521):390–400.
- Li F, Thomas LE, Li F. Addressing Extreme Propensity Scores via the Overlap Weights. Am J Epidemiol. 2019;188(1):250–7.
- Greenland S, Mansournia MA, Altman DG. Sparse data bias: a problem hiding in plain sight. BMJ. 2016;352:i1981.
- Hicks KA et al. 2017 Cardiovascular and Stroke Endpoint Definitions for Clinical Trials. Circulation. 2018;137(9):961–72.
- Thygesen K et al. Fourth universal definition of myocardial infarction (2018). Eur Heart J. 2019;40(3):237–69.
- Mehran R et al. Standardized bleeding definitions for cardiovascular clinical trials: a consensus report from the Bleeding Academic Research Consortium. Circulation. 2011;123(23):2736–47.
- Bosco E, Hsueh L, McConeghy KW, Gravenstein S, Saade E. Major adverse cardiovascular event definitions used in observational analysis of administrative databases: a systematic review. BMC Med Res Methodol. 2021;21(1):241.
- Scola G, Chis Ster I, Bean D. Implementation of Trial Emulation in Medical Research: A Scoping Review. BMC Med Res Methodol. 2023;23:186.