This retrospective cohort study evaluated one-year adverse clinical outcomes in hospitalized patients with chronic coronary syndrome and concomitant chronic obstructive pulmonary disease. The study also developed a risk prediction score incorporating smoking history, previous percutaneous coronary intervention, Global Initiative for Chronic Obstructive Lung Disease grade, and left ventricular ejection fraction.
Artículo de investigación
Prognostic Factors for One-Year Adverse Outcomes in Chronic Coronary Syndrome with Concomitant Chronic Obstructive Pulmonary Disease
En este artículo
Resumen
Resumen
Chronic coronary syndrome (CCS) and chronic obstructive pulmonary disease (COPD) frequently coexist, yet prognostic evidence for patients with both conditions remains limited. This retrospective cohort study evaluated factors associated with one-year adverse clinical outcomes and developed a clinical risk score in 214 hospitalized patients with CCS and concomitant COPD. Baseline clinical and laboratory data were collected, and patients were followed for one year. The primary endpoint was a composite of all-cause death, non-fatal myocardial infarction (MI), rehospitalization for heart failure (HF), or rehospitalization for acute exacerbation of COPD (AECOPD) within one year. Independent prognostic factors were identified using Cox proportional hazards regression analysis. Model performance was evaluated through discrimination, calibration, decision curve analysis, and bootstrap internal validation. During follow-up, 53 patients (24.8%) experienced the composite endpoint, including 7 all-cause deaths (3.3%), 8 non-fatal MIs (3.7%), 17 HF-related rehospitalizations (7.9%), and 21 AECOPD-related rehospitalizations (9.8%). Smoking history (hazard ratio [HR] = 1.962, 95% confidence interval [CI]: 1.093–3.521, P = 0.024), previous percutaneous coronary intervention (PCI) (HR = 2.017, 95% CI: 1.157–3.517, P = 0.013), higher Global Initiative for Chronic Obstructive Lung Disease (GOLD) grade (HR = 1.488, 95% CI: 1.092–2.028, P = 0.012), and lower left ventricular ejection fraction (LVEF) (HR = 0.933, 95% CI: 0.893–0.975, P = 0.002) were independently associated with the composite endpoint. The model demonstrated a concordance index (C-index) of 0.736 and a one-year area under the receiver operating characteristic curve (AUC) of 0.773. Event-free survival differed significantly among the low-, intermediate-, and high-risk groups (log-rank P < 0.001). These findings support integrated cardiovascular and respiratory risk assessment in patients with CCS and COPD. However, external validation is required before the risk score can be recommended for broader clinical application.
Introducción
Cardiovascular disease and chronic obstructive pulmonary disease (COPD) are major causes of mortality and disability worldwide. In 2019, the European Society of Cardiology (ESC) introduced the term chronic coronary syndrome (CCS)1 to replace “stable coronary artery disease,” emphasizing the dynamic nature of coronary artery disease and its diverse clinical presentations. CCS encompasses a range of clinical scenarios associated with atherosclerotic plaque accumulation and coronary circulatory dysfunction, imposing a substantial burden on patients and healthcare systems.
A close epidemiological association exists between COPD and coronary artery disease. Previous studies have demonstrated that patients with COPD have a 1.24-fold higher risk of coronary heart disease than those without COPD2. Among patients with acute coronary syndrome (ACS), the estimated prevalence of COPD ranges from 5% to 18%, with higher prevalence estimates reported when pulmonary function screening is performed3,4. A long-term follow-up study involving patients with coronary heart disease found that those with concomitant COPD had significantly higher five-year all-cause and cardiac mortality rates than those without COPD5. These findings underscore the clinical significance of coexisting COPD and coronary artery disease.
The mechanisms underlying the association between COPD and coronary artery disease remain incompletely understood. Smoking and aging are shared risk factors for both conditions. Additionally, chronic airway inflammation in patients with COPD may contribute to systemic inflammation through the release of inflammatory mediators into the circulation, potentially accelerating atherosclerosis6. Patients with COPD have also been reported to exhibit greater macrophage infiltration and a higher prevalence of thin-cap fibroatheromas in coronary plaques, suggesting a potential association between COPD and coronary plaque vulnerability3. Oxidative stress and endothelial dysfunction may further contribute to the pathophysiological relationship between these conditions7.
Although the prognostic implications of COPD in patients with coronary artery disease have been investigated, most available evidence focuses on patients with ACS, whereas evidence concerning patients with concomitant CCS and COPD remains limited. Differences in disease characteristics and clinical management may restrict the direct applicability of findings from ACS populations to patients with CCS5. Furthermore, few studies have simultaneously evaluated cardiovascular and respiratory outcomes or developed clinical risk stratification tools specifically for this comorbid population.
Therefore, the present study aimed to evaluate one-year adverse clinical outcomes in hospitalized patients with concomitant CCS and COPD using a composite endpoint comprising all-cause death, non-fatal myocardial infarction (MI), rehospitalization for heart failure (HF), and rehospitalization for acute exacerbation of COPD (AECOPD). We hypothesized that baseline characteristics reflecting both cardiovascular and respiratory disease would be associated with the composite endpoint. Cox proportional hazards regression analysis was used to identify prognostic factors and develop a clinical risk score for individualized risk stratification.
Protocolo
This study was approved by the Ethics Committee of the Affiliated Hospital of Inner Mongolia Minzu University (Approval No. NM-LL-2024-11-25-02). The requirement for informed consent was formally waived by the Ethics Committee.
Subjects
This retrospective, single-center cohort study included consecutive patients hospitalized with concomitant CCS and COPD in the Departments of Cardiology and Respiratory Medicine at the Affiliated Hospital of Inner Mongolia Minzu University between January 2022 and October 2023. CCS was diagnosed according to the 2019 ESC guidelines1,8 whereas COPD was diagnosed according to the 2021 GOLD criteria, defined as a post-bronchodilator ratio of forced expiratory volume in one second (FEV₁) to forced vital capacity (FVC) of <70%9. The inclusion criteria were as follows: (1) fulfillment of the diagnostic criteria for both CCS and COPD; (2) age ≥18 years; and (3) availability of complete clinical records. The exclusion criteria were as follows: (1) ACS or AECOPD at admission; (2) severe valvular heart disease, cardiomyopathy, or congenital heart disease; (3) active pulmonary tuberculosis, bronchiectasis, pulmonary fibrosis, or pulmonary malignancy; (4) severe hepatic or renal dysfunction; (5) malignancy or another condition associated with an expected survival of less than one year; and (6) substantial missing clinical data, defined as more than 20% missingness among key variables. Of the 248 patients initially screened, three were excluded because of substantial missing clinical data, as shown in Figure 1. All variables included in the analyses were complete for the final cohort of 214 patients; therefore, no missing-data imputation was required. For patients lost to follow-up, observations were censored at the date of their last known contact, and all available data collected before censoring were retained in the survival analyses.
Baseline Data Acquisition
Baseline data were extracted from the hospital’s electronic medical record system, including the following: (1) demographic and lifestyle characteristics: age, sex, and smoking history; (2) clinical characteristics: history of hypertension and diabetes mellitus, previous PCI, duration of COPD, GOLD grade, and LVEF; (3) laboratory parameters: total cholesterol (TC), triglycerides (TG), low-density lipoprotein cholesterol (LDL-C), high-sensitivity C-reactive protein (hs-CRP), and N-terminal pro-B-type natriuretic peptide (NT-proBNP); and (4) medications prescribed at discharge: β-blockers, statins, antiplatelet agents, angiotensin-converting enzyme inhibitors (ACEIs), angiotensin receptor blockers (ARBs), diuretics, and nitrates. Data accuracy was ensured through a double-entry verification procedure.
Follow-up and Endpoint Events
Patients were followed for one year through outpatient visits and telephone interviews, with the final follow-up date set as October 2024. Survival time was calculated from the date of hospital discharge to the first occurrence of a composite endpoint event, the date of the last documented contact for patients lost to follow-up, or the completion of the one-year follow-up period, whichever occurred first. The primary endpoint was a composite of all-cause death, non-fatal MI, rehospitalization for HF, or rehospitalization for AECOPD within one year. AECOPD events were restricted to episodes requiring hospital readmission. Patients experiencing multiple endpoint components were counted only once in the composite endpoint analysis, with the date of the first qualifying event used to determine the time to event.
Statistical Methods
All statistical analyses were performed using SPSS software (version 26.0). The normality of continuous variables was assessed using the Shapiro–Wilk test (P > 0.05 indicating no statistically significant deviation from normality). Normally distributed continuous variables are presented as the mean ± standard deviation (SD), and between-group comparisons were performed using Student’s t-test. Non-normally distributed continuous variables are expressed as the median (interquartile range [IQR]) and were compared using the Mann–Whitney U test. Categorical variables are presented as frequencies and percentages (n, %) and were compared using the chi-square (χ2) test.
Survival curves were constructed using the Kaplan–Meier method, and differences between risk strata were evaluated using the log-rank test. To identify independent prognostic factors, univariable Cox proportional hazards regression analyses were initially performed. Covariates with P < 0.10 in the univariable analyses were subsequently entered into the multivariable Cox proportional hazards regression model. A backward stepwise selection procedure was applied, with entry and removal thresholds set at α = 0.05 and α = 0.10, respectively. Multicollinearity among the final covariates was assessed using variance inflation factors, with values below 5 considered acceptable. The proportional hazards assumption was evaluated using scaled Schoenfeld residuals plotted against time, supplemented by the Grambsch–Therneau global test. A non-significant result (P > 0.05) was interpreted as indicating no statistically significant evidence of violation of the proportional hazards assumption.
The clinical risk score was calculated as a weighted sum of the predictors that remained statistically significant in the multivariable Cox model, using their regression coefficients (β) as weights. Smoking history and previous PCI were coded as 0 (absent) or 1 (present). GOLD grades I–IV were coded as 1–4 and entered as an ordinal numeric variable, whereas LVEF was entered as a continuous variable expressed as a percentage. Variables meeting the backward stepwise retention criterion of P < 0.10 were included in the final Cox model, while only predictors with P < 0.05 were incorporated into the risk score. Patients were classified into low-, intermediate-, and high-risk groups according to tertiles of the risk score distribution within the study cohort.
Model performance was evaluated using the concordance index (C-index), time-dependent receiver operating characteristic (ROC) curves and the corresponding area under the curve (AUC), Brier score, calibration plots, likelihood ratio test, and decision curve analysis (DCA). Time-dependent ROC curves and AUC values were calculated using the Kaplan–Meier estimator to account for censored survival data. The Brier score was used to assess overall prediction accuracy, with lower values indicating better predictive performance. Model calibration was assessed by comparing predicted and observed survival probabilities, and the calibration slope was estimated. DCA was performed to evaluate the clinical net benefit across a range of threshold probabilities. Internal validation was conducted using bootstrap resampling with 500 iterations to obtain optimism-corrected performance estimates and the calibration slope. All statistical tests were two-sided, and P < 0.05 was considered statistically significant.
Resultados
Baseline Characteristics and Follow-up Outcomes
From January 2022 to October 2023, 248 hospitalized patients with coexisting CCS and COPD were initially assessed. After application of the exclusion criteria, 214 patients were enrolled in the study (Figure 1). During the one-year follow-up, 53 patients experienced the composite endpoint, corresponding to 24.8% of the study cohort. The reported endpoint components comprised 7 all-cause deaths (3.3%), 8 non-fatal myocardial infarctions (3.7%), 17 rehospitalizations for heart failure (7.9%), and 21 rehospitalizations for AECOPD (9.8%). All percentages were calculated using the full cohort of 214 patients as the denominator. As specified in the Methods, patients experiencing more than one qualifying endpoint component were counted only once in the primary composite endpoint analysis, using the date of their first qualifying event.
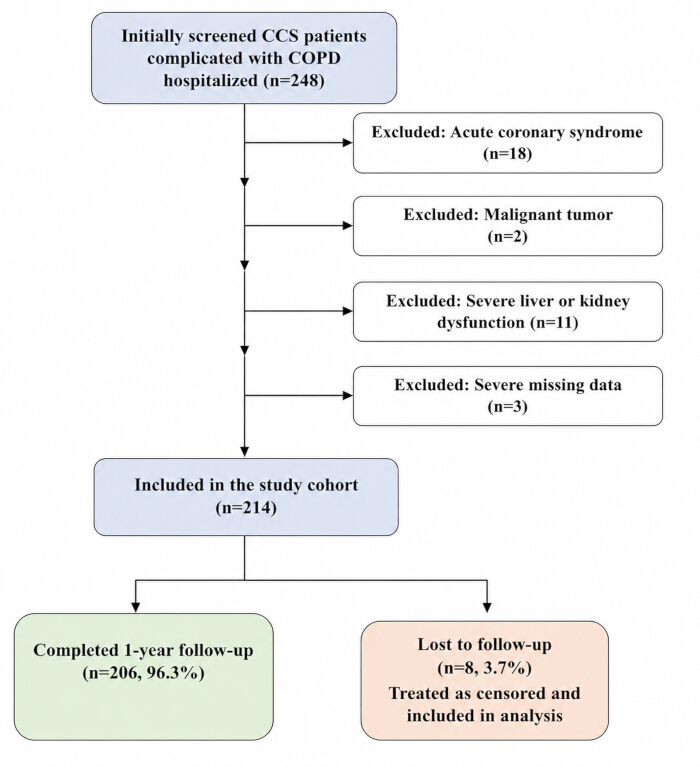
Figure 1: Flowchart of patient screening, eligibility assessment, and follow-up. A total of 248 hospitalized patients with concomitant chronic coronary syndrome (CCS) and chronic obstructive pulmonary disease (COPD) were initially screened. Of these, 34 patients were excluded because of acute coronary syndrome (n = 18), malignancy (n = 2), severe hepatic or renal dysfunction (n = 11), or substantial missing clinical data (n = 3). The final study cohort comprised 214 patients, of whom 206 (96.3%) completed the one-year follow-up and 8 (3.7%) were lost to follow-up. Patients lost to follow-up were censored at their last documented contact, and their available data were retained in the survival analyses. Please click here to view a larger version of this figure.
The event-free group comprised 161 patients. Accordingly, the study population was classified into an event group (n = 53) and an event-free group (n = 161), based on the occurrence of the composite endpoint. Baseline demographic, clinical, laboratory, and medication characteristics of the two groups are presented in Table 1.
Table 1: Comparison of baseline characteristics between event and event-free groups in patients with CCS and COPD. Baseline demographic characteristics, clinical history, laboratory measurements, and discharge medications were compared between patients who experienced the composite endpoint (event group, n = 53) and those who remained event-free (event-free group, n = 161) during the one-year follow-up. Normally distributed continuous variables are presented as the mean ± standard deviation, non-normally distributed continuous variables as the median (interquartile range), and categorical variables as the number (percentage). Between-group comparisons were performed using Student's t-test, the Mann–Whitney U test, or the chi-square (χ2) test, as appropriate. The reported test statistics are t, Z, and χ2. Statistical significance was defined as P < 0.05. CCS, chronic coronary syndrome; COPD, chronic obstructive pulmonary disease; PCI, percutaneous coronary intervention; GOLD, Global Initiative for Chronic Obstructive Lung Disease; LVEF, left ventricular ejection fraction; TC, total cholesterol; TG, triglycerides; LDL-C, low-density lipoprotein cholesterol; hs-CRP, high-sensitivity C-reactive protein; NT-proBNP, N-terminal pro-B-type natriuretic peptide; ACEI, angiotensin-converting enzyme inhibitor; ARB, angiotensin receptor blocker. Please click here to download this file.
Univariate Cox Regression Analysis
Using the one-year composite endpoint as the outcome variable, univariate Cox proportional hazards regression was performed for each prespecified variable, with P < 0.10 as the criterion for entry into the multivariate model. As shown in Table 2, variables significantly associated with the composite endpoint included older age (P < 0.001), smoking history (P = 0.010), prior PCI (P = 0.033), higher GOLD grade (P < 0.001), lower LVEF (P < 0.001), elevated hs-CRP (P = 0.034), and higher log-transformed NT-proBNP (ln NT-proBNP; P < 0.001). In contrast, sex, hypertension history, diabetes history, COPD duration, TC, TG, LDL-C, β-blocker use, statin use, and antiplatelet agent use did not meet the screening threshold (P ≥ 0.10) and were therefore not carried forward into multivariate analysis.
Table 2: Univariate Cox regression analysis for the composite endpoint. Univariate Cox proportional hazards regression was performed to evaluate the associations between individual baseline variables and the occurrence of the composite endpoint during the one-year follow-up. Regression coefficients (β), standard errors (SE), Wald chi-square (χ2) statistics, P values, hazard ratios (HRs), and 95% confidence intervals (CIs) are presented. The natural logarithm of NT-proBNP was used in the regression analysis. Statistical significance was defined as P < 0.05. COPD, chronic obstructive pulmonary disease; PCI, percutaneous coronary intervention; GOLD, Global Initiative for Chronic Obstructive Lung Disease; LVEF, left ventricular ejection fraction; TC, total cholesterol; TG, triglycerides; LDL-C, low-density lipoprotein cholesterol; hs-CRP, high-sensitivity C-reactive protein; NT-proBNP, N-terminal pro-B-type natriuretic peptide. Please click here to download this file.
Multivariate Cox Proportional Hazards Model
Variables with univariate P < 0.10 were entered into a multivariate Cox proportional hazards model using backward stepwise regression, with consideration of clinical relevance. The final model retained five variables: age, smoking history, prior PCI, GOLD grade, and LVEF (Table 3). Although age was significantly associated with the composite endpoint in univariate analysis (P < 0.001), this association was no longer statistically significant after multivariate adjustment (P = 0.090). Therefore, age was retained in the final Cox model but excluded from the risk score, which was constructed using the four predictors that remained statistically significant after adjustment.
| Variable | β | SE | Wald χ2 | P value | HR | 95% CI lower | 95% CI upper |
| Age | 0.036 | 0.021 | 2.872 | 0.09 | 1.037 | 0.994 | 1.081 |
| Smoking history | 0.674 | 0.298 | 5.100 | 0.024 | 1.962 | 1.093 | 3.521 |
| Prior PCI history | 0.702 | 0.284 | 6.120 | 0.013 | 2.017 | 1.157 | 3.517 |
| GOLD grade | 0.398 | 0.158 | 6.336 | 0.012 | 1.488 | 1.092 | 2.028 |
| LVEF | −0.069 | 0.022 | 9.460 | 0.002 | 0.933 | 0.893 | 0.975 |
Table 3: Multivariate Cox proportional hazards regression analysis for the composite endpoint. Multivariate Cox proportional hazards regression was performed to evaluate the independent associations of selected baseline variables with the occurrence of the composite endpoint during the one-year follow-up. Regression coefficients (β), standard errors (SE), Wald chi-square (χ2) statistics, P values, hazard ratios (HRs), and 95% confidence intervals (CIs) are presented. Hazard ratios for continuous variables represent the relative change in hazard associated with a one-unit increase in the corresponding variable, whereas hazard ratios for smoking history and prior PCI history represent comparisons with patients without the respective history. Statistical significance was defined as P < 0.05. PCI, percutaneous coronary intervention; GOLD, Global Initiative for Chronic Obstructive Lung Disease; LVEF, left ventricular ejection fraction.
Smoking history (HR = 1.962, 95% CI: 1.093–3.521, P = 0.024), prior PCI (HR = 2.017, 95% CI: 1.157–3.517, P = 0.013), GOLD grade (HR = 1.488, 95% CI: 1.092–2.028, P = 0.012), and LVEF (HR = 0.933, 95% CI: 0.893–0.975, P = 0.002) remained independently associated with the composite endpoint. With GOLD grades I–IV coded as an ordinal variable from 1 to 4, each one-grade increase was associated with a 48.8% higher hazard of the composite endpoint, assuming a constant log-hazard increment across successive grades. This association pertains to the composite endpoint and should not be interpreted as specific to cardiovascular outcomes. The proportional hazards assumption was satisfied for all covariates in the multivariate model (Grambsch–Therneau global test, P = 0.179; all individual covariates, P > 0.05).
Model Discrimination
The predictive performance of the multivariate Cox regression model was evaluated using discrimination, calibration, and clinical utility measures. The concordance index (C-index) was 0.736, with a bootstrap-corrected estimate of 0.718. The likelihood ratio test yielded χ2 = 46.033 (P < 0.001), indicating a statistically significant overall model. The one-year area under the receiver operating characteristic curve (AUC) was 0.773 (95% CI: 0.692–0.846), with a sensitivity of 70.9% and specificity of 93.8%. The bootstrap-corrected AUC was 0.753. The Brier score was 0.142, and the bootstrap internal validation calibration slope was 0.901. The calibration plot demonstrated agreement between predicted and observed one-year event probabilities (Figure 2A). Decision curve analysis (DCA) indicated that the prediction model provided a positive net benefit compared with the treat-all and treat-none strategies across threshold probabilities of approximately 0.10–0.25 (Figure 2B). These findings suggest potential clinical utility for risk-based decision-making within this threshold range.
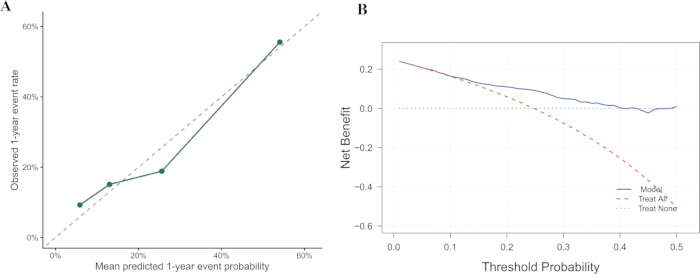
Figure 2: Assessment of the predictive model performance. (A) Calibration plot comparing the predicted and observed probabilities of the composite endpoint at one year. The solid line represents the model calibration curve, whereas the dashed diagonal line represents perfect calibration. (B) Decision curve analysis showing the net benefit of the prediction model across a range of threshold probabilities. The blue solid line represents the prediction model, the red dashed line represents the treat-all strategy, and the black dashed line represents the treat-none strategy. Please click here to view a larger version of this figure.
Subgroup Analysis
A clinical risk score was constructed using the regression coefficients of the four predictors that remained statistically significant in the multivariate Cox regression model:
Risk score = 0.674 × smoking history + 0.702 × prior PCI history + 0.398 × GOLD grade − 0.069 × LVEF.
Smoking history and prior PCI history were coded as 0 for absence and 1 for presence. GOLD grades I–IV were coded as 1–4 and entered as an ordinal numeric variable, whereas LVEF was entered as a continuous variable expressed as a percentage.
The cohort was divided into tertiles according to the risk score distribution: low-risk (n = 72; score range, −4.592 to −3.083), intermediate-risk (n = 71; score range, −3.076 to −2.242), and high-risk (n = 71; score range, −2.219 to −0.604). Kaplan–Meier curves demonstrated one-year composite endpoint-free survival rates of 89.04%, 84.29%, and 52.11% in the low-, intermediate-, and high-risk groups, respectively (Figure 3). Composite endpoint-free survival differed significantly among the three groups (log-rank χ2 = 32.873, P < 0.001), with a significant trend toward poorer outcomes across increasing risk strata (trend test χ2 = 27.268, P < 0.001).
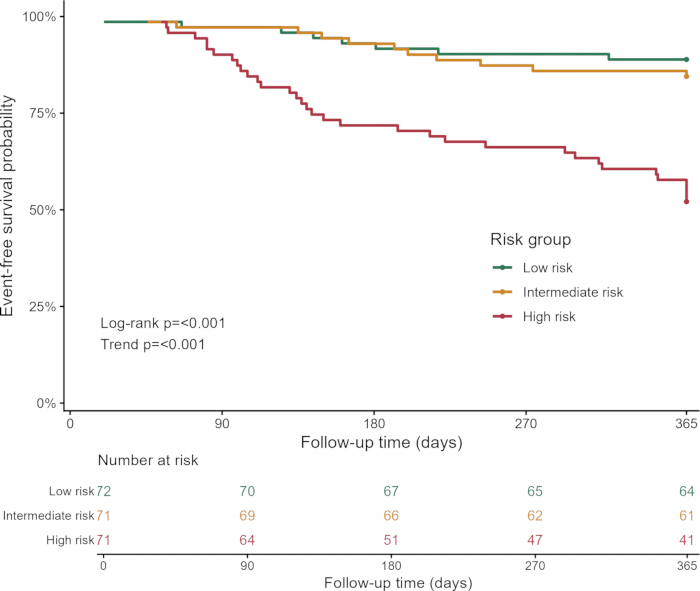
Figure 3: Kaplan–Meier curves of one-year event-free survival stratified by risk group. Kaplan–Meier curves showing the probability of remaining free from the composite endpoint among patients classified into low-risk (n = 72), intermediate-risk (n = 71), and high-risk (n = 71) groups based on tertiles of the clinical risk score. The composite endpoint comprised all-cause death, non-fatal myocardial infarction, rehospitalization for heart failure, or rehospitalization for acute exacerbation of COPD. Event-free survival differed significantly among the three risk groups (log-rank P < 0.001; trend P < 0.001). The numbers of patients at risk at the specified follow-up time points are presented below the survival curves. Please click here to view a larger version of this figure.
Data Availability:
The de-identified participant-level data supporting the findings of this study, including the source data underlying the analyses, tables, and figures, are available in Supplementary File 1, provided with this article.
Supplementary File 1: De-identified patient-level clinical data and variable coding for the study cohort. The supplementary Excel file contains individual-level data for 214 patients with concomitant chronic coronary syndrome (CCS) and chronic obstructive pulmonary disease (COPD). The Data worksheet includes demographic characteristics, clinical history, COPD severity, laboratory measurements, discharge medications, follow-up information, and clinical outcomes. The Code worksheet provides numerical coding definitions for selected categorical variables. Clinical outcomes include all-cause mortality, non-fatal myocardial infarction, heart failure, and acute exacerbation of COPD. The composite endpoint and follow-up time are recorded in the corresponding columns. BMI, body mass index; PCI, percutaneous coronary intervention; GOLD, Global Initiative for Chronic Obstructive Lung Disease; LVEF, left ventricular ejection fraction; TC, total cholesterol; TG, triglycerides; LDL-C, low-density lipoprotein cholesterol; hs-CRP, high-sensitivity C-reactive protein; NT-proBNP, N-terminal pro-B-type natriuretic peptide; ln NT-proBNP, natural logarithm of NT-proBNP; HF, heart failure; AECOPD, acute exacerbation of chronic obstructive pulmonary disease. Please click here to download this file.
Discusión
This study evaluated the one-year outcomes of hospitalized patients with CCS and concomitant COPD, demonstrating a considerable risk of short-term adverse events in this comorbid population. Multivariate Cox proportional hazards regression identified smoking history, prior PCI, higher GOLD grade, and lower left ventricular ejection fraction (LVEF) as factors independently associated with the composite endpoint. The risk stratification model incorporating these four variables distinguished patients with different prognostic risks, providing a quantitative basis for identifying individuals who may benefit from closer clinical monitoring. The coexistence of CCS and COPD is clinically important rather than incidental. Previous studies have demonstrated that patients with both COPD and cardiovascular disease have higher all-cause mortality than individuals without either condition10. Similarly, Yao et al.5 reported significantly higher five-year all-cause and cardiac mortality among patients with coronary heart disease and concomitant COPD. The 24.8% one-year composite endpoint event rate observed in the present study further highlights the substantial burden of adverse outcomes in this population. Rehospitalization for AECOPD was the most frequently reported individual endpoint component (21 patients; 9.8% of the cohort). Although the composite endpoint captures the overall burden of cardiovascular and respiratory complications, its components differ in clinical significance and potential prognostic determinants. Accordingly, the observed associations should be interpreted in relation to the composite endpoint rather than to its individual components.
The pathophysiological relationship between CCS and COPD involves several interconnected mechanisms. Smoking, a shared risk factor for both conditions, promotes atherosclerosis through oxidative stress and systemic inflammation while contributing to progressive pulmonary function impairment11. Furthermore, chronic airway inflammation associated with COPD may facilitate coronary plaque formation and progression through circulating inflammatory mediators12. These mechanisms provide a plausible explanation for the independent association between smoking history and adverse outcomes observed in this study. Prior PCI history was also independently associated with a higher hazard of the composite endpoint, potentially reflecting a greater underlying burden of coronary artery disease or previous coronary interventions. However, because this retrospective analysis did not directly assess coronary anatomical complexity or the reasons for prior PCI, this association should not be interpreted as evidence that PCI itself increases the risk of adverse outcomes.
GOLD grade reflects the severity of airflow limitation in COPD and was independently associated with the composite endpoint. Severe COPD is frequently accompanied by chronic hypoxemia, which may contribute to pulmonary vascular remodeling and pulmonary hypertension, thereby increasing right ventricular afterload13,14. Hypoxia may also precipitate arrhythmias and myocardial ischemia15. The GOLD 2025 report16 emphasizes the importance of cardiovascular risk assessment in patients with COPD, further supporting the clinical relevance of evaluating respiratory disease severity in patients with concomitant cardiovascular conditions. In the present study, each one-grade increase in GOLD severity was associated with a higher hazard of the composite endpoint. Nevertheless, because the endpoint included all-cause mortality, non-fatal cardiovascular events, and respiratory rehospitalizations, this finding cannot establish that greater airflow limitation specifically predicts cardiovascular complications.
LVEF is an established indicator of left ventricular systolic function and reflects the contribution of cardiac functional reserve to prognosis. In patients with CCS and severe COPD, pulmonary hyperinflation and increased intrathoracic pressure may impair venous return and ventricular filling, potentially aggravating pre-existing cardiac dysfunction17. Consequently, LVEF may reflect both underlying myocardial impairment and the physiological interaction between cardiac and pulmonary dysfunction. The risk score developed in this study incorporated smoking history, prior PCI history, GOLD grade, and LVEF, integrating behavioral, coronary, respiratory, and cardiac characteristics into a single prognostic measure. The model classified patients into low-, intermediate-, and high-risk groups with significantly different one-year composite endpoint-free survival rates. These findings suggest that the combined assessment of cardiovascular and respiratory characteristics may improve identification of patients at increased overall risk. The model may help inform individualized follow-up planning, including closer specialist monitoring, coordinated cardiopulmonary management, and consideration of rehabilitation services for higher-risk patients. However, the clinical effectiveness of management strategies guided by this score has not been evaluated and requires further investigation.
Several limitations should be acknowledged. First, the single-center retrospective design and relatively modest sample size limit the generalizability of the findings and introduce the possibility of selection bias and residual confounding. Second, the one-year follow-up period does not permit assessment of longer-term prognostic outcomes. Third, potentially relevant factors, including previous COPD exacerbation frequency, medication adherence, nutritional status, and longitudinal changes in inflammatory biomarkers, were not incorporated into the prediction model. Fourth, the composite endpoint combined all-cause mortality with non-fatal cardiovascular and respiratory events, which may have different underlying mechanisms and prognostic determinants. The relative frequencies of these components may therefore influence the observed associations. Because the numbers of individual endpoint events were small, component-specific analyses were not performed, and the identified predictors should not be assumed to have equivalent associations with cardiovascular and respiratory outcomes separately. Finally, although bootstrap internal validation was performed, the model has not undergone external validation. Larger multicenter prospective studies with longer follow-up periods are needed to evaluate its reproducibility, assess individual endpoint components, and determine whether additional clinical variables improve predictive performance.
In conclusion, patients with concomitant CCS and COPD experienced a substantial burden of adverse outcomes during one-year follow-up. Smoking history, prior PCI history, and higher GOLD grade were independently associated with a greater hazard of the composite endpoint, whereas higher LVEF was associated with a lower hazard. These associations apply to the overall composite endpoint and do not establish equivalent prognostic effects across its cardiovascular and respiratory components. A risk stratification model incorporating these four variables distinguished patients with different short-term prognoses and may support the identification of individuals requiring closer clinical assessment. Nevertheless, its applicability to other populations and its utility in guiding clinical management require confirmation through larger, multicenter prospective investigations.
Divulgaciones
Conflicts of Interest:
The authors declare no competing interests.
Agradecimientos
The authors acknowledge the Affiliated Hospital of Inner Mongolia Minzu University for providing access to the database used in this study. This work was financially supported by the Natural Science Foundation of Inner Mongolia Autonomous Region (Grant No. 2025QN08111).
Materiales
| Nombre | Empresa | Número de catálogo | Comentarios |
|---|---|---|---|
| Clinical database of CCS and COPD patients | Affiliated Hospital of Inner Mongolia Minzu University | N/A | Retrospective cohort database containing hospitalized patients with CCS and COPD |
| Clinical laboratory system | Affiliated Hospital of Inner Mongolia Minzu University | N/A | Used to obtain biochemical and inflammatory laboratory measurements |
| Echocardiography system | Philips Medical (Suzhou) Co., Ltd. | EPIQ CVx | Used to measure left ventricular ejection fraction |
| Electronic medical record system | Nanjing Haitai Medical Information Systems Co., Ltd. | Haitai Paperless Medical Record System V2.0 | Used to extract demographic, lifestyle, clinical, laboratory, and discharge medication data |
| Follow-up telephone system/platform | iFLYTEK Healthcare Technology Co., Ltd. | Full-course Follow-up Information Management Platform | Used for one-year clinical outcome follow-up |
| High-sensitivity C-reactive protein assay | Roche Diagnostics | 11972855216 | Used to measure high-sensitivity C-reactive protein |
| Low-density lipoprotein cholesterol assay | Shenzhen Mindray Bio-Medical Electronics Co., Ltd. | V251566 | Used to measure low-density lipoprotein cholesterol |
| N-terminal pro-brain natriuretic peptide assay | Shenzhen Mindray Bio-Medical Electronics Co., Ltd. | 105-027044-A0 | Used to measure N-terminal pro-B-type natriuretic peptide |
| Pulmonary function testing system | Zhejiang Yiliankang Medical Technology Co., Ltd. | EC100 | Used to obtain post-bronchodilator FEV1/FVC measurements for COPD diagnosis |
| SPSS Statistics, version 26.0 | IBM | RRID:SCR_002865 | Used for statistical analyses, including Cox proportional hazards regression, Kaplan–Meier analysis, and model performance assessment |
| Total cholesterol assay | Thermo Fisher Scientific | TR13421 | Used to measure total cholesterol |
| Triglyceride assay | Thermo Fisher Scientific | TR22421 | Used to measure triglycerides |
Referencias
- Knuuti J, et al. 2019 ESC Guidelines for the diagnosis and management of chronic coronary syndromes. Eur Heart J. 2020;41:407-77.
- Wang JJ. Risk of coronary heart disease in people with chronic obstructive pulmonary disease: a meta-analysis. Int J Chron Obstruct Pulmon Dis. 2021;16:2939-44.
- Russo M, et al. Atherosclerotic coronary plaque features in patients with chronic obstructive pulmonary disease and acute coronary syndrome. Am J Cardiol. 2024;224:36-45.
- Mooe T, Stenfors N. The prevalence of COPD in individuals with acute coronary syndrome: a spirometry-based screening study. COPD. 2015;12:453-61.
- Yao Y, et al. Effects of chronic obstructive pulmonary disease on long-term prognosis of patients with coronary heart disease post-percutaneous coronary intervention. J Geriatr Cardiol. 2022;19:428-34.
- Ghoorah K, De Soyza A, Kunadian V. Increased cardiovascular risk in patients with chronic obstructive pulmonary disease and the potential mechanisms linking the two conditions: a review. Cardiol Rev. 2013;21:196-202.
- Maeda T, Dransfield MT. Chronic obstructive pulmonary disease and cardiovascular disease: mechanistic links and implications for practice. Curr Opin Pulm Med. 2024;30:141-9.
- Schmidt SE, Winther S, Boettcher M. Coronary artery disease risk reclassification using an acoustic-based score in view of the new European Society of Cardiology 2019 guidelines on chronic coronary syndromes. Int J Cardiovasc Imaging. 2020;36:383-4.
- Global Initiative for Chronic Obstructive Lung Disease. Global strategy for the diagnosis, management, and prevention of chronic obstructive pulmonary disease: 2021 report. 2021.
- Li Y, et al. Additive impact of chronic obstructive pulmonary disease (COPD) and cardiovascular disease (CVD) on all-cause and disease-specific mortality: a longitudinal nationwide population-based study. BMC Pulm Med. 2025;25:275.
- Kotlyarov S. The role of smoking in the mechanisms of development of chronic obstructive pulmonary disease and atherosclerosis. Int J Mol Sci. 2023;24.
- Brassington K, Selemidis S, Bozinovski S, Vlahos R. Chronic obstructive pulmonary disease and atherosclerosis: common mechanisms and novel therapeutics. Clin Sci (Lond). 2022;136:405-23.
- Alqarni AA, et al. Role of prostanoids, nitric oxide and endothelin pathways in pulmonary hypertension due to COPD. Front Med (Lausanne). 2023;10:1275684.
- Burger CD. Pulmonary hypertension in COPD: a review and consideration of the role of arterial vasodilators. COPD. 2009;6:137-44.
- Tirlapur VG, Mir MA. Nocturnal hypoxemia and associated electrocardiographic changes in patients with chronic obstructive airways disease. N Engl J Med. 1982;306:125-30.
- Global Initiative for Chronic Obstructive Lung Disease. Global strategy for the diagnosis, management, and prevention of chronic obstructive pulmonary disease: 2025 report. 2024.
- Struss N, Bauersachs J, Welte T, Hohlfeld JM. Left heart function in COPD: impact of lung deflation. Herz. 2019;44:477-82.