A method for isolating specific cell types from plant material is demonstrated. This technique employs transgenic marker lines expressing fluorescent proteins in particular cell types, cellular dissociation and Fluorescence Activated Cell Sorting. Additionally, a growth setup is established here that facilitates treatment of Arabidopsis thaliana seedlings prior to cell sorting.
A subscription to JoVE is required to view this content. Sign in or start your free trial.
Method Article
Fluorescence Activated Cell Sorting of Plant Protoplasts
In This Article
Summary
Abstract
High-resolution, cell type-specific analysis of gene expression greatly enhances understanding of developmental regulation and responses to environmental stimuli in any multicellular organism. In situ hybridization and reporter gene visualization can to a limited extent be used to this end but for high resolution quantitative RT-PCR or high-throughput transcriptome-wide analysis the isolation of RNA from particular cell types is requisite. Cellular dissociation of tissue expressing a fluorescent protein marker in a specific cell type and subsequent Fluorescence Activated Cell Sorting (FACS) makes it possible to collect sufficient amounts of material for RNA extraction, cDNA synthesis/amplification and microarray analysis.
An extensive set of cell type-specific fluorescent reporter lines is available to the plant research community. In this case, two marker lines of the Arabidopsis thaliana root are used: PSCR::GFP (endodermis and quiescent center) and PWOX5::GFP (quiescent center). Large numbers (thousands) of seedlings are grown hydroponically or on agar plates and harvested to obtain enough root material for further analysis. Cellular dissociation of plant material is achieved by enzymatic digestion of the cell wall. This procedure makes use of high osmolarity-induced plasmolysis and commercially available cellulases, pectinases and hemicellulases to release protoplasts into solution.
FACS of GFP-positive cells makes use of the visualization of the green versus the red emission spectra of protoplasts excited by a 488 nm laser. GFP-positive protoplasts can be distinguished by their increased ratio of green to red emission. Protoplasts are typically sorted directly into RNA extraction buffer and stored for further processing at a later time.
This technique is revealed to be straightforward and practicable. Furthermore, it is shown that it can be used without difficulty to isolate sufficient numbers of cells for transcriptome analysis, even for very scarce cell types (e.g. quiescent center cells). Lastly, a growth setup for Arabidopsis seedlings is demonstrated that enables uncomplicated treatment of the plants prior to cell sorting (e.g. for the cell type-specific analysis of biotic or abiotic stress responses). Potential supplementary uses for FACS of plant protoplasts are discussed.
Protocol
1) Preparation of the plant material
- Protoplasts can be derived from many different plant species and tissues provided that the right mix of cell wall digesting enzymes is used1. Before a full-scale experiment is undertaken, a small-scale digestion of the material is advisable in order to evaluate the protoplasting efficiency of the tissue, enzymes, etc. and to estimate the percent positive cells for cell sorting. Here, protoplasts derived from the roots of Arabidopsis thaliana seedlings that cell type-specifically express green fluorescent protein (GFP) are used. The endodermis and quiescent center are marked by PSCR::GFP and the quiescent center by PWOX5::GFP2,3 (Figure 1).
- Seedlings are grown hydroponically in phytatrays (Sigma; Figure 2a) on a nylon filter (250 μm mesh; NITEX) which lets the roots grow through into the growth medium (0.22% w/v Murashige and Skoog Basal Medium [Sigma], 1% w/v sucrose, 0.05% w/v MES [2-(N-morpholino)ethanesulfonic acid], pH 5.7 with KOH). Alternatively, plants can be grown on top of a nylon filter (100 μm mesh) in vertically positioned 1% agar plates (Figure 2b).
- The use of the abovementioned filters not only aids in the harvest of the roots, it also facilitates easy additional treatment of the seedlings, if desired. The filters allow the seedlings to be transferred en masse to new phytatrays or agar plates supplemented with a catalyst of interest. For example, the phytatray set up has been used for cell type-specific analysis of the transcriptional response to nitrogen treatment in Arabidopsis seedlings4.
- Ensure microscopically that your fluorescent marker is correctly expressed (especially when using the treatment option, as the cell type-specific markers themselves might be influenced by the treatment). In this case, seedlings are inspected under a fluorescence microscope (Nikon; Figure 1). Note that cell type-specific fluorescent marker lines should be characterized initially under a confocal microscope to determine exactly which cell types are marked and determine variability in expression.
2) Preparation of the protoplasting solution
- Dissolve 1.25% w/v Cellulase (Yakult), 0.3% w/v Macerozyme (Yakult), 0.4 M D-mannitol, 20 mM MES and 20 mM KCl (from a 1 M stock) in demineralized water and adjust the pH to 5.7 with 1 M Tris/HCl pH 7.5. This solution will be slightly turbid.
- Heat the solution to 55° C for 10 minutes (the solution will turn clear) and let it cool down to room temperature before adding 0.1% w/v BSA (bovine serum albumin), 10 mM CaCl2, and 5 mM β-mercaptoethanol.
3) Harvesting and protoplasting of the plant material
- The roots are harvested by scraping them off the nylon mesh with a scalpel and deposited into a flask containing the protoplasting solution. Generally, 10 ml of protoplasting solution is used per 1,500 seedling roots.
- Shake the flasks gently (75 rpm) at room temperature for one hour. A longer incubation time may increase the protoplast yield but will also add to the effect of protoplasting itself on gene expression.
- Filter the protoplast solution with a 40 μm cell strainer (BD Falcon) and divide the solution over conical 15 ml tubes (BD Falcon).
- Spin the tubes in a swing-bucket centrifuge for 10 minutes at 500 G. Note that this centrifugation speed will depend on the type of protoplasts used, their fragility and the amount of cell debris produced during enzymatic treatment.
- Remove most of the supernatant, resuspend the protoplasts in the remaining solution and inspect them microscopically (Figure 3).
- Make use of a hemacytometer to estimate the number and density of protoplasts. The cell density will determine sample injection speed, the events per second rate and therefore the total time needed to sort the cells at the FACS (see also section 4.3).
- 3.7) Either proceed directly to FACS or wash and resuspend the protoplasts in an incubation solution, such as W5 (154 mM NaCl, 125 mM CaCl2, 5 mM KCl, 5 mM MES, adjust pH to 5.7 with KOH) or protoplasting solution without the added enzymes. Especially when looking at transcriptional changes, it is of importance to minimize the exposure of the samples to conditions that might influence gene expression, such as changing the buffer the protoplasts are kept in. It is therefore recommended to keep the protoplasts in protoplasting solution and proceed to FACS as soon as possible.
4) Fluorescence Activated Cell Sorting of protoplasts
- Turn on and prepare the cell sorter. Here, a FACSAria (BD) is used.
- Set up a flow stream with a 100 μm nozzle and a 20 psi sheath pressure.
- The cell density and sample injection speed can be adjusted to the particular experiment based on whether a best possible yield or fastest achievable speed is desired. We have sorted successfully with densities up to 10,000,000 cells/ml.
- Use the sample agitation option on the FACS to prevent sedimentation of the protoplasts. If clogging of the FACS is an issue, there are three possible troubleshooting steps: 1. Perform a sample-line backflush. 2. Dilute your protoplast suspension to reduce the density. 3. Clean up the protoplast solution by repeating the filtration step (3.3) after centrifugation and resuspension.
- Prepare the apparatus to measure forward scatter (FSC), side scatter (SSC) and emission at 530/30 nm for GFP and 610/20 nm for red spectrum autofluorescence (RSA) after excitation by a 488 nm laser. These are in essence the only parameters used to isolate GFP-positive protoplasts. Here, the voltage settings were as follows: FSC - 60V, SSC 250V, GFP 350V and RSA 335V. Note that the optimal voltage settings will be different for every FACS and will even need to be adjusted throughout the lifetime of the cell sorter.
- Start by setting up a dotplot for forward scatter versus side scatter. Apply the voltage settings so that the measured events are centered in the plot.
- Next, create a dot plot of green versus red fluorescence signals. Apply the voltage settings so that the measured events yield a centered diagonal population in the plot when looking at a wild-type (non-GFP) protoplast suspension. A protoplast suspension derived from a GFP marker line will produce a clear population of green fluorescent events never seen in wild-type samples.
- Set compensation constraints to adjust for spectral overlap between GFP and RSA. Proper compensation constraint settings will allow for better separation of the GFP-positive protoplasts from the non-GFP protoplasts and debris. The constraints used here are as follows: RSA, minus 17.91% GFP.
- Set up a gate to identify GFP-positive events, a negative control of non-GFP protoplasts should be used to aid in defining the gate boundaries (Figure 4).
- Implement a forward scatter cutoff in order to leave small debris out of the analysis. Visualize the GFP-positive events in the FSC vs. SSC plot to help determine the placement of the cutoff. Here, the cutoff was set at 5,000. Note that the FACS will count debris as sort events and a sample with high levels of debris may have a different percent GFP positive events than expected. This is not necessarily a problem. However, the more debris in the sample, the longer the sort will take.
- Depending on the experiment and the abundance of the cell type to be analyzed, set the FACS precision mode either for optimal yield or optimal purity of the sorted cells.
- For RNA extraction, prepare collection tubes (1.5 ml microfuge tubes) with the appropriate amount of RNA extraction buffer. With this setup, 20,000 sorting events will yield a total volume of approximately 100 μl which were sorted in to 350 μl of extraction buffer (RNeasy micro kit, QIAGEN). Mix samples after completion of the sort as cell suspension can pool at the top.
- Store samples or proceed directly to RNA extraction. Successful microarray analyses have been preformed with the RNA extracted from as little as 500 sorted events. Here, we used an RNeasy micro extraction kit (QIAGEN), the WT-Ovation Pico RNA Amplification System and FL-Ovation cDNA Biotin Module V2 (NuGEN).
Representative Results
One phytatray of approximately 1,500 one-week-old PSCR::GFP seedlings yielded about 60,000 protoplasts (as measured by hemacytometer). 2.6% of 65,000 FACS-processed events were defined as being GFP-positive and were sorted (Figure 4b).
Eight plates of approximately 1,500 four-day-old PWOX5::GFP seedlings each (12,000 total) yielded about 30,000,000 protoplasts (as measured by hemacytometer). 0.063% of 16,000,000 FACS-processed events were defined as being GFP-positive and were sorted (Figure 4c).
10,000 sorted events are typically used for RNA extraction and can yield from 20 to 140 ng total RNA (Figure 5).
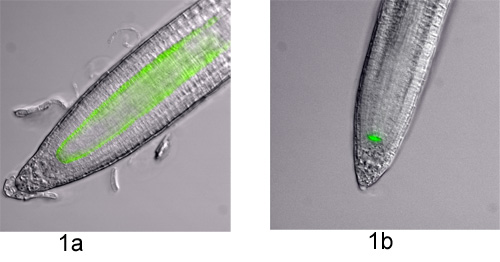
Figure 1. Cell type-specific GFP marker lines in the Arabidopsis root. Fluorescence microscopy images were taken with differential interference contrast (DIC) and a GFP filter on an Eclipse 90i microscope (Nikon) running on Metamorph software (Molecular Devices). The DIC and GFP images were overlaid for visualization purposes. The two marker lines used in this visual experiment are shown; a) PSCR::GFP and b) PWOX5::GFP.
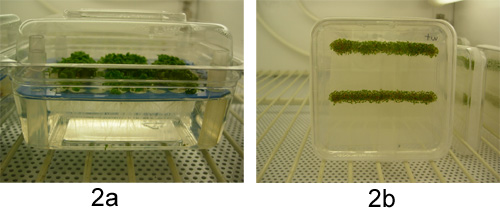
Figure 2. Plant growth conditions. Seedlings were grown in an environmental controller hydroponically in phytatrays (a) or on vertically positioned agar plates (b).

Figure 3. Plant protoplasts expressing GFP. Fluorescence microscopy images were taken with differential interference contrast (DIC) and a GFP filter on an Eclipse 90i microscope (Nikon) running on Metamorph software (Molecular Devices). The DIC and GFP images were overlaid for visualization purposes. Arrows indicate a burst cell, cell debris and a GFP-positive protoplast. The distance between two white lines is 50 μm.
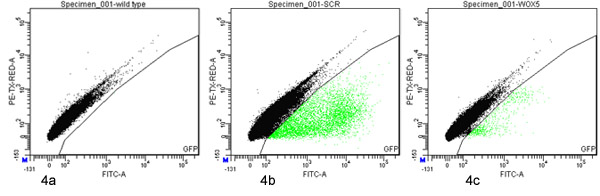
Figure 4. Fluorescence activated cell sorting of GFP-positive protoplasts. Protoplasts derived from wild type (a) PSCR::GFP (b) or PWOX5::GFP (c) marker lines were analyzed and sorted with a FACSAria (BD) using gates defined on a dotplot of green (530/30 nm; x axis) versus red (610/20 nm; y axis) fluorescence. 100,000 events are presented in each plot. The events falling within the GFP sorting gate are highlighted green.

Figure 5. Representative RNA extractions from 10.000 sorted cells. Cells were sorted directly into RNA extraction buffer (QIAGEN), the RNA was purified and checked for concentration, purity and integrity on a 2100 Bioanalyzer (Agilent). Three replicates for both marker lines are shown.
Access restricted. Please log in or start a trial to view this content.
Discussion
Protoplasts can, in principle, be derived from a variety of plant tissues, optimizing favorable conditions will greatly enhance RNA quality and quantity. Both the protoplasting solution and the elective incubation buffer used will influence this aspect.
Many different fluorescent proteins can be used, depending on the capabilities of the FACS used, e.g. GFP, RFP, YFP, CFP or their many variants and derivatives. The expression of the markers could be driven not just by cell type-speci...
Access restricted. Please log in or start a trial to view this content.
Acknowledgements
This work was supported by the National Science Foundation (grant no. DBI 0519984) and the National Institutes of Health (grant no. 5R01GM078279)..
Access restricted. Please log in or start a trial to view this content.
Materials
| Name | Company | Catalog Number | Comments |
|---|---|---|---|
| 250 μm nylon mesh | Sefar Filtration | NITEX 03-250/50 | |
| 100 μm nylon mesh | Sefar Filtration | NITEX 03-100/47 | |
| Square petri dishes | Fisher Scientific | 08-757-10k | |
| Phytatrays | Sigma-Aldrich | P1552 | |
| Murashige and Skoog Basal Medium (MS) | Sigma-Aldrich | M5519 | |
| sucrose | Fisher Scientific | S5-3 | |
| MES | Sigma-Aldrich | M2933 | |
| KOH | Sigma-Aldrich | P1767 | 10 M stock |
| Eclipse 90i microscope | Nikon Instruments | ||
| Cellulase R-10 | Yakult Pharmaceutical | ||
| Macerozyme R-10 | Yakult Pharmaceutical | ||
| D-mannitol | Sigma-Aldrich | M9546 | |
| KCl | Sigma-Aldrich | P8041 | 1 M stock |
| BSA | Sigma-Aldrich | A3912 | |
| β-mercapt–thanol | Calbiochem | 444203 | |
| CaCl2 | Sigma-Aldrich | C2536 | 1 M stock |
| orbital shaker | Labline Instruments | ||
| 40 μm cell strainer | BD Biosciences | 352340 | |
| conical 15 ml tubes | BD Biosciences | 352196 | |
| table centrifuge | Sorvall, Thermo Scientific | Legend RT | |
| NaCl | Sigma-Aldrich | S3014 | |
| FACSAria | BD Biosciences | ||
| 1.5 ml microfuge tubes | VWR international | 20170-38 | |
| RNeasy micro kit | Qiagen | 74004 | |
| WT-Ovation Pico RNA Amplification System | NuGEN | 3300_12 | |
| FL-Ovation cDNA Biotin Module V2 | NuGEN | 4200_12 |
References
- Sheen, J. Signal transduction in maize and Arabidopsis mesophyll protoplasts. Plant Physiol. 127, 1466-1475 (2001).
- Wysocka-Diller, J. W., Helariutta, Y., Fukaki, H., Malamy, J. E., Benfey, P. N. Molecular analysis of SCARECROW function reveals a radial patterning mechanism common to root and shoot. Development. 127, 595-603 (2000).
- Blilou, I., Xu, J., Wildwater, M., Willemsen, V., Paponov, I., Friml, J., Heidstra, R., Aida, M., Palme, K., Scheres, B. The PIN auxin efflux facilitator network controls growth and patterning in Arabidopsis roots. Nature. 433, 39-44 (2005).
- Gifford, M. L., Dean, A., Gutierrez, R. A., Coruzzi, G. M., Birnbaum, K. D. Cell-specific nitrogen responses mediate developmental plasticity. Proc Natl Acad Sci U S A. 105, 803-808 (2008).
- Bargmann, B. O. R., Birnbaum, K. D. Positive fluorescent selection permits precise, rapid, and in-depth overexpression analysis in plant protoplasts. Plant Physiol. 149, 1231-1239 (2009).
- Petersson, S. V., Johansson, A. I., Kowalczyk, M., Makoveychuk, A., Wang, J. Y., Moritz, T., Grebe, M., Benfey, P. N., Sandberg, G., Ljung, K. An Auxin Gradient and Maximum in the Arabidopsis Root Apex Shown by High-Resolution Cell-Specific Analysis of IAA Distribution and Synthesis. Plant Cell. 21, 1659-1668 (2009).
Access restricted. Please log in or start a trial to view this content.
Reprints and Permissions
