

Summary
Here we describe a basic protocol to image and quantify the mitotic timing of live mammalian tissue culture cells after siRNA transfection.
Abstract
Changes in cellular organization and chromosome dynamics that occur during mitosis are tightly coordinated to ensure accurate inheritance of genomic and cellular content. Hallmark events of mitosis, such as chromosome movement, can be readily tracked on an individual cell basis using time-lapse fluorescence microscopy of mammalian cell lines expressing specific GFP-tagged proteins. In combination with RNAi-based depletion, this can be a powerful method for pinpointing the stage(s) of mitosis where defects occur after levels of a particular protein have been lowered. In this protocol, we present a basic method for assessing the effect of depleting a potential mitotic regulatory protein on the timing of mitosis. Cells are transfected with siRNA, placed in a stage-top incubation chamber, and imaged using an automated fluorescence microscope. We describe how to use software to set up a time-lapse experiment, how to process the image sequences to make either still-image montages or movies, and how to quantify and analyze the timing of mitotic stages using a cell-line expressing mCherry-tagged histone H2B. Finally, we discuss important considerations for designing a time-lapse experiment. This strategy is complementary to other approaches and offers the advantages of 1) sensitivity to changes in kinetics that might not be observed when looking at cells as a population and 2) analysis of mitosis without the need to synchronize the cell cycle using drug treatments. The visual information from such imaging experiments not only allows the sub-stages of mitosis to be assessed, but can also provide unexpected insight that would not be apparent from cell cycle analysis by FACS.Protocol
siRNA transfection and cell preparation
- Prepare a 4-well LabTek II chambered coverglass by adding 0.5mL of fibronectin (10μg/mL) to each well that will be used. Incubate for 10-15 minutes at room temperature.
- Prepare siRNA/Lipofectamine RNAiMAX (Invitrogen) complexes for reverse transfection according to manufacturer s instructions. Use the recommended amounts for one well of a 24-well dish per chamber to be used (100μL total). An analogous product/protocol for siRNA transfection can be substituted.
- Remove the fibronectin from the wells of the chambered coverglass. Add 100μL of siRNA/Lipofectamine RNAiMAX complexes to each well that will be used.
- Aliquot 20,000 histone H2B-mCherry-expressing cells (in 500μL) per well containing transfection mixture.
- Allow cells to incubate for ~24 hours before replacing transfection mixture with 1mL of regular cell culture medium.
- Incubate cells an additional 24 hours before image acquisition (48 hours post-transfection).
Microscope setup and image acquisition
- There are three main parts to the image acquisition setup: 1) a cell incubator that fits on the microscope stage and maintains a constant humid environment of 37°C, and 5% CO2; 2) an inverted microscope equipped with an automated stage, automated fluorescence and brightfield shutters, and automated filter wheels; and 3) a software package that integrates and controls the stage, shutters, and filter wheels. In our imaging setup, we use a customized cell incubator from OKO Lab that can be used with the LabTek II chambered coverglass. The stage, shutters, and filter wheels are controlled by the Metamorph software. Hint: The OKO Lab stage-top incubator system includes adapters for a variety of different plate, dish, or coverslip sizes.
- Position the LabTek II chambered coverglass in the incubator by opening the lid of the pre-warmed and equilibrated incubator, placing the chambered coverglass in the adapter, and holding in place with modeling clay. Leave the cover on the chambered coverglass so that the cell culture medium will not dry out. Close the lid and position the entire incubator on the microscope stage, ensuring that the incubator is held firmly in place.
- Using Metamorph, set up your experiment by selecting "Apps/Multidimensional Acquisition" in the menu bar of the software. This will bring up a window in which you can select the frequency and length of the timelapse, the exposure time for each color (if doing multiple settings), the number and location of the stage positions, and the number of z-sections (if desired). Select where to save the data files. Hint: If using software other than Metamorph, the functions may be slightly different, but the overall concept is the same. Micromanager, an open source ImageJ-based acquisition software that is compatible with most hardware setups, is an excellent alternative.
- For the purposes of this protocol, we will acquire images at two wavelengths (brightfield and mCherry) every 15 minutes for 8 hours at 15 stage positions. Hint: If better time resolution is desired, then you can shorten the time interval between acquisitions; however, fewer stage positions can be used, and thus fewer mitotic cells will be available for analysis. It is important when considering time intervals to take into account the time required for the filter wheel to switch between filter sets.
- Determine the optimal exposure time for each wavelength by first focusing on a field of cells using brightfield illumination. In the software, adjust the autofocus function only for the brightfield channel (this will allow the software to autofocus at each stage position before each acquisition). Hint: We use a 40x dry phase-contrast objective to give excellent resolution without the need for oil. Other objectives may be used depending on the optical resolution desired.
- Switch to the mCherry wavelength and snap an image using a 50 msec exposure. Adjust the exposure time to the minimum required to see a good image. It is essential to limit the amount of light exposure to ensure sustained cell viability. As a general rule, this can best be achieved by using a neutral density filter (to reduce the excitation light flux) and a longer camera exposure time rather than by increasing the illumination strength. Repeat this procedure for any additional wavelengths to be used. Hint: To determine long-term cell viability at a given exposure for your experiment, you can preview the total number of images a cell can survive over the desired timelapse by temporarily adjusting the timepoint spacing from minutes to seconds (i.e., 10 min. becomes 10 seconds). If your cells survive 100-200 exposures (or the appropriate number), then your exposure is fine. If not, reduce your excitation light, exposure time, or the total number of images to simulate your full experiment.
- Next, select and mark an appropriate number of stage positions so that you can achieve adequate sampling of the cell population. Metamorph will record the positions and will return there for each acquisition. Hint: I generally try to find positions in which there are plenty of cells to image, but not so many that they are too dense. Also, it is important to select enough positions so that you will have a good chance of observing a large number of cells progressing through mitosis.
- After all timelapse, wavelength exposure time, and stage position information have been recorded, select the "Preview" button on the screen to determine if the software is controlling the equipment appropriately.
- Once you are satisfied, select the "Acquire" button on the screen to begin acquisition. Then sit back and allow the computer and microscope to do the work. Hint: Observe the automation through at least one full round of acquisition to ensure that everything is working properly.
Image processing and analysis
- After the acquisition has finished, the next step is to transfer the image data into a form that is easier to handle. For the purposes of this protocol, I will demonstrate first how to generate movies using Metamorph, then how to generate image montages using the ImageJ program. Either format will be useful for quantification purposes.
- The first step is to review the data. To do so, select "Apps/Review Multidimensional Data" in the menu bar. Select the location of your files, then select "View". This will allow you to review the stack of images from each stage position individually. Select the desired stage position, then "Load Images". You will be able to advance through the data frame-by-frame.
- For those stage positions in which cells go through mitosis (as determined by both DNA and cellular morphology), you can make movies and montages using Metamorph, or with other programs such as ImageJ (available for free through NIH).
- To make a movie in Metamorph, select "Process/Save movie" in the menu bar. You will be able to select which frames to use, the speed, and file type of the movie. Then select "Save Movie".
- To make a montage, I save the image stack as a .stk file, which can be used in other programs such as ImageJ.
- Open the file in ImageJ and advance the frames until you find a cell going through mitosis. Crop the area around the cell and select "Image/Duplicate". Hint: Make sure to duplicate all frames.
- To make a montage, select "Image/Stacks/Make Montage" in the menu bar. Here you can specify which frames you want to include, the size and shape of the montage, and whether you want borders between the frames. Select these and hit "Okay". Save the montage as a .tif file and do any further processing in either ImageJ or Adobe Photoshop. Hint: Change montage files from the 16-bit format used by Metamorph to 8-bit format for easier image processing.
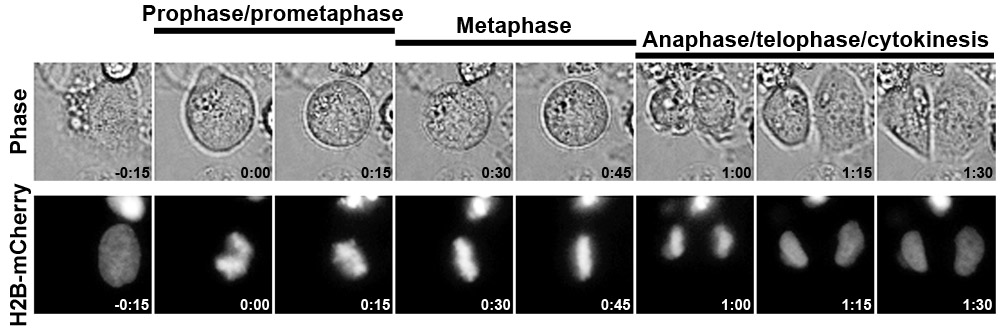
- To calculate time in different stages of mitosis, determine t=0 (first sign of DNA condensation or cell rounding), count the number of frames until chromosomes are aligned at the equator (time in prophase/prometaphase), frames until chromosomes begin to segregate (time in metaphase), and frames until cells begin to flatten (anaphase/telophase/cytokinesis). The calculated time in each mitotic stage depends on the time interval between each frame.
Representative Results

Figure 1 illustrates the results from a typical control siRNA transfection experiment using a HeLa cell line expressing histone H2B-mCherry. This method of has been used effectively to quantify mitotic timing, revealing an unexpected role for the nucleoporin Nup153 in the timing of late mitosis1. Please click here to see a larger version of figure 1.
Discussion
With recent advances in imaging and fluorescent protein technology, live imaging has become a routine aspect of cellular analysis2. A variety of GFP (and other color variants3) -tagged proteins are widely available or relatively easy to construct and can be used to track a number of cell division hallmarks including DNA/chromosome dynamics4, 5, centrosome duplication6, cyclin B dynamics7, nuclear envelope breakdown and reassembly8, 9, mitotic spindle formation10, and various stages of cytokinesis11. Tagged proteins may be used alone or in combination when the excitation/emission spectra of fluorescent tags are compatible, allowing the coordination between specific events to be assessed. If greater spatial and/or temporal resolution is/are desired, confocal microscopy whether laser scanning, spinning disk, or resonance scanning can be used, and the list of sophisticated microscopy options with ever-increasing resolution continues to grow. Live imaging of mitosis in mammalian cells has also been adapted for use in high-throughput RNAi and small molecule screens12-14. Thus, while one s initial experiments using this technique may be relatively simple, the possibilities for building on this strategy are extensive.
Acknowledgments
This work was supported by the American Cancer Society (PF-07-103-01-CSM), the National Institutes of Health (R01 GM61275 and P30 CA042014), the Leukemia and Lymphoma Society, and the Huntsman Cancer Foundation.
Materials
| Name | Company | Catalog Number | Comments |
| Lipofectamine RNAiMAX | Invitrogen | 13778-075 | |
| Lab Tek II Chambered Coverglass (4-well) | Thermo Fisher Scientific, Inc. | 12-565-337 | Additional chamber sizes are available |
| Fibronectin | Sigma-Aldrich | F1141 | |
| Stage-top cell incubator | OKO Lab | Can use any appropriate chamber | |
| Automated inverted fluorescence microscope | Olympus Corporation | Can use any appropriate microscope | |
| Software package | Metamorph | Can use any appropriate software |
References
- Mackay, D. R., Elgort, S. W., Ullman, K. S. The nucleoporin Nup153 has separable roles in both early mitotic progression and the resolution of mitosis. Mol Biol Cell. 20, 1652-1660 (2009).
- Khodjakov, A., Rieder, C. L. Imaging the division process in living tissue culture cells. Methods. 38, 2-16 (2006).
- Shaner, N. C., Steinbach, P. A., Tsien, R. Y. A guide to choosing fluorescent proteins. Nat Methods. 2, 905-909 (2005).
- Meraldi, P., Draviam, V. M., Sorger, P. K. Timing and checkpoints in the regulation of mitotic progression. Dev Cell. 7, 45-60 (2004).
- Mora-Bermudez, F., Ellenberg, J. Measuring structural dynamics of chromosomes in living cells by fluorescence microscopy. Methods. 41, 158-167 (2007).
- Prosser, S. L., Fry, A. M. Fluorescence imaging of the centrosome cycle in mammalian cells. Methods Mol Biol. 545, 165-183 (2009).
- Malureanu, L. A. BubR1 N terminus acts as a soluble inhibitor of cyclin B degradation by APC/C(Cdc20) in interphase. Dev Cell. 16, 118-131 (2009).
- Anderson, D. J., Hetzer, M. W. Reshaping of the endoplasmic reticulum limits the rate for nuclear envelope formation. J Cell Biol. 182, 911-924 (2008).
- Beaudouin, J., Gerlich, D., Daigle, N., Eils, R., Ellenberg, J. Nuclear envelope breakdown proceeds by microtubule-induced tearing of the lamina. Cell. 108, 83-96 (2002).
- Marcus, A. I. Visualization of spindle behavior using confocal microscopy. Methods Mol Med. 137, 125-137 (2007).
- Steigemann, P. Aurora B-mediated abscission checkpoint protects against tetraploidization. Cell. 136, 473-484 (2009).
- Draviam, V. M. A functional genomic screen identifies a role for TAO1 kinase in spindle-checkpoint signalling. Nat Cell Biol. 9, 556-564 (2007).
- Neumann, B. High-throughput RNAi screening by time-lapse imaging of live human cells. Nat Methods. 3, 385-390 (2006).
- Stegmeier, F. Anaphase initiation is regulated by antagonistic ubiquitination and deubiquitination activities. Nature. 446, 876-881 (2007).
