An easy and convenient method to determine the extent of gap junction tracer coupling between retinal neurons is described. This technique enables one to investigate the function of the electrical synapses between neurons in the intact retina under different illumination conditions and at different times of the day and night.
Method Article
Cut-loading: A Useful Tool for Examining the Extent of Gap Junction Tracer Coupling Between Retinal Neurons
In This Article
Summary
Abstract
In addition to chemical synaptic transmission, neurons that are connected by gap junctions can also communicate rapidly via electrical synaptic transmission. Increasing evidence indicates that gap junctions not only permit electrical current flow and synchronous activity between interconnected or coupled cells, but that the strength or effectiveness of electrical communication between coupled cells can be modulated to a great extent1,2. In addition, the large internal diameter (~1.2 nm) of many gap junction channels permits not only electric current flow, but also the diffusion of intracellular signaling molecules and small metabolites between interconnected cells, so that gap junctions may also mediate metabolic and chemical communication. The strength of gap junctional communication between neurons and its modulation by neurotransmitters and other factors can be studied by simultaneously electrically recording from coupled cells and by determining the extent of diffusion of tracer molecules, which are gap junction permeable, but not membrane permeable, following iontophoretic injection into single cells. However, these procedures can be extremely difficult to perform on neurons with small somata in intact neural tissue.
Numerous studies on electrical synapses and the modulation of electrical communication have been conducted in the vertebrate retina, since each of the five retinal neuron types is electrically connected by gap junctions3,4. Increasing evidence has shown that the circadian (24-hour) clock in the retina and changes in light stimulation regulate gap junction coupling3-8. For example, recent work has demonstrated that the retinal circadian clock decreases gap junction coupling between rod and cone photoreceptor cells during the day by increasing dopamine D2 receptor activation, and dramatically increases rod-cone coupling at night by reducing D2 receptor activation7,8. However, not only are these studies extremely difficult to perform on neurons with small somata in intact neural retinal tissue, but it can be difficult to adequately control the illumination conditions during the electrophysiological study of single retinal neurons to avoid light-induced changes in gap junction conductance.
Here, we present a straightforward method of determining the extent of gap junction tracer coupling between retinal neurons under different illumination conditions and at different times of the day and night. This cut-loading technique is a modification of scrape loading9-12, which is based on dye loading and diffusion through open gap junction channels. Scrape loading works well in cultured cells, but not in thick slices such as intact retinas. The cut-loading technique has been used to study photoreceptor coupling in intact fish and mammalian retinas7, 8,13, and can be used to study coupling between other retinal neurons, as described here.
Protocol
1. Intact neural retina preparations for goldfish, mice and rabbits
- Perform all of the following steps, including those described in "2) Cut-loading," under constant ambient (background) illumination. Please note that for the purposes of this protocol, the procedures are described as performed in constant darkness (i.e. under very dark (i.e. "scotopic") conditions ≤ 0.0001 lux) using night vision infrared goggles, but other higher intensity levels of constant ambient illumination can be used instead to determine the effect of other levels of ambient illumination on gap junction tracer coupling.
- Dark-adapt the experimental animal (goldfish, mouse or rabbit) for at least 1 hr before surgery.
- As described previously7, deeply anesthetize goldfish by placing them in tricaine methanesulfonate (MS222; 150 mg/L of buffered (sodium bicarbonate-containing) fish tank water), and deeply anesthetize mice with ketamine (100 mg/kg, i.p.) and rompun (10 mg/kg, i.p.). Deeply anesthetize rabbits with urethane (loading dose: 2.0 g/kg, i.p.) and also use local intraorbital anesthesia (2% Xylocaine), as described previously8. All experimental procedures involving the care and use of animals should be performed in accordance with federal guidelines and be reviewed and approved by local university animal care and use committees. (Note: In the experiments described here, all experimental procedures involving the care and use of fish, mice and rabbits were performed in accordance with NIH guidelines and were reviewed and approved by Ohio State University Institutional Animal Care and Use Committee.)
- For fish, mice and rabbits, following enucleation, remove the anterior portion of each eyeball. Then, place a piece of filter paper on top of the posterior portion of the eye and invert the filter paper and eye, so that the filter paper is underneath the posterior portion of the eye. Then, using fine forceps dissect the intact neural retina from the posterior portion of the eye by gently peeling away the pigment epithelium/choroid/sclera, which are attached to each other, from the neural retina, which is attached to the filter paper. As this is done, cut the optic nerve using fine spring-loaded scissors. The neural retina, oriented photoreceptor-side up, should now be attached to the filter paper and separated from the rest of the eye.
2. Cut-loading
- Submerge the retinas in oxygenated Ringer's solution (Table 1) in a 6-well plate (~5 mL/well) for 30 min under constant ambient (background) illumination (e.g. under very dark (i.e. "scotopic") conditions) with or without a test drug. Maintain fish retinas in oxygenated (5% CO2 /95% O2) bicarbonate-based Ringer's at 22°C by sealing the 6-well plate with parafilm and maintain mouse and rabbit retinas at 36°C in a 5% CO2 /95% O2 incubator. When a test drug is used, it should be present during all subsequent steps until fixation
- Prepare the tracer solution (typically 100 μL) by dissolving neurobiotin (0.5%), a biotinylated molecule, in Ringer's solution immediately before cutting through the retina. Note that 0.5% rhodamine dextran (high (> 10,000) MW) may be added to the solution. Due to its high molecular weight, rhodamine dextran does not cross gap junctions and only labels cells that have been damaged by the cut. As shown in Fig. 3, this is a useful way to distinguish cells that have accumulated neurobiotin because they have been injured, from those that have accumulated the tracer by diffusion through gap junctions.
- Place the neurobiotin solution on a glass (or plastic) Petri dish, tap the filter paper, to which the retina is attached, on a paper towel to remove excess Ringer, dip a razor blade (or other sharp blade) in the neurobiotin solution and then make a radial cut through the retina and filter paper. If preferred, spacers can be used so that the cut is made through the retina, but not the filter paper. The cut should be oriented perpendicular to the retinal surface. Dip the razor blade in the neurobiotin solution again and cut the retina a second time. Repeat this up to 4 cuts per retina (see Fig. 1). Use a dissecting microscope when making razor cuts through mouse and other small retinas.
- As shown in Fig. 1, submerge the retina again in fresh Ringer's medium, with or without test drug, using a 6-plate well (5 mL Ringer/well). Incubate the retina for 15 min to allow for loading and diffusion.
- Wash three times for 5 min each with fresh Ringer's medium with or without test drug.
- Fix the retina with 4% paraformaldehyde in 0.1 M phosphate buffer (PBS, pH 7.4) for 1 hr at RT.
- Wash with 0.1 M PBS overnight at 4°C.
- The following day, react with 2% streptavidin-Alexa 488 (final concentration 10 μg/mL) in 0.1M PBS + 0.3% Triton X-100, and keep overnight at 4°C.
- Wash three times for 10 min each with 0.1M PBS at RT
- In PBS, detach the retina from the filter paper and then, using a fine brush, place the retina, oriented photoreceptor-side up, onto a slide.
- Gently mount with Vectashield mounting medium (Vector Laboratories, Burlingame, CA).
- Take pictures with a laser scanning confocal microscope (e.g. Zeiss 510 META) at the same magnification, resolution and settings for every experimental condition, so that you can compare the effects of different experimental conditions (e.g. test drugs; illumination conditions) on the extent of gap junction tracer coupling (Fig. 2A-C and Fig. 4A-C). Although a single image may contain all of the labeled cells, it is recommended that you collect a z-stack of the area of interest and collapse it into a single image.
3. Quantification of tracer coupling using ImageJ
- In the LSM image browser, open the image, click EXPORT and save the picture as a TIF-16 bit NOT compressed file. Scale bar should be included in this TIF image.
- Using NIH ImageJ software, measure fluorescence intensity of Alexa-488-labeled neurobiotin from low-magnification images of whole-mount retinas. Open the TIF file using ImageJ software and then draw a straight line corresponding to the scale bar. Go to ANALYSE, SET SCALE and enter the known distance and unit of length, then click OK. Now measurement results can be presented in calibrated units, such as millimeters.
- Select the area of interest using the rectangular selection tool. The peak of fluorescence should be positioned at the left border of your selection. Make sure that there is no fluorescence signal near the right border. If not, rotate the active image (IMAGE, then ROTATE).
- Click ANALYSE and PLOT PROFILE. You should see a curve with an exponential decay from the left to the right.
- Click COPY in the pop-up window and paste it in EXCEL. Now you see two columns showing the distance from the cut (left column) and the fluorescence intensity as a function of the distance from the cut (right column).
- Divide each raw fluorescence value by the maximum fluorescence value to obtain the relative fluorescence intensity.
- Copy two columns corresponding to the distance from the cut (X) and the relative fluorescence intensity (Y), and then paste them into Origin software.
- Fit with the EXPONENTIAL DECAY #1 function (Fig. 2D and Fig. 4D), which is in the form:
Y = Y0 + Ymax*exp(-x/λ)
where Y is the relative fluorescence intensity, Yo is the background fluorescence, Ymax is the maximum relative fluorescence, λ is the space (length) constant, and x is the distance from the cut. - Compare the space constant (λ) values at different experimental conditions using the t-test or ANOVA (Fig. 2E and Fig. 4E). Note that alternative techniques of quantification have been described by others13,14.
4. Representative Results
Representative examples of photoreceptor cell tracer coupling as determined by cut-loading are presented in Figures 2 and 3 (fish) and Figure 4 (rabbit). Confocal images were taken using the same settings for comparison (Fig. 2A-C and Fig. 4A-C) and the fluorescence intensity was plotted as a function of the distance from the cut and fitted by the exponential function shown in No. 3.8 above (Fig. 2D and Fig. 4D). Space constant values for each condition are shown in Figures 2E and 4E, illustrating that the extent of gap junction tracer coupling can be quantified using the cut-loading technique. In addition, the results are highly reproducible. Use of the cut-loading technique as a means of quantifying the extent of gap junction tracer coupling is also validated by the finding that fluorescence intensity decreases exponentially as a function of distance from the cut in all cases examined7,8 (see also Figs. 2D and 4D here), indicating that neurobiotin entered the photoreceptors via the razor cut and not from other retinal sites. Moreover, the qualitatively similar day/night difference in photoreceptor cell tracer coupling observed in goldfish with tracer injections into single cones and with cut-loading7 substantiates cut-loading as a relatively accurate means of measuring the extent of photoreceptor coupling.
The cut-loading technique can also be used to investigate other types of electrical synapses in the retina. For example, Figure 5 illustrates that rabbit A-type (Fig. 5A) and B-type (Fig. 5B) horizontal cells exhibit homologous tracer coupling following cut-loading and diffusion of neurobiotin under dark-adapted conditions.
| Compound | Fish | Mouse | Rabbit |
| NaCl | 130 | 120 | 117 |
| NaHCO3 | 20 | 25 | 30 |
| NaH2PO4 | - | 1 | 0.5 |
| KCL | 2.5 | 5 | 3.1 |
| Glucose | 10 | 10 | 10 |
| MgCl2 | 1 | - | - |
| MgSO4-7H2O | - | 1 | 1.2 |
| Glutamine | - | 0.1 | 0.1 |
| CaCl2 | 0.7 | 2 | 2 |
Table 1: Composition of the Ringer's solutions for goldfish, mouse and rabbit retinas. The concentrations are presented in mM. The Ringer's solutions are bubbled with 5% CO2 /95% O2 and maintained at 22 °C (fish) or 36 °C (mammals). "-" : not included in the Ringer for this species.
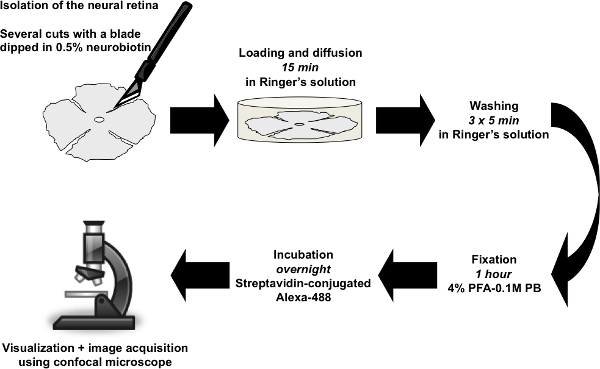
Figure 1.: Flow chart showing the cut-loading procedure. After isolation of the intact neural retina, several radial cuts were made by a blade that was first dipped in 0.5% neurobiotin solution. The retina was incubated for tracer loading and diffusion, and then washed before fixation with 4% paraformaldehyde (PFA) in 0.1M phosphate buffer (PB). Tracer coupling was examined using streptavidin-conjugated Alexa-488.
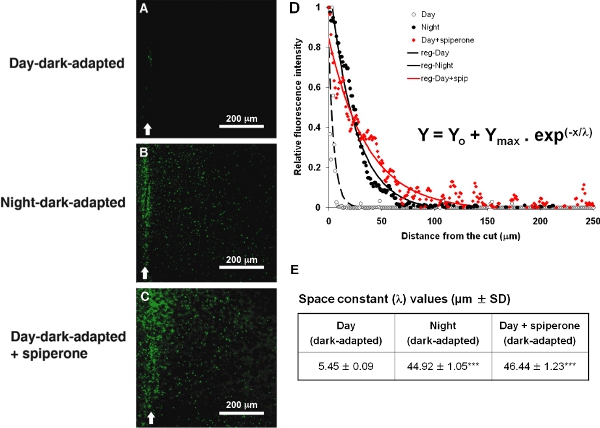
Figure 2. Day-night difference in photoreceptor tracer coupling in goldfish is revealed by the cut-loading technique. Photoreceptor cell gap junction neurobiotin tracer coupling was extensive at night (B) and in the day following application of spiperone (10 μM), a selective dopamine D2 receptor antagonist (C), but not in the day under control conditions (A). D) Normalized relative fluorescent intensity as a function of the distance from the cuts (indicated by arrows in A-C). E) Space constant values obtained from the data in D and other experiments (n = 4). ***P < 0.001.
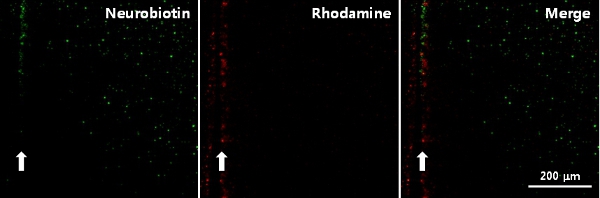
Figure 3. A representative example showing fluorescence in the photoreceptor cell layer of a dark-adapted goldfish retina at night following cut-loading with a solution of both neurobiotin and rhodamine dextran. Rhodamine dextran (shown in red), which does not diffuse through open gap junction channels due to its high molecular weight (> 10,000 MW), only labeled cells near the cut. In contrast, neurobiotin (shown in green) diffused through gap junctions and can be seen in photoreceptor cells far from the cut. The location of the cut is indicated by the arrow in each panel. Scale bar: 200 μm.
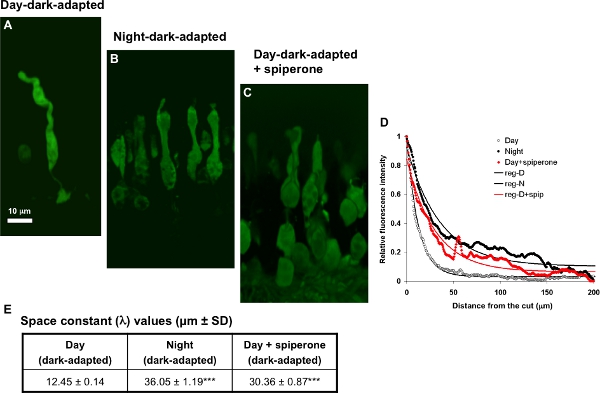
Figure 4. Day-night difference in photoreceptor tracer coupling in rabbit retina is revealed by the cut-loading technique. Photoreceptor cell gap junction neurobiotin tracer coupling was extensive at night (B) and in the day following application of spiperone (10 μM) (C), but not in the day under control conditions (A). In A-C, perpendicular views of the 3D reconstruction of rabbit photoreceptors near the cut are shown. D) Normalized relative fluorescent intensity as a function of the distance from the cuts. E) Space constant values obtained from the data in D and other experiments (n = 3). ***P < 0.001.
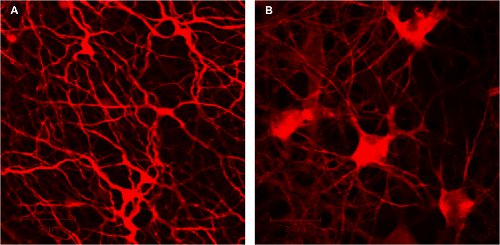
Figure 5. Cut-loading reveals that dark-adapted rabbit horizontal cells are tracer coupled. Both A-type (A) and B-type (B) horizontal cells in dark-adapted rabbit retinas exhibited homologous neurobiotin tracer coupling.
Discussion
The cut-loading method described here is a useful and straightforward technique to determine the extent of gap junction tracer coupling between retinal neurons under different illumination conditions and at different times of the day and night. Advantages of this technique include the ability to quantify the extent of gap junction tracer coupling between neurons in intact retinal tissue under a variety of illumination conditions during the day and night and to do so for coupled neurons that have small diameter somata. Limitations of the technique in the study of gap junctions in intact tissue fall into two general categories. First, tracer diffusion through open gap junctions may be relatively difficult to observe due to a) the small diameter of or the charge associated with the open channels and b) the relative volumes of coupled cellular compartments1,14,15. That is, tracer diffusion from a small cell to a larger cell or group of coupled cells, compared to tracer diffusion from a larger cell to a smaller cell, may be more difficult to detect due to tracer dilution. Second, under some physiological conditions, the extent of tracer diffusion through gap junctions in intact tissue may not accurately reflect the strength of gap junctional conductance due to differences in the conductance of small electric current-carrying ions, compared to the permeability of relatively large tracer molecules1,14,15. In general, evidence of tracer coupling strongly suggests the presence of functioning, open gap junction channels, but under some physiological conditions, tracer diffusion may not occur or be observed even though electrophysiological recordings suggest the presence of functioning, open gap junctions.
It seems likely that the cut-loading technique can also be used to investigate the extent of gap junction tracer coupling between neurons in intact tissue from other regions of the central nervous system.
Disclosures
No conflicts of interest declared.
Acknowledgements
This work was funded by NIH grant EY005102 to S.C.M. and EY018640 to C.P.R.
Materials
| Name | Company | Catalog Number | Comments |
|---|---|---|---|
| Tricaine methane sulfonate (MS222) | Sigma-Aldrich | A5040 | 150 mg/L of buffered fish tank water |
| Urethane | Sigma-Aldrich | U2500 | 2 g/kgloading dose |
| Dual Tube Night Vision Goggle | Night Optics USA | D-221 | |
| Filter Paper, Grade No. 4 | Whatman, GE Healthcare | 1004-090 | |
| Fine Forceps, Dumont No. 5, Biologie, 11 cm long | Fine Science Tools | 11295-10 | |
| Fine Scissors, spring-loaded, 8 mm blade, straight | Fine Science Tools | 15025-10 | |
| Neurobiotin | Vector Laboratories | SP-1120 | 0.5% |
| Streptavidin-conjugated Alexa 488 | Invitrogen | S11223 | 2% |
| Dextran rhodamine(high (> 10,000) MW) | Invitrogen | D1817 | 0.5% |
| Vectashield mounting medium | Vector Laboratories | H-1000 | |
| Zeiss 510 META Laser Scanning Confocal Microscope | Carl Zeiss, Inc. | ||
| LSM-5 Image Browser 3,2,0,115 | Carl Zeiss, Inc. | ||
| ImageJ Software | National Institutes of Health | ||
| OriginPro 8.0 | OriginLab |
References
- Bennett, M. V. L., Zukin, R. S. Electrical coupling and neuronal synchronization in the mammalian brain. Neuron. 41, 495-511 (2004).
- Connors, B. W., Long, M. A. Electrical synapses in the mammalian brain. Annu. Rev. Neurosci. 27, 393-418 (2004).
- Vaney, D. I. Many diverse types of retinal neurons show tracer coupling when injected with biocytin or Neurobiotin. Neurosci. Lett. 125, 187-190 (1991).
- Bloomfield, S. A., Völgyi, B. The diverse functional roles and regulation of neuronal gap junctions in the retina. Nat. Rev. Neurosci. 10, 495-506 (2009).
- Weiler, R., Pottek, M., He, S., Vaney, D. I. Modulation of coupling between retinal horizontal cells by retinoic acid and endogenous dopamine. Brain. Res. Brain. Res. Rev. 32, 121-129 (2000).
- Xin, D., Bloomfield, S. A. Effects of nitric oxide on horizontal cells in the rabbit retina. Vis. Neurosci. 17, 799-811 (2000).
- Ribelayga, C., Cao, Y., Mangel, S. C. The circadian clock in the retina controls rod-cone coupling. Neuron. 59, 790-801 (2008).
- Ribelayga, C., Mangel, S. C. Identification of a circadian clock-controlled neural pathway in the rabbit retina. PLoS One. 5, e11020-e11020 (2010).
- Ouyang, X., Winbow, V. M., Patel, L. S., Burr, G. S., Mitchell, C. K., O'Brien, J. Protein Kinase A mediates regulation of gap junctions containing connexin35 through a complex pathway. Brain. Res. Mol. Brain. Res. 135, 1-11 (2005).
- Patel, L. S., Mitchell, C. K., Dubinsky, W. P., O'Brien, J. Regulation of gap junction coupling through the neuronal connexin Cx35 by nitric oxide and cGMP. Cell. Commun. Adhes. 13, 41-54 (2006).
- Peters, J. L., Cassone, V. M., Zoran, M. J. Melatonin modulates intercellular communication among cultured chick astrocytes. Brain. Res. 1031, 10-19 (2005).
- Cusato, K., Bosco, A., Rozental, R., Guimarães, C. A., Reese, B. E., Linden, R., Spray, D. C. Gap junctions mediate bystander cell death in developing retina. J. Neurosci. 23, 6413-6422 (2003).
- Li, H., Chuang, A. Z., O'Brien, J. Photoreceptor coupling is controlled by connexin 35 phosphorylation in zebrafish retina. J. Neurosci. 29, 15178-15186 (2009).
- Mills, S. L., Massey, S. C. The kinetics of tracer movement through homologous gap junctions in the rabbit retina. Vis. Neurosci. 15, 765-777 (1998).
- Mills, S. L., Massey, S. C. A series of biotinylated tracers distinguishes three types of gap junction in retina. J. Neurosci. 20, 8629-8636 (2000).
Reprints and Permissions
