This video demonstrates bioluminescence imaging to track glioblastoma progression in an immunocompetent mouse model, using luciferase-expressing tumor cells and luciferin to quantify tumor growth non-invasively.
A subscription to JoVE is required to view this content. Sign in or start your free trial.
Method Article
Bioluminescence Imaging of an Immunocompetent Mouse Model for Glioblastoma
781 views
⸱
June 17th, 2025
In This Article
Abstract
Protocol
All procedures involving animal models have been reviewed by the local institutional animal care committee and the JoVE veterinary review board.
1. Bioluminescence Imaging of GL261 Tumor Growth
- Spray a generous amount of disinfectant (0.05% dimethyl ammonium chloride solution) on a clean paper towel. Use the disinfectant-soaked paper towel to thoroughly wipe the black sheet, nose cones, and divider inside the imaging chamber where the animals will be in contact with the device. Thoroughly wipe all surfaces with a clean, dry paper towel. Repeat this once more and wait 5 min.
- Initialize the imaging station.
- Anesthetize the mouse with a 300 μl mixture containing 200 μl of Ketamine/Xylazine and 100 μl of luciferin (D-Luciferin potassium salt, 150 mg/kg) by intraperitoneal injection.
- Wait 10 min after injection and confirm if the mice are completely under anesthesia by pinching the tail. To set up the imaging system, select "Luminescent", "Auto" exposure time, and "Medium" binning. Place the mice on the imaging station and click the "Acquire" button to start the image. Ensure that the time after injection is consistent with each imaging session.
- After the image is successfully acquired, an image window and tool palette should appear. Click the region of interest (ROI) or “ROI Tools” and select "auto" from the circle icon. To define ROIs, encircle the area of signal on the image and then take measurements of the ROI as a unit of photons/sec/sr/cm2.
- Take the mice out of the imaging chamber and monitor them until they become ambulant and retain normal activity. Typically, recovery time is approximately 15 minutes. Do not return the mice to the cage with other animals until they fully recover from anesthesia.
- Monitor tumor growth by bioluminescence imaging twice a week until animals present the following symptoms: weight loss (loss of more than 20% relative to the weight prior to implantation), inappetence (complete anorexia for 24 hr), and lack of sustained purposeful response to gentle stimuli (weak attempt to get up), at which time they should be euthanized.
- Normalize luminescence values for each day against corresponding readings obtained on the first day of bioluminescence imaging (Figure 1A).
- For statistical analysis, generate survival curves using the Kaplan-Meier estimator and compare the differences between survival curves using a log-rank test.
Access restricted. Please log in or start a trial to view this content.
Results
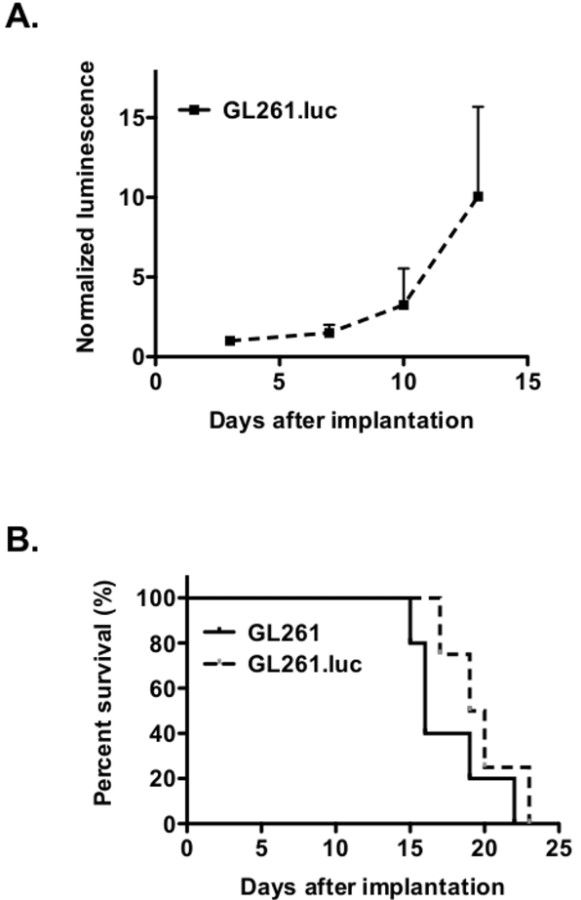
Figure 1. Luciferase expression does not affect in vivo tumor growth and animal survival. (A) Bioluminescence ...
Access restricted. Please log in or start a trial to view this content.
Materials
| Name | Company | Catalog Number | Comments |
|---|---|---|---|
| D-Luciferin, Potassium salt | Gold Biotechonology | LUCK-100 | Store away from light |
| Living Image software | Caliper Life Sciences | Contact for Quote | None |
| Xenogen Lumina | Caliper Life Sciences | Contact for Quote | None |
| Ketaset | Pfizer | NDC 0856-2013-01 | Control substance |
| Xylazine | Sigma-Aldrich | 23076-35-9 | None |
| 28 G needle (with syringe) | Fisher | 22-004-270 | AKA Insulin Syringe |
| Heating pad | Dunlap | HP950 | |
| PDI Alcohol prep pads | Fisher | 23-501-711 |
