We describe a methodology combining automated cell culturing with high-content imaging to visualize and quantify multiple cellular processes and structures, in a high-throughput manner. Such methods can aid in the further functional annotation of genomes as well as identify disease gene networks and potential drug targets.
Method Article
High Content Screening in Neurodegenerative Diseases
In This Article
Summary
Abstract
The functional annotation of genomes, construction of molecular networks and novel drug target identification, are important challenges that need to be addressed as a matter of great urgency1-4. Multiple complementary 'omics' approaches have provided clues as to the genetic risk factors and pathogenic mechanisms underlying numerous neurodegenerative diseases, but most findings still require functional validation5. For example, a recent genome wide association study for Parkinson's Disease (PD), identified many new loci as risk factors for the disease, but the underlying causative variant(s) or pathogenic mechanism is not known6, 7. As each associated region can contain several genes, the functional evaluation of each of the genes on phenotypes associated with the disease, using traditional cell biology techniques would take too long.
There is also a need to understand the molecular networks that link genetic mutations to the phenotypes they cause. It is expected that disease phenotypes are the result of multiple interactions that have been disrupted. Reconstruction of these networks using traditional molecular methods would be time consuming. Moreover, network predictions from independent studies of individual components, the reductionism approach, will probably underestimate the network complexity8. This underestimation could, in part, explain the low success rate of drug approval due to undesirable or toxic side effects. Gaining a network perspective of disease related pathways using HT/HC cellular screening approaches, and identifying key nodes within these pathways, could lead to the identification of targets that are more suited for therapeutic intervention.
High-throughput screening (HTS) is an ideal methodology to address these issues9-12. but traditional methods were one dimensional whole-well cell assays, that used simplistic readouts for complex biological processes. They were unable to simultaneously quantify the many phenotypes observed in neurodegenerative diseases such as axonal transport deficits or alterations in morphology properties13, 14. This approach could not be used to investigate the dynamic nature of cellular processes or pathogenic events that occur in a subset of cells. To quantify such features one has to move to multi-dimensional phenotypes termed high-content screening (HCS)4, 15-17. HCS is the cell-based quantification of several processes simultaneously, which provides a more detailed representation of the cellular response to various perturbations compared to HTS.
HCS has many advantages over HTS18, 19, but conducting a high-throughput (HT)-high-content (HC) screen in neuronal models is problematic due to high cost, environmental variation and human error. In order to detect cellular responses on a 'phenomics' scale using HC imaging one has to reduce variation and error, while increasing sensitivity and reproducibility.
Herein we describe a method to accurately and reliably conduct shRNA screens using automated cell culturing20 and HC imaging in neuronal cellular models. We describe how we have used this methodology to identify modulators for one particular protein, DJ1, which when mutated causes autosomal recessive parkinsonism21.
Combining the versatility of HC imaging with HT methods, it is possible to accurately quantify a plethora of phenotypes. This could subsequently be utilized to advance our understanding of the genome, the pathways involved in disease pathogenesis as well as identify potential therapeutic targets.
Protocol
1. Automated adherent cell culture process (Figure 1)20
- Prepare the automated cell culture system for the input of cell culture plates. Load consumables (e.g. pipette tips, cell culture plates, assay plates) into the system using the graphical user interface (GUI). Ensure there is sufficient cell culture media, phosphate buffered saline (PBS) and trypsin in the robotic system.
- Manually seed two omnitray plates with 2 x 10⁶ cells per plate, of the SH-SY5Y neuroblastoma cell line. Maintain cells in Opti-MEM with 10% fetal bovine serum (FBS). Put the plates into the cell culture robot using the GUI. The cells will be incubated at 37°C and 5% CO2.
- Choose which cell culture protocol needs to be initiated20. One can chose from an adherent cell culture process22, culturing and expansion of embryonic stem (ES) cells on mouse feeder cells23 or culturing of suspension cells22.
- Select the adherent cell culture protocol (Figure 1) and ensure adherent cell line specific parameter files are adjusted so that the confluence threshold (the area of the omnitray plate that contains cells) is set at 70%. Set total trypsinization time to two minutes.
- Instruct the robot to prepare new omnitray plates, with a seeding cell number of 2 x 10⁶ cells per plate.
- Input omnitray plates into the cell culture system using the automated adherent cell culture protocol (Figure 1). This protocol involves the following steps: plates are incubated and imaged until they reach the pre-defined confluence threshold. If cells do not reach the confluence threshold within 5 readings, plates are removed from the system. Upon reaching the user defined confluence threshold, cells are washed, trypsinized and counted. A pre-defined number of cells are added to new omnitray plates and if there are sufficient numbers of cells, a specified number of assay plates are transported to the deck and a defined number of cells dispensed into each well. Assay plates can be directly imaged using the integrated microscope or output from the system for further processing.
- Instruct the system to prepare 4 assay plates per omnitray plate, with a total of 5,000 cells per well.
2. shRNA virus production and plating into assay plates (Time required: 6 days)
- Grow bacterial glycerol stocks containing the shRNA vectors (Open Biosystems, TRC1) overnight in 2ml of Luria-Bertani medium media containing 100 μg/ml of ampicilin (Sigma-Aldrich).
- Extract plasmids following the manufacturer's protocol (Promega Wizard MagneSil Tfx).
- Produce virus using the RNAi Consortium High-Throughput Lentiviral Production (96 well plate) protocol 24. Working with lentivirus is relatively safe because the virus particles used for transduction are replication-deficient and split-gene packaging strategies are used for their production. However, when working with lentivirus, additional biosafety procedures are necessary to minimize the risk to oneself and others 25. All experiments must be conducted in a MLII or BSL2 safety level laboratory. All plastics (pipettes, plastic dishes, media) that have been in contact with lentivirus particles should be incubated with bleach for 24 hours prior to disposal.
- Calculate the multiplicity of infection (MOI) of the lentivirus by determining the percentage of GFP positive cells using the pLKO.1 GFP plasmid (Sigma-Aldrich).
- Plate lentivirus into assay plates, with an MOI of 3.
3. Lentiviral transduction and neuronal differentiation of SH-SY5Y cells (Time required: 6 days)
- Cells are added to the assay plates (see step 1.7). Load assay plates containing shRNA lentivirus into the automated cell culture system.
- After 24 hours, the media on the assay plates will be changed to Opti-MEM containing 0.5% FBS and 0.1 μM retinoic acid to begin the differentiation process. Differentiation of SH-SY5Y cells allows visualization of neuritic structures and synchronizes cell division.
- Continue incubation of the assay plates in the differentiation media for 5 days. This ensures maximal knockdown of target gene expression.
- On day 5, add 50 μM H2O2 to half of the assay plates for 24 hours to stimulate translocation of DJ1 to the mitochondria.
- On day 6, add Mitotracker CmxROS (Invitrogen) to the cells, at a final concentration of 200 nM per well and incubate at 37°C for 30 minutes.
- One can instruct the system to image plates directly using the HC imager or plates can be exported from the system for further processing.
4. Automated immunostaining of assay plates (Time required: 2 days)
Image quality is paramount for conducting a sensitive and reliable HCS. Damage to the cellular monolayer due to inaccurate pipetting can lead to poor image quality and irreproducible results. In order to minimize cell layer damage, the immunostaining was conducted using a robotic station. The procedure is similar to one that has been previously described26 but has been customized to increase throughput and reduce consumable usage.
- Fix cells with 100 μl of 4% paraformaldehyde pre-warmed to 37°C. Incubate for 20 minutes at room temperature.
- Wash cells with 200 μl of PBS for 5 minutes, 3 times.
- Incubate assay plates with 200 μl of PBS containing 0.1 % Triton (PBST) for 10 minutes.
- Wash cells with 200 μl of PBS for 5 minutes, 3 times.
- Incubate assay plates with 200 μl of block buffer (PBST with 5% FBS) for 1 hour at room temperature.
- Wash cells with 200 μl of PBS for 5 minutes, 3 times.
- Incubate with the following primary antibodies overnight at 4°C:
- Goat DJ1 N20 (Santa Cruz, 5 μg/ml)
- Rabbit β-III tubulin (Sigma-Aldrich, 1 μg/ml)
- On the following day, wash cells with 200 μl of PBS for 5 minutes, 3 times.
- Incubate assay plates with the following secondary antibodies 1 hour at room temperature:
- AlexaFluor 488 donkey anti-goat (Invitrogen, 2 μg/ml)
- AlexaFluor 647 goat anti-rabbit (Invitrogen, 2 μg/ml
- Wash cells with 200 μl of PBS for 5 minutes, 3 times.
- Incubate cells with Hoechst (Invitrogen; 1 μg/ml) for 10 minutes.
- Wash cells with 200 μl PBS for 5 minutes, 3 times.
- Store plates at 4°C until they can be imaged.
5. High content image acquisition and image analysis (Time required: 5 days)
- Image a total of 30 fields per well using the 20x objective lens. Visualize DJ1 with the FITC filter set, the mitochondria with the TRITC filter set, β-III tubulin with the Cy5 filter set and the nuclei using the UV filter set (Figure 3).
- Analyze the images using the Compartmental Analysis Bioapplication (Cellomics, ThermoFisher) to determine the average intensity of the Mitotracker signal within the mitochondria. (Figure 4B, F).
- To determine the average overlap coefficient between DJ1 and the mitochondria, analyze the images using the Cellomics Colocalisation bioapplication (Cellomics, ThermoFisher). Define regions of interest (ROI) as follows: ROI A - nucleus (Figure 4A, E), ROI B - mitochondria (Figure 4 B, F). Exclude ROI A from ROI B to ensure analysis of only the cytoplasm. Define the mitochondria as target region I and DJ1 as target region II (Figure 4C, G).
- Analyze the images using the Neuronal Profiling bioapplication (Cellomics, Thermofisher) to trace the average lengths of the neurites from the β-III tubulin staining (Figure 4D, H).
- Image plates using the Opera LX automated confocal reader (Perkin-Elmer). Image a total of 30 fields per well using the 60x objective lens with water immersion. Visualize mitochondria with the 561 nM laser and nuclei with UV excitation.
- Analyze the images using the Spot-Edge-Ridge (SER) texture features algorithm. The SER-Ridge filter transmits intensity in pixels forming ridge-like patterns. The more fragmented the mitochondria, the higher the SER-Ridge score (Figure 8).
6. Data normalization and analysis
- Import the data from the image analysis software into the BioConductor CellHTS2 package for the R software environment (R version 2.11.1, BioConductor version 2.6).
- Logarithm base (2) transform the data prior to per plate median based normalization27, 28. Do not apply the variance adjustment per plate.
- To identify modifiers of a phenotype, use a two way ANOVA between the different treatment groups i.e. Scrambled infected untreated cells vs. scrambled toxin treated cells vs. target gene untreated cells vs. target gene treated cells (Figures 5-7).
7. Representative results
Mutations within DJ1 give rise to early onset-recessive parkinsonism21, but it is unclear how loss of DJ1 gives rise to the disease phenotype. It is known that cells deficient of DJ1 are more susceptible to oxidative stress-induced cell death and in response to oxidative stress, DJ1 translocates from the cytoplasm to the mitochondria 29, 30. By constructing HC assays to monitor these phenotypes, we can identify genes that regulate or affect phenotypes associated with DJ1. This approach can help decipher the pathways within which DJ1 functions and that could be involved in disease pathogenesis.
Example of an epistatic interaction with DJ1 (Figure 5): Knockdown of DJ1 in cells exposed to toxin results in a greater loss of cell viability (BAR-B: image-B) compared to cells infected with scrambled lentivirus (BAR-A: image-A). Knockdown of target gene A has a similar effect to that observed in cells with a DJ1 knockdown (BAR-C: image-C). Knockdown of both DJ1 and target gene A results in a significantly greater loss of cell viability than loss of either gene alone (BAR-D: image-D). This suggests an epistatic interaction between DJ1 and target gene A.
Example of a gene regulating DJ1 translocation (Figure 6): When cells are exposed to a toxin, DJ1 translocates from the cytoplasm to the mitochondria, which is quantified by a higher overlap coefficient between DJ1 and the mitochondria (BAR-A: image A versus BAR-C: image C). In cells where target gene B has been silenced, less DJ1 translocates to the mitochondria when cells are exposed to the toxin. This suggests that target gene B is involved in the transport of DJ1 to the mitochondria. (BAR-B: image B and BAR-D: image D)
Example of a gene involved in neuronal outgrowth (Figure 7): Knockdown of target gene C in wild type SH-SY5Y cells results in a significant increase in neurite length (BAR-B: image-B) compared to cells infected with lentivirus expressing scrambled shRNA (BAR-A: image A). This effect is lost in cells incubated with toxin (BAR-C and D).
Example of a gene involved in mitochondrial morphology (Figure 8): Infection of wild type SH-SY5Y cells with shRNA targeting gene D results in a decrease in the mitochondrial SER-Ridge segmentation value (Figure 8, Image C and D) when compared to cells infected with scrambled lentivirus (Figure 8, Image A and B).

Figure 1. Outline of automated cell culture protocol. Please click here to see a large version of this figure.
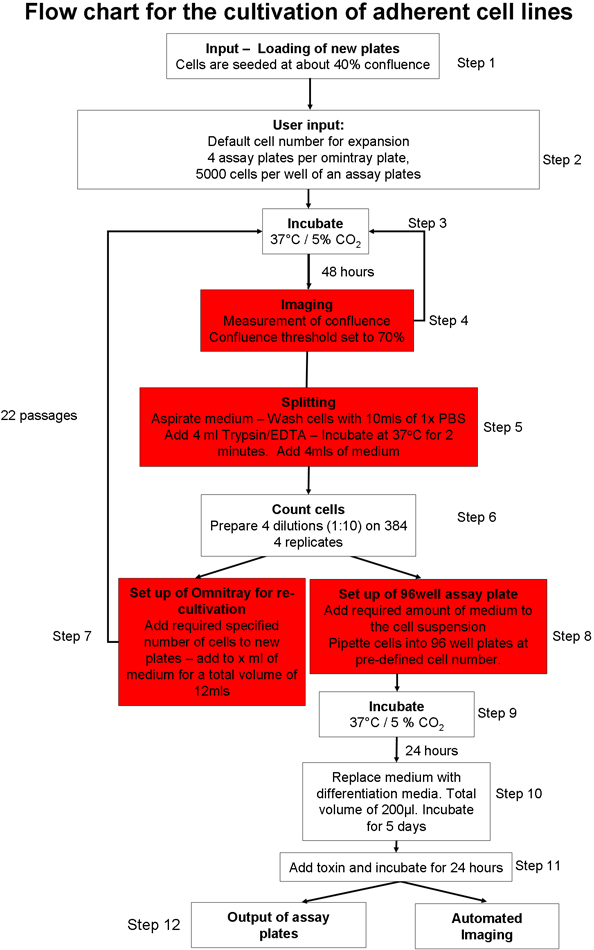

Figure 2. Schematic overview of the screening process, image analysis and statistical methods used during the screening process: i) Cells are cultured until they are confluent and subsequently plated into the assay plates containing the shRNA lentivirus. Cells are differentiated for 5 days and toxin is then added to the plates for 24 hours. Assay plates are output from the system and immunostained. The amount of time taken for each of the processes is indicated in brackets. ii) Data is acquired using a HC imager (cell viability, protein translocation and neuronal outgrowth) and an automated confocal imager (mitochondrial morphology). Data are exported to CellHTS2 package within R, base (2) log transformed and normalized. Two-way ANOVA is used to identify significant interactions between the different variables. Please click here to see a large version of this figure.


Figure 3. Composite images of cells acquired by HC imaging. A) Untreated cells, B) Cells treated with H2O2. DJ1 is labeled in green, the mitochondria in red and the nuclei in blue. Neurite staining is not highlighted.

Figure 4. Quantification of several cellular features obtained from a HCS. A-D) Untreated SH-SY5Y cells. E-H) H2O2 treated SH-SY5Y cells. A, E) Nuclei segmentation and definition of ROI A; B, F) Identification and quantification of mitochondria, ROI B; C, G) Identification of DJ1, Target channel II; D, G) Identification and calculation of average neurite length. Cells close to the edge of the image are excluded from the analysis. Inset images are images prior to analysis.

Figure 5. Identification of a gene in epistasis with DJ1 (letters on the bars correspond to the lettering on the images). Images A through D are SH-SY5Y cells labeled with Mitotracker CMXRos (red) that was used for quantification of cell health.

Figure 6. Identification of a gene regulating DJ1 translocation (letters on the bars correspond to the lettering on the images). Images A through D are SH-SY5Y cells labeled for DJ1 (green), mitochondria (red) and nuclei (blue) that were used for quantification of DJ1 translocation to the mitochondria.

Figure 7. Identification of a gene involved in neuronal outgrowth (letters on the bars correspond to the lettering on the images). Images A through D are SH-SY5Y cells labeled for β-III tubulin (green) and nuclei (blue) which were used for quantification of neurite length.

Figure 8. Identification of a gene involved in regulating mitochondrial morphology. Image A and C are composite images of SH-SY5Y cells infected with scrambled shRNA or an shRNA targeting gene D respectively. Mitochondria are colored in red while nuclei are colored in blue. Image B and D are visualizations of the SER-Ridge quantification.
Discussion
With the decreasing costs of HT/HC cellular screening systems, combined with the availability of powerful genome-wide tools to modify gene function, HT/HC screens are becoming commonplace in academia. The approach has already been successfully applied to diverse areas of research such as the identification of drug targets in cancer 9, 31-33 and embryonic development 34-36 and even has potential for application in deciphering the pathways involved in neuropsychiatric disorders 37,38. However implementation of such a system requires a significant investment of time and effort with process optimization often taking a minimum of 6 months. All steps, such as trypsinization times, pipetting speeds and seeding densities have to be adjusted, to ensure that cells are healthy and grow consistently. Prevention of bacterial contamination is one of the most difficult challenges facing automated cell culture with weekly cleaning protocols in combination with constant rinsing of all liquid bearing lines with 70% ethanol being necessary for contamination free cultures. It will be also necessary to improve the robotics so that additional instruments, such as confocal microscopes for higher resolution and -80°C freezers for compound storage can be integrated.
There are also limitations that need to be addressed to improve the sensitive, speed and utility of this method to study gene networks and identify genes involved in pathogenic molecular pathways.
To conduct a HT/HC screen and ensure that reliable data is collected, several aspects have to be optimized. First, reliability of the measurement is paramount and is dependent upon the robustness and sensitivity of the assay. For example, the assays described above are suitable for smaller screens, but are difficult to implement on a genome wide scale, due to the number processing steps required before image acquisition. Thus, one would have to construct stable cell lines expressing the reporter gene, which would allow for direct imaging and lead to decreased variation due to the reduced number of processing steps. At present, designing an assay that accurately depicts and reliably quantifies a phenotype of interest is a major bottleneck in the HC screening process.
Many screens are conducted in mammalian cells using different RNAi libraries, all of which suffer from off-target effects, limited gene silencing efficiency and incomplete genome coverage. Thus libraries need to be made which are more specific, potent and have better coverage. Efforts are underway to create such libraries (http://www.sigmaaldrich.com/life-science/functional-genomics-and-rnai/shrna/library-information.html) and it is hoped such endeavors will improve the reproducibility of HT/HC screen hits.
A limitation of many large scale cell based screens are that they are conducted in neuroblastoma cells because they can be genetically manipulated and cultured to large numbers with relative ease. However, the relevance of 'hits' identified in ex vivo cell culture models to in vivo function is questionable, especially as the brain consists of highly specialized cell types that form a dense and complicated network of synaptic connections to function as a highly integrated unit. As a consequence, it is common that hits identified using the screening approach described above, are validated in secondary screens using additional techniques and in more physiological relevant models 39. To improve the translation of hits identified during HCS, more representative and sophisticated models, such as primary cells and differentiated stem cells or co-culture systems need to be developed and adapted for HT/HC approaches.
With a combination of automated cell culturing and HC imaging one can rapidly gain new insights into how neurons function and determine which pathways are important to disease development. Combining HCS/HTS data with information generated from other 'omics' approaches, it will then be possible to construct a systems biology overview of brain diseases, thus facilitating therapeutic development.
Disclosures
We have nothing to disclose
Acknowledgements
We thank the Hamilton programmers and specialists for continuing support and Eva Blaas for technical assistance. This work was supported by two NWO Investment grants (911-07-031 and 40-00506-98-10011), The Prinses Beatrix Fonds Wetenschapsprijs 2009 and the Neuroscience Campus Amsterdam; S.J. is supported by Ti-Pharma: T5-207.
Materials
| Name | Company | Catalog Number | Comments |
|---|---|---|---|
| AI.CELLHOST | Hamilton Co | http://www.hamiltonrobotics.com/en-uk/applications/cellomics/ | |
| OPTI-MEM | Invitrogen | 31985-054 | |
| RETINOIC ACID | Sigma-Aldrich | R2625 | |
| OMNITRAY PLATES | Nalge Nunc international | 465219 | |
| 96 WELL CULTURE PLATES | Greiner Bio-One | 655086 | |
| DJ1 N20 ANTIBODY | Santa Cruz Biotechnology, Inc. | SC27004 | |
| BETA-III TUBULIN ANTIBODY | Sigma-Aldrich | T3952 | |
| MITOTRACKER CMXROS | Invitrogen | M-7512 | |
| H–CHST-33342 | Invitrogen | H1399 | |
| HYDROGEN PEROXIDE | Sigma-Aldrich | 216763-100ML | |
| TRYPSIN | Invitrogen | 25050014 | |
| DULBECCO’S PHOSPHATE BUFFERED SALINE | Invitrogen | 14190086 | |
| PROMEGA WIZARD MAGNESIL TFX | Promega Corp. | A2380 | |
| SHRNA CLONES | Open Biosystems | http://www.openbiosystems.com/RNAi/shRNALibraries/ TRCLibraryDetails/ | |
| CELLOMICS BIOAPPLICATIONS | Thermo Fisher Scientific, Inc. | http://www.thermo.com/hcs |
References
- Geschwind, D. H., Konopka, G. Neuroscience in the era of functional genomics and systems biology. Nature. 461, 908-915 (2009).
- Ge, H., Walhout, A. J., Vidal, M. Integrating 'omic' information: a bridge between genomics and systems biology. Trends. Genet. 19, 551-560 (2003).
- Zhu, H., Snyder, M. 'Omic' approaches for unraveling signaling networks. Curr. Opin. Cell. Biol. 14, 173-179 (2002).
- Jain, S., Heutink, P. From single genes to gene networks: high-throughput-high-content screening for neurological disease. Neuron. 68, 207-217 (2010).
- Manolio, T. A. Finding the missing heritability of complex diseases. Nature. 461, 747-753 (2009).
- Nalls, M. A. Imputation of sequence variants for identification of genetic risks for Parkinson's disease: a meta-analysis of genome-wide association studies. Lancet. 377, 641-649 (2011).
- Simon-Sanchez, J. Genome-wide association study confirms extant PD risk loci among the Dutch. Eur. J. Hum. Genet. 19 (6), 655-661 (2011).
- Van Regenmortel, M. H. Reductionism and complexity in molecular biology. Scientists now have the tools to unravel biological and overcome the limitations of reductionism. EMBO. Rep. 5, 1016-1020 (2004).
- Aherne, G. W., McDonald, E., Workman, P. Finding the needle in the haystack: why high-throughput screening is good for your health. Breast. Cancer. Res. 4, 148-154 (2002).
- An, W. F., Tolliday, N. J. Introduction: cell-based assays for high-throughput screening. Methods. Mol. Biol. 486, 1-12 (2009).
- Mayr, L. M., Bojanic, D. Novel trends in high-throughput screening. Curr. Opin. Pharmacol. 9, 580-588 (2009).
- Hertzberg, R. P., Pope, A. J. High-throughput screening: new technology for the 21st century. Curr. Opin. Chem. Biol. 4, 445-451 (2000).
- Conrad, C., Gerlich, D. W. Automated microscopy for high-content RNAi screening. J. Cell. Biol. 188, 453-461 (2010).
- Thomas, N. High-content screening: a decade of evolution. J. Biomol. Screen. 15, 1-9 (2010).
- Arrasate, M., Finkbeiner, S. Automated microscope system for determining factors that predict neuronal fate. Proc. Natl. Acad. Sci. U. S. A. 102, 3840-3845 (2005).
- Dragunow, M. High-content analysis in neuroscience. Nat. Rev. Neurosci. 9, 779-788 (2008).
- Varma, H., Lo, D. C., Stockwell, B. R. High throughput screening for neurodegeneration and complex disease phenotypes. Comb. Chem. High. Throughput. Screen. 11, 238-248 (2008).
- Durr, O. Robust hit identification by quality assurance and multivariate data analysis of a high-content, cell-based assay. J. Biomol. Screen. 12, 1042-1049 (2007).
- Miller, J. Quantitative relationships between huntingtin levels, polyglutamine length, inclusion body formation, and neuronal death provide novel insight into huntington's disease molecular pathogenesis. J. Neurosci. 30, 10541-10550 (2010).
- Jain, S., Sondervan, D., Rizzu, P., Bochdanovits, Z., Caminada, D., Heutink, P. The Complete Automation of Cell Culture. Journal of Biomolecular Screening. 16 (8), (2011).
- Bonifati, V. Mutations in the DJ-1 gene associated with autosomal recessive early-onset parkinsonism. Science. 299, 256-259 (2003).
- Ricardo, R., Phelan, K. Trypsinizing and Subculturing Mammalian Cells. J. Vis. Exp. (16), e755-e755 (2008).
- Kent, L. Culture and Maintenance of Human Embryonic Stem Cells. J. Vis. Exp. (34), e1427-e1427 (2009).
- Moffat, J. A lentiviral RNAi library for human and mouse genes applied to an arrayed viral high-content screen. Cell. 124, 1283-1298 (2006).
- Volksgezondheid, M. V. Integrale versie van de Regeling genetisch gemodificeerde organismen en het Besluit genetische gemodificeerde. Organismen. , (2004).
- Anderl, J. L., Redpath, S., Ball, A. J. A Neuronal and Astrocyte Co-Culture Assay for High Content Analysis of Neurotoxicity. J. Vis. Exp. (27), e1173-e1173 (2009).
- Wiles, A. M., Ravi, D., Bhavani, S., Bishop, A. J. An analysis of normalization methods for Drosophila RNAi genomic screens and development of a robust validation scheme. J. Biomol. Screen. 13, 777-784 (2008).
- Canet-Aviles, R. M. The Parkinson's disease protein DJ-1 is neuroprotective due to cysteine-sulfinic acid-driven mitochondrial localization. Proc. Natl. Acad. Sci. U. S. A. 101, 9103-9108 (2004).
- Blackinton, J. Formation of a stabilized cysteine sulfinic acid is critical for the mitochondrial function of the parkinsonism protein DJ-1. J. Biol. Chem. 284, 6476-6485 (2009).
- Gupta, P. B. Identification of selective inhibitors of cancer stem cells by high-throughput screening. Cell. 138, 645-659 (2009).
- Luo, J. A genome-wide RNAi screen identifies multiple synthetic lethal interactions with the Ras oncogene. Cell. 137, 835-848 (2009).
- Mouchet, E. H., Simpson, P. B. High-content assays in oncology drug discovery: opportunities and challenges. IDrugs. 11, 422-427 (2008).
- Vogt, A. Automated image-based phenotypic analysis in zebrafish embryos. Dev. Dyn. 238, 656-663 (2009).
- Pardo-Martin, C. High-throughput in vivo vertebrate screening. Nat. Methods. 7, 634-636 (2010).
- Vogt, A., Codore, H., Day, B. W., Hukriede, N. A., Tsang, M. Development of automated imaging and analysis for zebrafish chemical screens. J. Vis. Exp. (40), e1900-e1900 (2010).
- Ross, P. J., Ellis, J. Modeling complex neuropsychiatric disease with induced pluripotent stem cells. F1000. Biol. Rep. 2, 84-84 (2010).
- Ebert, A. D., Svendsen, C. N. Human stem cells and drug screening: opportunities and challenges. Nat. Rev. Drug. Discov. 9, 367-372 (2010).
- An, W. F., Tolliday, N. Cell-based assays for high-throughput screening. Mol. Biotechnol. 45, 180-186 (2010).
Reprints and Permissions
