We describe a method for tracking the endomembrane rupture elicited by the intracellular bacteria Shigella flexneri and Mycobacterium tuberculosis upon host cell invasion. Our assay makes use of CCF4, a host cytoplasmic FRET probe in live or fixed cells. This reporter is degraded by an enzyme activity present on the bacterial surface.
Method Article
Single Cell Measurements of Vacuolar Rupture Caused by Intracellular Pathogens
* These authors contributed equally
In This Article
Summary
Abstract
Shigella flexneri are pathogenic bacteria that invade host cells entering into an endocytic vacuole. Subsequently, the rupture of this membrane-enclosed compartment allows bacteria to move within the cytosol, proliferate and further invade neighboring cells. Mycobacterium tuberculosis is phagocytosed by immune cells, and has recently been shown to rupture phagosomal membrane in macrophages. We developed a robust assay for tracking phagosomal membrane disruption after host cell entry of Shigella flexneri or Mycobacterium tuberculosis. The approach makes use of CCF4, a FRET reporter sensitive to β-lactamase that equilibrates in the cytosol of host cells. Upon invasion of host cells by bacterial pathogens, the probe remains intact as long as the bacteria reside in membrane-enclosed compartments. After disruption of the vacuole, β-lactamase activity on the surface of the intracellular pathogen cleaves CCF4 instantly leading to a loss of FRET signal and switching its emission spectrum. This robust ratiometric assay yields accurate information about the timing of vacuolar rupture induced by the invading bacteria, and it can be coupled to automated microscopy and image processing by specialized algorithms for the detection of the emission signals of the FRET donor and acceptor. Further, it allows investigating the dynamics of vacuolar disruption elicited by intracellular bacteria in real time in single cells. Finally, it is perfectly suited for high-throughput analysis with a spatio-temporal resolution exceeding previous methods. Here, we provide the experimental details of exemplary protocols for the CCF4 vacuolar rupture assay on HeLa cells and THP-1 macrophages for time-lapse experiments or end points experiments using Shigella flexneri as well as multiple mycobacterial strains such as Mycobacterium marinum, Mycobacterium bovis, and Mycobacterium tuberculosis.
Introduction
Numerous bacterial pathogens are internalized in membrane-enclosed compartments of eukaryotic cells during their course of infection. Cell entry occurs either through phagocytosis by specialized host cells, as is the case for Mycobacterium tuberculosis that are ingested by macrophages, or the pathogens actively induce their uptake into typically non-phagocytic cells. In the case of induced uptake, for example for Shigella flexneri, the pathogen injects effector proteins into the host cytosol that hijack among other cell functions the tightly regulated endomembrane sorting machinery resulting in bacterial localization within an endosomal compartment 1,2. Subsequently, Shigella disrupts the enclosing membrane leading to vacuolar rupture and cytosolic access of the pathogen interfering with host membrane trafficking and avoiding delivery to the lysosome. More recently, phagolysosomal rupture has also been found as infection strategy used by Mycobacterium tuberculosis, a pathogen that was thought for a long time to be exclusively localized within a membrane-bound compartment 3,17.
To investigate dynamics of subcellular membrane trafficking of invasive pathogens, great improvements have been achieved since the transmission electron microscopy (TEM) based studies of the late 1980s 4,5. For example, fluorescence microscopy based methods using dyes, antibodies against bacterial surface components, or markers for co-localization with subcellular compartments took over 6,7. However, they still do not yield precise spatiotemporal resolution and robustness to measure vacuolar rupture by bacterial pathogens quantitatively.
This hurdle has been addressed with an assay based on the cephalosporin derived CCF4-AM FRET reporter that was first used to study gene expression 8. Then, it was used in the context of infection biology to investigate effector secretion and to follow the uptake of Neisseria into host cells 9,10,11. We developed an assay taking advantage of this reporter for studying vacuolar rupture induced by Shigella flexneri 12 and Mycobacterium tuberculosis17. The principle of our method is described in Figure 1 using Shigella flexneri. First, host cells are loaded with the FRET CCF4-AM substrate that is trapped inside the cytoplasm after cleaving off the AM ester moieties. Then, cells are infected with Shigella flexneri. β-lactamase present on the surface of the bacteria is able to cleave the CCF4 substrate as soon as vacuolar rupture occurs. This leads to a loss of FRET signal switching the emission peak from 535 nm to 450 nm upon excitation of the probe at 405 nm. The ratiometric measurement of the 450/535 nm intensities highlights vacuolar integrity: low ratios reflect membrane-enclosed or extracellular bacteria whereas high ratios reflect contact between the bacteria and the host cytosol. We also report an adaptation of this method for studying phagosomal rupture induced by Mycobacterium tuberculosis in THP-1 macrophages. The experimental principles remain the same although the sequence is reversed, CCF4-AM loading is applied only after bacterial infection.
Thus, by quantitative ratiometric fluorescence measurements at the single cell level, the vacuolar rupture of Shigella flexneri can be tracked in real time and in fixed samples from different cell types 12,13,14. Furthermore, this method can be adapted to a number of other invasive pathogens as shown in this study using Mycobacterium bovis and Mycobacterium tuberculosis. Finally, the miniaturization of our protocol to 96 well (or 384 well) formats allows screening of numerous conditions at high throughput.
Protocol
The assay works in various formats, however we recommend scaling down the sample volume to save reagents, particularly CCF4-AM. Therefore, the following protocol is described for fixed HeLa cells or THP-1 macrophage-like cells in a 96 well format, then for live HeLa cells in 35 mm glass bottom dishes. The assay can be adapted for other pathogens. Besides Shigella infection, we describe the assay for THP-1 phagocytosing different mycobacterial strains.
Importantly, after CCF4-AM loading, all reagents and buffers including washing buffers require the presence of probenecid at 1 mM. Probenecid is an anion channel inhibitor that promotes cytosolic retention of CCF4 throughout all the steps of the protocol. Fixed samples should be acquired within a few hours after the experiment since the CCF4 signal is not stable for long time periods.
1. CCF4 Assay on Fixed Samples Using Shigella flexneri (96 Well Plates)
- Preparing bacteria for overnight cultures. Inoculate the bacterial pre-cultures wild type (M90T AfaI) and mutant (BS176 AfaI) strains 1 day before infection in 8 ml tryptic casein soy broth (TCSB) supplemented with ampicillin (50 μg/ml) in a shaker at 37 °C overnight.
- Plating cells for infection. Seed HeLa cells in 96 well plates 1 day before infection at a density of 5 x 10³ cells per well in DMEM containing 10% Fetal Calf Serum (FCS) and 1% penicillin-streptomycin in a 5% CO2 incubator in a final volume of 100 μl. In the case of THP-1 macrophage-like cells, cell plating is done 2 days before infection at a density of 5 x 10⁴ cells/well, and they are incubated with 30 nM Phorbol Myristate Acetate (PMA) in RPMI containing 10% Fetal Calf Serum (FCS), 1% penicillin-streptomycine and 0.05 mM 2-mercaptoethanol.
- Preparing bacteria for subculture. Inoculate overnight bacterial cultures at a 1/100 dilution in TCSB supplemented with 50 μg/ml ampicillin in a shaker at 37 °C for 2.5 hr (OD600 = 0.3 to 0.4).
- Loading cells with CCF4-AM. Prepare the CCF4-AM loading mix for a final volume of 25 μl per well containing 1 mM probenecid (Sigma), 1.5 μM CCF4-AM (6 μM in the case of THP-1) and 1.25 μl of loading solution B (100 mg/ml Pluronic-F127 surfactant in DMSO/0.1% acetic acid provided along CCF4-AM LiveBlazer Loading Kit by Invitrogen) in EM buffer (120 mM NaCl, 7 mM KCl, 1.8 mM CaCl2, 0.8 mM MgCl2, 5 mM Glucose, 25 mM HEPES at pH 7.3). Wash the cells once with PBS and add 25 μl of CCF4-AM loading mix per well at room temperature in the dark for 2.5 hr.
- Preparing bacteria for infection. Spin 1 ml of bacterial subcultures at 9,000 rpm for 1 min. Wash once with 500 μl PBS, spin at 9,000 rpm for 1 min and resuspend in 500 μl PBS supplemented with 10 μg/ml poly-L-lysine (Sigma) and 40 μg/ml β-lactamase (Sigma). After 10 min of incubation on a rotating wheel at room temperature, wash once with 500 μl PBS and resuspend bacteria in 500 μl EM buffer/1 mM probenecid.
- Cell infection and fixation. Wash the cells once with 150 μl PBS/1 mM probenecid, prepare a mix of 10 μl of bacteria resuspended in a final volume of 100 μl of EM buffer/1 mM probenecid and distribute it to each well. After 15 min incubation in the dark at room temperature, switch the plate to 37 °C for 1 hr (90 min in the case of THP-1), wash with 150 μl PBS/1 mM probenecid and fix with 50 μl paraformaldehyde 4%/1 mM probenecid for 10 min in the dark. Then, wash with 150 μl PBS/1 mM probenecid, incubate for 30 min with 30 μl of 10 μM nuclei dye Draq5 (Biostatus), wash with 150 μl PBS/1 mM probenecid and leave samples in 100 μl PBS/1 mM probenecid.
- Acquisition settings of fixed samples. Acquisition is performed either using (i) an inverted epifluorescence microscope with a 20x (0.5 Numerical Aperture (NA), 2.1 Working Distance (WD)) or 40x (0.75 NA, 0.72 WD) N-Plan air objective or (ii) using a confocal microscope with a 10x objective. Fluorescence imaging is performed with excitation at 405 nm (Semrock, FF01-387/11-25) and emission detected via 450 nm (Semrock, FF02-447/60-25) and 535 nm filters (Semrock, FF01-520/35-25) using exposure times of 5 msec (transmitted light), 1,000 msec (535 nm) and 500 msec (450 nm). Confocal imaging is performed using the following exposure time: 240 msec (450 nm) and 360 msec (535 nm) for the 405 nm laser (870 μW), 640 msec (Draq5) for the 640 nm laser (2560 μW).
- Post-acquisition analysis. Subsequently, images are analyzed by a computer algorithm that allows automated scoring of the fluorescence signal for each individual cells. Software such as Metamorph 7.1 or Acapella can be used to create a script for measuring the ratio between the 450nm and 535nm emission signals (available upon request). Of note, the use of a focus calibration device coupled to automated microscopy during the acquisition allows acquiring dozens of different positions in multiple wells at the same time.
2. CCF4 Assay on Live Samples Using Shigella flexneri (35 mm Glass-bottom Format, MatTek)
- Preparing bacteria for overnight cultures. Proceed as previously described.
- Plating cells for infection. Seed HeLa cells in 35 mm glass bottom culture dishes (MatTek 10 mm Microwell, MatTek corporation) 1 day before infection at a density of 2 x 10⁵ cells/dish in a final volume of 2 ml.
- Preparing bacteria for subculture. Proceed as previously described.
- Loading cells with CCF4-AM. Prepare the CCF-AM loading mix as previously described for a final volume of 2 ml per dish. Before loading, wash the cells once with PBS.
- Preparing bacteria for infection. Proceed as previously described.
- Acquisition settings of live samples. Acquisition is performed for 60 min every 90 sec with an inverted epifluorescence microscope using a 20x (0.5 NA, 2.1 WD) or a 40x (0.75 NA, 0.72 WD) N-Plan air objective inside a 37 °C heating chamber. Fluorescence imaging is performed with excitation at 405 nm (Semrock, FF01-387/11-25) and emission detected via 450 nm (Semrock, FF02-447/60-25) and 535 nm filters (Semrock, FF01-520/35-25) using exposure times of 5 msec (transmitted light), 200 msec (535 nm) and 100 msec (450 nm).
- Cell infection and live acquisition. Wash the cells once with 2 ml PBS/1 mM probenecid, add 2 ml of EM/1 mM probenecid, mount the dish on the stage of the microscope and start the acquisition. After 6 min (time point 4), put the acquisition on hold, add 250 μl of bacteria resuspension on top of the cells and restart the acquisition.
- Post-acquisition analysis. Movies can be visualized using Metamorph or ImageJ. 450/535 nm intensity ratios for each individual cell can be obtained using ImageJ. As mentioned earlier, the use of a focus calibration device coupled to automated microscopy during the acquisition allows acquiring multiple different positions depending on the time-lapse.
3. CCF4 Assay on Fixed Samples Using Mycobacteria (96 Well Format)
- Preparing bacteria. Grow mycobacterial strains to mid-log phase in 7H9 containing albumin dextrose catalase (ADC) at 30 °C (for Mycobacterium marinum) or 37 °C (for Mycobacterium bovis BCG and Mycobacterium tuberculosis).
- Plating cells for infection. Plate THP-1 macrophages 2 days before infection incubating them with 30 nM PMA in RPMI containing 10% Fetal Calf Serum (FCS), 1% penicillin-streptomycin and 0.05 mM 2-mercaptoethanol in a 5% CO2 incubator in a final volume of 100 μl at a density of 5 x 10⁴ cells/well.
- Preparing bacteria for infection. Harvest cultures, wash and resuspend with PBS before sonication and filtration through a syringe in order to avoid clumping. Determine the concentration of each strain by OD600 measurement and infect THP-1 cells at a MOI of 1:1 at 30 °C (for Mycobacterium marinum) or 37 °C (for Mycobacterium bovis BCG and Mycobacterium tuberculosis) in RPMI medium with 5% CO2. After 2 hr, remove medium, wash 3 times with PBS and add complete fresh medium for 1 to 2 days (in the case of Mycobacterium marinum) or 3 to 7 days (in the case of Mycobacterium bovis BCG and Mycobacterium tuberculosis).
- Loading cells with CCF4-AM and fixation. Wash the cells once with PBS and prepare the CCF4-AM loading mix as previously described for a final volume of 25 μl per well using a CCF4-AM final concentration of 6 μM. Loading takes place at room temperature in the dark for 2 hr before washing with 150 μl PBS/1 mM probenecid and fixation using 50 μl paraformaldehyde at 4% supplemented with1 mM probenecid for 30 min in the dark. Then, wash with 150 μl PBS/1 mM probenecid and leave samples in 100 μl PBS/1 mM probenecid.
- Acquisition settings and post-acquisition analysis. Proceed as previously described in the first paragraph using Shigella flexneri.
Supplemental protocol
Fluorimetric assays are performed in order to check β-lactamase activity at the surface of bacteria. This should be done for each bacterial strain intended to be used in the described assay. For this purpose, washed bacteria are put in contact with 100 nM CCF4-AM (Invitrogen), 50 μg/ml porcine esterase liver extracts (sigma) in 1 ml of PBS for 1 hr at 37 °C in the dark. Soluble lactamase 1 mg/ml (Invitrogen) can be used as a positive control. Then, an emission scan is performed at 405nm excitation using a PTI Quantamaster fluorimeter and a 1 ml quartz cuvette. The loss of FRET at 535 nm and the appearance of a high 450 nm peak are visualized upon bacteria addition to the CCF4 probe.
Results
The CCF4-AM/β-lactamase approach is a robust and sensitive method for tracking vacuolar rupture of intracellular pathogens such as Shigella flexneri (Figure 1). The Shigella strains that are used in this study are termed M90T AfaI and BS176 AfaI. M90T AfaI is a Shigella flexneri strain that expresses the adhesin AfaE, which is able to efficiently bind CD55 at the surface of epithelial cells 15. Therefore AfaE expressing strains display much higher invasion abilities compared to the wild-type M90T strain in epithelial cells. BS176 AfaI is an AfaE expressing mutant Shigella flexneri strain devoid of the Shigella virulence plasmid. This strain is unable to invade HeLa cells. Nevertheless this strain is able to enter THP-1 cells since uptake in this cell line rely only on classical phagocytosis and does not require a functional type-3 secretion system. Both strains express β-lactamase, and display β-lactamase activity on their surface due to the presence of the AfaE encoding plasmid. Upon HeLa cell infection with the non-invasive BS176 AfaI strain for 1 hr, the CCF4 FRET probe remains intact, as shown in Figure 2A by the green signal (535 nm). On the contrary, the infection with the virulent M90T AfaI strain for 1 hr leads to a switch of signal towards blue (450 nm) highlighting the cleavage of the probe in the cytosol. In order to quantify this, we developed a script for the Metamorph and Acapella software that allows automated detection of cells and the measurement of intensities in the 535 and 450 nm channels for the determination of the ratiometric signal. As shown in Figure 2B, nuclei and cytosol of cells are segmented using the Draq5 channel. Then, the algorithm is capable to detect the 450 nm and the 535 nm positive cell populations for calculating the ratios between the two intensities for each individual cell that is represented as a histogram in Figure 2C. Low ratios are obtained for the mutant strain versus high ratios for the virulent strain. While this representative infection experiment was acquired using confocal microscopy, epifluorescence microscopy is also suited for this task. Figures 3 and 4 show examples using 2 different human cell types: HeLa epithelial cells and THP-1 macrophage-like cells. Upon infection with the virulent M90T AfaI Shigella strain for 1 hr and 90 min for HeLa and THP-1 cells, a switch of signal from green (535 nm) to blue (450 nm) is observed compared to BS176 AfaI infected cells (Figures 3A and 4A). The script we developed on MetaMorph software detects directly the CCF4 positive population of cells and calculate the ratio between the intensities in 450 and 535 nm channels for each individual cells. Then cells are classified as a function of their ratio using a macro developed in Excel, thus yielding histograms showing the cell distribution. As it has been the case for the other script developed for Acapella, BS176 AfaI infected cells are characterized by low ratios, whereas M90T AfaI infected cells display high ratios using the MetaMorph algorithm on HeLa cells and THP-1 macrophages (Figures 3B and 4B). Finally, an adaptation of this method to the study of mycobacteria is shown in Figure 5. Mycobacterium bovis BCG resides in the phagosome for the whole course of the experiment, as reflected by the strong 535 nm signal detected throughout the time course of the experiment. In contrast, Mycobacterium tuberculosis elicits phagosomal membrane rupture in THP-1 macrophages after more than 3 days of infection as highlighted by a 450 nm signal at 7 days of infection (Figure 5A and 5B). Using the same algorithm as for studying vacuolar rupture by Shigella, we found that Mycobacterium tuberculosis infected cells display higher 450/535 nm ratios than Mycobacterium bovis BCG after 7 days of infection (Figures 5C and 5D).
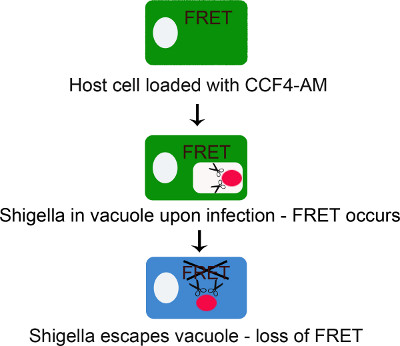
Figure 1. Scheme representing the principle of the CCF4-AM/β-lactamase assay for tracking Shigella flexneri vacuolar rupture. CCF4-AM freely diffuses through the plasma membrane into the cytoplasm where ester moieties are cleaved off by cytosolic esterases producing CCF4 anions. This reaction prevents CCF4 from entering any membrane embedded compartment. At this step, CCF4 elicits FRET at 535 nm upon excitation at 405 nm. The probe remains intact until β-lactamase expressing bacteria rupture the endocytic vacuole. At this step, the FRET signal is lost because CCF4 is cleaved by β-lactamase triggering a switch in emission from 535 nm to 450 nm upon excitation at 405 nm.
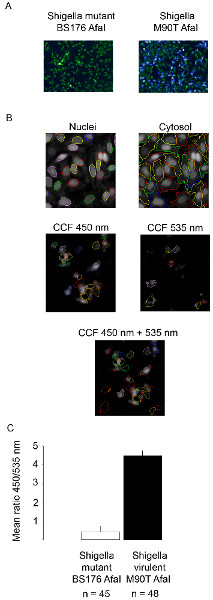
Figure 2. Tracking Shigella flexneri vacuolar rupture using confocal microscopy. (A) After 2 hr 30 min of CCF4-AM loading, HeLa cell are infected with the β-lactamase expressing Shigella flexneri BS176 AfaI mutant strain or the M90T AfaI virulent strain for 1 hr and fixed using 4% paraformaldehyde for 10 min. Then, nuclei are stained with Draq5 and cells are imaged using a confocal microscope with a 10x objective. Representative pictures were chosen with the following merged channels: the intact CCF4 probe appears at 535 nm (green), the cleaved CCF4 probe appears at 450 nm (blue). (B) Examples of pictures highlighting the detection system of our automated algorithm on the Acapella software. Segmentation of the cells (nuclei+cytosol) is obtained using the Draq5 channel. CCF4 positive cells are obtained using the 450 and 535 nm channels pooled together. (C) Histogram showing the outcome of our automated analysis on Acapella using Shigella flexneri BS176 AfaI mutant strain or M90T AfaI virulent strain. The mean ratio represents the ratio between the intensity in the 450 and 535 nm channels. Click here to view larger figure.
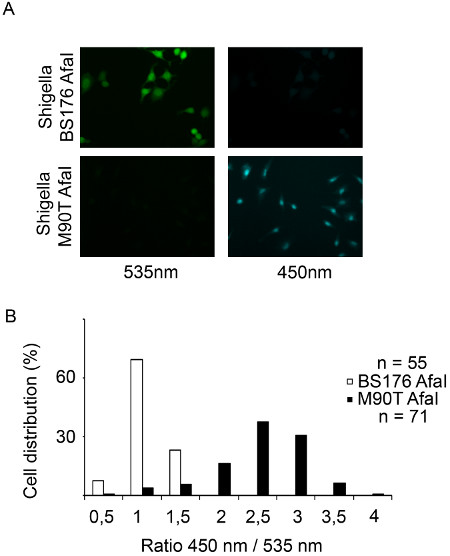
Figure 3. Tracking Shigella flexneri vacuolar rupture in HeLa cells using epifluorescence microscopy. (A) After 2 hr 30 min of CCF4-AM loading, HeLa cells are infected with the β-lactamase expressing Shigella flexneri BS176 AfaI mutant strain or the M90T AfaI virulent strain for 1 hr and fixed using 4% paraformaldehyde for 10 min. Then, cells are imaged using an epifluorescence microscope with a 20x objective. Representative pictures were chosen with the following channels: CCF4 intact probe 535 nm (green) and CCF4 cleaved probe 450 nm (blue). (B) Histogram representing the outcome of our automated analysis on MetaMorph software. The individual cells are distributed in function of their ratio of the intensities in the 450 and 535 nm channels.
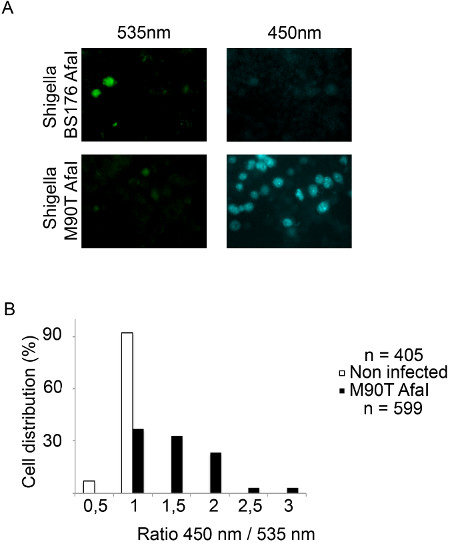
Figure 4. Tracking Shigella flexneri vacuolar rupture in THP-1 cells using epifluorescence microscopy. (A) After 2 hr 30 min of CCF4-AM loading, THP-1 cells are infected with the β-lactamase expressing Shigella flexneri BS176 AfaI mutant strain or the M90T AfaI virulent strain for 1 hr 30 min and fixed using 4% paraformaldehyde for 10 min. Then, cells are imaged using an epifluorescence microscope with a 20x objective. Representative pictures were chosen with the following channels: CCF4 intact probe 535 nm (green) and CCF4 cleaved probe 450 nm (blue). (B) Histogram representing the outcome of our automated analysis using the MetaMorph software. The individual cells are distributed in function of their ratio of the intensities in the 450 and 535 nm channels.
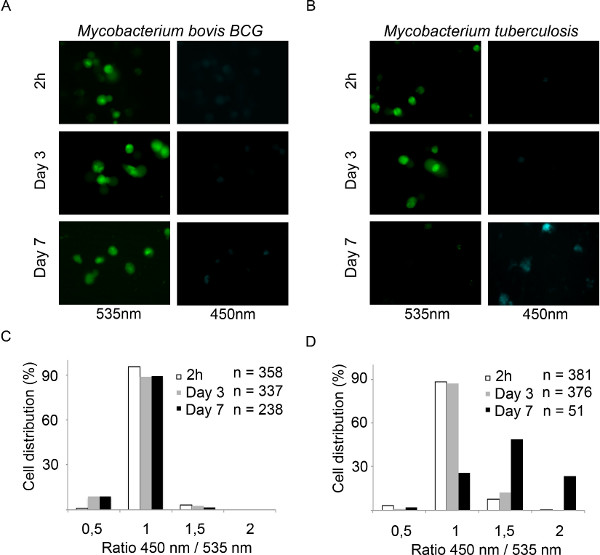
Figure 5. Tracking Mycobacterium bovis BCG and Mycobacterium tuberculosis phagosomal rupture in THP-1 macrophages using epifluorescence microscopy. (A,B) THP-1 cells are infected with β-lactamase expressing Mycobacterium bovis BCG or Mycobacterium tuberculosis for 2 hr and cultured for 3 to 7 days. After washing, cells are loaded with CCF-4-AM for 2 hr and fixed using 4% paraformaldehyde for 30 min before imaging using an epifluorescence microscope with a 40x objective. Representative pictures were chosen with the following channels: intact CCF4 probe, 535 nm (green); cleaved CCF4, probe 450 nm (blue). (C,D) Histograms presenting the outcome of our automated analysis using MetaMorph software. Individual cells are distributed as function of the ratio between the intensity in the 450 and 535 nm channels.
Discussion
The CCF4-AM/β-lactamase assay is a straightforward method to track vacuolar disruption induced by intracellular Shigella flexneri and mycobacteria in different cell types. It makes use of a lactamase sensitive cytoplasmic FRET reporter that is cleaved by an enzyme active on the surface of the bacteria.
Loss of the CCF4-AM substrate can easily be avoided by adding probenecid to all solutions after loading of the substrate. As demonstrated, the assay can be adapted to multiple cell types (epithelial cells, phagocytic cells) and formats (96 well, 35 mm glass bottom dishes, 6/12/24 well plates). For the use of the 6/12/24 well plate, sterile coverslips are distributed at the bottom of each well before seeding the cells. At the end of the experiment, coverslips are transferred on slides in mounting medium, such as Prolong Gold Antifade Reagent (Invitrogen). This way the signal is stable for longer time periods after the assay compared to the 96 wells format where samples are preserved in PBS after fixation. The high cost of the CCF4-AM substrate should be taken into account before determination of the sample volume. This is why we recommend scaling them down. Experiments are more expensive in 6/12/24 well format but the signals are stable for days. On the contrary, experiments are cheaper in the 96 well format, but samples have to be analyzed on the day of the experiment. It is noteworthy that live experiments can also be performed at the 96 well or 384 well format. This allows performing live experiment using dozens of conditions at the same time (mutant bacteria, MOI, plasmid or siRNA transfection, chemicals etc.) with numbers of positions per well. Although suited for Shigella flexneri, we highlight that "true" real time or time-lapse experiments are not feasible for mycobacteria studies since the infection cycle exceeds measurable concentrations of CCF4 that can be retained in the cytosol. For this reason, the CCF4-AM substrate is applied on cells only after invasion is achieved.
In case MetaMorph software is used for the acquisition and analysis, we recommend using the module "screen acquisition" that allows acquiring an entire 96/384 well plate with a specified number of pictures per well. Further, the module "review screen data" allows (i) visualizing the stitched picture mosaic of each well for any channel at the same time on a big "poster" and (ii) looping a specialized algorithm for measuring the intensities in the 535 and the 450 nm channels. Even though, we have been able to measure vacuolar rupture by single bacteria using time-lapse microscopy, we would like to caution that the enzymatic activity on the surface of individual bacteria varies rendering it difficult to precisely correlate number of intracellular bacteria and effectiveness of vacuolar rupture.
Given the robustness of the assay, it is suited for high throughput approaches in 96 or 384 well formats. We also have successfully adapted this protocol for FACS analysis to study the infection of cells in suspension 16. The assay can also be used for the investigation of other bacteria or carriers presenting lactamase on their surface, leading to a wide range of applications. For example, this approach can be used to study vacuolar rupture induced by other pathogens such as β-lactamase expressing Legionella pneumophila, Listeria monocytogenes or Salmonella typhimurium 12. Since Listeria monocytogenes has a short infection cycle comparable to Shigella flexneri, time-lapse experiments are possible. In contrast, because Legionella pneumophila and Salmonella typhimurium display long infection cycles, we suggest to perform end point experiments.
The variety of possible applications makes the CCF4-AM/β-lactamase assay an interesting fluorometric method for tracking vacuolar rupture induced by intracellular pathogens in fixed samples or in real time.
Disclosures
We have nothing to disclose.
Acknowledgements
This work was funded by the Agence Nationale pour la Recherche and by the European Research Council.
Materials
| Name | Company | Catalog Number | Comments |
|---|---|---|---|
| LiveBlazer FRET-B/G Loading Kit (CCF4-AM) | Invitrogen | K1089 | Protect from light, stock in - 80 ° aliquots |
| Draq5 | Biostatus | DR50050 | |
| Poly-L-lysine | Sigma | P9155 | |
| μCLEAR-PLATE, BLACK, 96 well | Greiner Bio-One | 655090 | |
| 35 mm glass bottom dishes | MatTek corp. | P35G-1.5-10-C | |
| Probenecid | Sigma | P8761 | |
| β-lactamase | Sigma | P0389 |
References
- van der Goot, F. G., Gruenberg, J. Intra-endosomal membrane traffic. Trends Cell Biol. 16, 514-521 (2006).
- Raposo, G., Marks, M. S., Cutler, D. F. Lysosome-related organelles: driving post-Golgi compartments into specialisation. Curr. Opin. Cell Biol. 19, 394-401 (2007).
- van der Wel, N., et al. M. leprae translocate from the phagolysosome to the cytosol in myeloid cells. Cell. 129, 1287-1298 (2007).
- Sansonetti, P. J., Ryter, A., Clerc, P., Maurelli, A. T., Mounier, J. Multiplication of Shigella flexneri within HeLa cells: lysis of the phagocytic vacuole and plasmid-mediated contact hemolysis. Infect Immun. 51, 461-469 (1986).
- Bobard, A., Mellouk, N., Enninga, J. Spotting the right location- imaging approaches to resolve the intracellular localization of invasive pathogens. Biochim. Biophys. Acta. 1810, 297-307 (2011).
- Beauregard, K. E., Lee, K. D., Collier, R. J., Swanson, J. A. pH-dependent perforation of macrophage phagosomes by listeriolysin O from Listeria monocytogenes. J. Exp. Med. 186, 1159-1163 (1997).
- Shaughnessy, L. M., Hoppe, A. D., Christensen, K. A., Swanson, J. A. Membrane perforations inhibit lysosome fusion by altering pH and calcium in Listeria monocytogenes vacuoles. Cell Microbiol. 8, 781-792 (2006).
- Zlokarnik, G., et al. Quantitation of transcription and clonal selection of single living cells with beta-lactamase as reporter. Science. 279, 84-88 (1998).
- Charpentier, X., Oswald, E. Identification of the secretion and translocation domain of the enteropathogenic and enterohemorrhagic Escherichia coli effector Cif, using TEM-1 beta-lactamase as a new fluorescence-based reporter. J. Bacteriol. 186, 5486-5495 (2004).
- Mills, E., Baruch, K., Charpentier, X., Kobi, S., Rosenshine, I. Real-time analysis of effector translocation by the type III secretion system of enteropathogenic Escherichia coli. Cell Host Microbe. 3, 104-113 (2008).
- Bish, S. E., Song, W., Stein, D. C. Quantification of bacterial internalization by host cells using a beta-lactamase reporter strain: Neisseria gonorrhoeae invasion into cervical epithelial cells requires bacterial viability. Microbes Infect. 10, 1182-1191 (2008).
- Ray, K., et al. Tracking the dynamic interplay between bacterial and host factors during pathogen-induced vacuole rupture in real time. Cell Microbiol. 12, 545-556 (2010).
- Blocker, A., et al. The tripartite type III secreton of Shigella flexneri inserts IpaB and IpaC into host membranes. J. Cell Biol. 147, 683-693 (1999).
- Mounier, J., et al. The IpaC carboxyterminal effector domain mediates Src-dependent actin polymerization during Shigella invasion of epithelial cells. PLoS Pathog. 5, e1000271(2009).
- Nowicki, B., Hart, A., Coyne, K. E., Lublin, D. M., Nowicki, S. Short consensus repeat-3 domain of recombinant decay-accelerating factor is recognized by Escherichia coli recombinant Dr adhesin in a model of a cell-cell interaction. The Journal of Experimental Medicine. 178, 2115-2121 (1993).
- Nothelfer, K., Dias Rodrigues, C., Bobard, A., Phalipon, A., Enninga, J. Monitoring Shigella flexneri vacuolar escape by flow cytometry. Virulence. 2, 54-57 (2011).
- Simeone, R., et al. Phagosomal rupture by Mycobacterium tuberculosis results in toxicity and host cell death. PLoS Pathog. 8, e1002507(2012).
Reprints and Permissions
