Diffusion tensor imaging (DTI) basically serves as an MRI-based tool to identify in vivo the microstructure of the brain and pathological processes due to neurological disorders within the cerebral white matter. DTI-based analyses allow for application to brain diseases both at the group level and in single subject data.
Method Article
Diffusion Tensor Magnetic Resonance Imaging in the Analysis of Neurodegenerative Diseases
In This Article
Summary
Abstract
Diffusion tensor imaging (DTI) techniques provide information on the microstructural processes of the cerebral white matter (WM) in vivo. The present applications are designed to investigate differences of WM involvement patterns in different brain diseases, especially neurodegenerative disorders, by use of different DTI analyses in comparison with matched controls.
DTI data analysis is performed in a variate fashion, i.e. voxelwise comparison of regional diffusion direction-based metrics such as fractional anisotropy (FA), together with fiber tracking (FT) accompanied by tractwise fractional anisotropy statistics (TFAS) at the group level in order to identify differences in FA along WM structures, aiming at the definition of regional patterns of WM alterations at the group level. Transformation into a stereotaxic standard space is a prerequisite for group studies and requires thorough data processing to preserve directional inter-dependencies. The present applications show optimized technical approaches for this preservation of quantitative and directional information during spatial normalization in data analyses at the group level. On this basis, FT techniques can be applied to group averaged data in order to quantify metrics information as defined by FT. Additionally, application of DTI methods, i.e. differences in FA-maps after stereotaxic alignment, in a longitudinal analysis at an individual subject basis reveal information about the progression of neurological disorders. Further quality improvement of DTI based results can be obtained during preprocessing by application of a controlled elimination of gradient directions with high noise levels.
In summary, DTI is used to define a distinct WM pathoanatomy of different brain diseases by the combination of whole brain-based and tract-based DTI analysis.
Introduction
Diffusion tensor imaging in the human brain
The white matter (WM) tracts in the central nervous system consist of densely packed axons in addition to various types of neuroglia and other small populations of cells. The axonal membrane as well as the well-aligned protein fibers within an axon restricts water diffusion perpendicular to the fiber orientation, leading to anisotropic water diffusion in brain WM 1. Myelin sheaths around the axons may also contribute to the anisotropy for both intra- and extracellular water 2.
The quantitative description of this anisotropy could be detected by diffusion tensor imaging (DTI). DTI produces images of tissues weighted with the local microstructural characteristics of water diffusion. The image-intensities at each position are attenuated, depending on the strength and direction of the so-called magnetic diffusion gradient (represented in the b-value), as well as on the local microstructure in which the water molecules diffuse 3, the diffusion coefficient D, a scalar value:

However, in the presence of anisotropy in WM, diffusion can no longer be characterized by a single scalar coefficient, but requires a tensor  which in first approximation describes molecular mobility along each direction and correlation between these directions 4. Diffusion anisotropy is mainly caused by the orientation of fiber tracts in WM and is influenced by its micro- and macrostructural features. Of the microstructural features, intraaxonal organization appears to be of greatest influence on diffusion anisotropy, besides the density of fiber and cell packing, degree of myelination, and individual fiber diameter. On a macroscopic scale, the variability in the orientation of all WM tracts in an imaging voxel influences its degree of anisotropy 5.
In typical DTI measurements, the voxel dimensions are in the order of millimeters. Thus, a voxel always contains the averaged information of the water molecules inside the detected volume that usually covers several axons as well as the surrounding water molecules. Despite this multidirectional environment, DTI is sensitive to the orientation of the largest principal axis which aligns to the predominant axonal direction, i.e. the axonal contribution dominates the measured signal 2.
DTI provides two types of information about the property of water diffusion: first, the orientation-independent extent of diffusion anisotropy 5 and second, the predominant direction of water diffusion in image voxels, i.e. the diffusion orientation 6.
The current protocols are supposed to provide a framework of DTI analysis techniques for quantitative comparison of subject groups at the group level, as outlined in the following.
Quantification of diffusion properties - analysis parameters
The elements of the symmetric tensor can be measured by diffusion gradients along at least six non-collinear and non-coplanar directions so that b (Equation 1) has become a tensor, resulting in signal attenuation

This equation requires accounting for possible interactions between imaging and diffusion gradients that are applied in orthogonal directions (cross terms) and even between imaging gradients that are applied in orthogonal directions 4.
The second-rank diffusion tensor can always be diagonalized leaving only three non-zero elements along the main diagonal of the tensor, i.e. the Eigenvalues ( ). The Eigenvalues reflect the shape or configuration of the ellipsoid. The mathematical relationship between the principal coordinates of the ellipsoid and the laboratory frame is described by the Eigenvectors

Since there are several challenges in displaying tensor data, the concept of diffusion ellipsoids has been proposed 3. The Eigendiffusivities of these ellipsoids represent the unidimensional diffusion coefficients in the main direction of diffusivities of the medium, i.e. the main axis of the ellipsoid represents the main diffusion direction in the voxel which coincides with the direction of the fibers, while the eccentricity of the ellipsoid provides information about the degree of anisotropy and its symmetry. Therefore, diffusion anisotropy metrics such as the fractional anisotropy (FA) could be defined 7.

 is the arithmetic average of all Eigenvalues.
An additional approach is to use the principal direction of the diffusion tensor to address the WM connectivity of the brain, corresponding to the tractography approach which has the intention to investigate which parts of the brain are connected to each other. Assuming that the orientation of the major component of the diffusion tensor represents the orientation of the dominant axonal tracts, a 3-D vector field is provided in which each vector represents the fiber orientation. Currently, there are several different approaches to reconstruct WM tracts which could be divided into two types: the first category is based on line propagation algorithms using the local tensor information for each step of the fiber tract propagation 2,8,9. The second category is based on global energy minimization to find the energetically most favorable path between two WM regions, resulting in the approach of tract-based spatial statistics (TBSS) 10 which has been used in other algorithms such as tractwise fractional anisotropy statistics (TFAS - see protocol text, section 2.4.).
Transformation into stereotaxic standard space
Like in other advanced MRI methods, DTI- and FT-based studies in a clinical context pursue the ultimate goal to categorize individual patient's brain morphology in order to facilitate the diagnostic process based on some discrimination metric 11. Studies at the group level are most relevant if the common clinical phenotype is supposed to be due to damage to one or more specific brain areas or a specific neuroanatomical network. Here, averaging of results for different subjects is useful in order to assess common patterns of microstructural alterations. Each individual brain has to be transferred into stereotaxic space so that, in a second step, the arithmetic averaging of the results at a voxel-by-voxel level is possible. Spatial normalization allowed for arithmetic averaging of the results obtained from different subjects in order to improve the signal-to-noise ratio (SNR) and to perform a comparison of samples of patients and controls in order to analyze the computational pathoanatomy of a specific disorder, e.g. a neurodegenerative disease which is associated with the affectation of a specific brain system.
The early approach of normalization to a standardized stereotaxic space by 12 suggested a transformation algorithm to a standard atlas involving the identification of various brain landmarks and piecemeal scaling of brain quadrants. Nowadays, most of the advanced MRI data analysis packages use normalization to the Montreal Neurological Institute (MNI) stereotaxic space 13. For this transformation, semiautomatic and automated brain registration algorithms using study specific templates were developed 14,15. In DTI, special attention has to be drawn to preserve the directional information during the normalization process 16,17. The application of spatial transformations to DT-MR images which are required for spatial normalization of collections of data sets is, in contrast to warping scalar images, complicated by the fact that DTs contain orientational information which is again affected by the transformation. This effect must be accounted for in order to ensure the anatomical correctness of the transformed image. Here, techniques for applying affine transformations to DTI data sets are presented.
Application of DTI to brain diseases
The comparison of longitudinal DTI data requires an alignment/registration of one subject's data among each other. In that context, preservation of the directional information is necessary (i.e. rotation of the diffusion tensor during affine transformations). Possible applications to neurodegenerative disorders have been reported previously (e.g. 18,19).
DTI has been established as a robust non-invasive technical tool to investigate in vivo neuropathology of WM neuronal tracts (e.g. 11,20,21,22). DTI-based quantitative metrics of the diffusion process, e.g. the FA, have already been shown to be sensitive markers for studying a wide range of WM pathologies, such as stroke 20, multiple sclerosis 23, amyotrophic lateral sclerosis 24, 25, Alzheimer's disease 26, and several other WM disorders 27,28.
Additionally, DTI with FT can be used to identify WM tracts 23. This technique, while still not in routine clinical use, is emerging as a powerful instrument for the assessment of pathway-specific abnormalities in neurological disease. Within the identified tracts, various quantitative MRI indices derived from DTI and additional acquisitions (e.g. T2-weighted images and/or magnetization transfer (MT) imaging) that are anatomically coregistered to the DTI data could be measured. Hereby, each index could be calculated as a function of position within the tract, referring to plots depicting their spatial variation as tract profiles.
In the following, human DTI scans which were performed on 1.5 Tesla MRI-scanners (Siemens Medical, Erlangen, Germany) were used to investigate the potential of various analysis techniques for detecting white matter abnormalities in patient groups as well as in individuals. After an automated quality check for the elimination of motion-corrupted volumes and volumes with other kinds of artifacts, standardized postprocessing procedures prepare the DTI data for the consecutive analysis. Different analysis approaches will be illustrated in the following, i.e. first, whole brain based spatial statistics (WBSS), second, FT, and third, Tractwise fractional anisotropy statistics (TFAS). WBSS is a method that runs in analogy to voxel-based morphometry (VBM) which is usually known as voxel-based morphometry/statistics on DTI data (VBM/DTI). VBM is a method that originally runs on contrast images where contrast differences in separate scans have to be resolved while WBSS is a method that uses the voxelwise comparison of a physical parameter. Therefore, although algorithmically similar, a terminology which is differentiating WBSS and VBM will be used in the following.
Protocol
Analysis Methods: Pre- and Postprocessing
The task of the following protocol is to analyze diffusion properties voxelwise within white matter tracts which could be - due to the voxelwise detection - either isotropic or anisotropic, resulting in prolate or oblate diffusion tensors for the respective voxels. The parameterization of the voxel tensors is used for either the calculation of FA-maps or the identification of fibertracts (Figure 1).
In order to obtain analysis results as shown in the following, use the software package Tensor Imaging and Fiber Tracking (TIFT) 17. TIFT provides analysis tools for the following requirements:
- analysis in terms of DTI metrics, e.g. FA-maps,
- stereotaxic normalization
- group comparison in terms of FA or other DTI metrics
- various analysis approaches of FT
- FT on group averaged DTI data and the corresponding statistical analysis.
These features allow a variety of analyses in one software environment 17,29,30,31. The TIFT software is constantly under development for new options in DTI data analysis.
Figure 2 gives a schematic overview how to analyze DTI data at the group level after spatial normalization by two complementary approaches, i.e. both by WBSS and by TFAS to finally obtain differences between subject samples at the group level, e.g. diseased brains versus healthy controls. Here, WBSS aims at a voxelwise unbiased detection of areas with differences at the group level, whereas TFAS is based upon pre-defined fibertracts; the TFAS starting areas can either be freely chosen or can be derived from the WBSS results (`hotspots` of significantly altered FA).
Individual longitudinal comparison of FA-maps is performed by detecting differences in FA-maps of measurements at different timepoints after affine stereotaxic alignment (Figure 2).
- Quality check (QC) including correction for corrupted gradient directions
In case of motion disturbances during the acquisition, i.e. in case of corrupted volumes, an SNR increase is obtained by omitting single gradient directions (GD) for tensor calculation. For that purpose, a quality check (QC) algorithm 32 was developed. In brief, for scans that contained corrupted volumes, an SNR increase is achieved by omitting single gradient directions one at a time before tensor estimation: for each GD, the weighted variance is computed from all remaining directions in the sequence by weighting with the angle in which they differed from the index GD.- Perform an artifact correction by detecting GD with at least one slice showing decreased intensity, i.e. motion artifacts caused by spontaneous subject movement (Figure 3, upper panel). For any diffusion weighted volume, compute the mean intensity for each slice and compare its intensity with the same slice in all other volumes by using a weighted average approach - the weighting factor is the dot product of vectors of two GD
 :
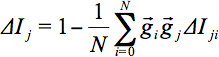
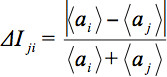
 denotes the arithmetic average intensity of the slice under observation and
 a slice for comparison. The relative average intensity deviation
 is weighted by the dot product of the GD. Thus, in order to define a global parameter:
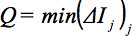
reflects the minimum of slicewise comparisons of all slices. - If Q is under a certain threshold (in the example, a threshold of 0.8 is used for this purpose), eliminate that whole volume, or GD. A threshold of 0.8 is considered a stable solution 32. Figure 3 illustrates motion artifacts visible in sagittal reconstructions and detected by the QC algorithm. In this example, out of the total number of GD (blue dots in Figure 3c), 17 were below the red line which corresponds to Q = 0.8 and should be eliminated. An example of a volume elimination statistics for a whole study is presented in Figure 3d. In this exemplary study, DTI data of 29 presymptomatic HD subjects were compared to DTI data of 30 controls. Further details of this algorithm are presented in 32, 33.
- Perform an artifact correction by detecting GD with at least one slice showing decreased intensity, i.e. motion artifacts caused by spontaneous subject movement (Figure 3, upper panel). For any diffusion weighted volume, compute the mean intensity for each slice and compare its intensity with the same slice in all other volumes by using a weighted average approach - the weighting factor is the dot product of vectors of two GD
- Preprocessing and spatial normalization
- Perform the correction of eddy current-induced geometric distortions of the echo-planar imaging data sets by the method proposed by 34.
- For the stereotaxic normalization, create a study-specific (b = 0) - template and an FA-template as previously described 17,28,31. Basically, a complete non-linear stereotaxic normalization consists of three deformation components. Consequently, the resulting diffusion tensor
 of each voxel i has to be rotated according to all the rotations listed above (Figure 4):
- Figure 4a shows a rigid brain transformation to align the basic coordinate frames. The rotation
 resulting from the aligning to the basic coordinate frame has to be applied

- Figure 4b shows a linear deformation according to landmarks. The components of the Eigenvectors have to be adapted according to the six normalization parameters of S (dependent on the brain region sa,, a=1...6) of the linear deformation.
vw,j'''=savw,j'''
w=1,2,3 and j=x,y,z. - Figure 4c shows a non-linear normalization equalizing non-linear brain shape differences. The 3-D vector shifts are different for each voxel leading to a separate transformation for each voxel of the 3-D voxel array
 ). Standard trigonometry gives a rotation matrix independently for each voxel, resulting from the 3-D vector shifts following the concepts of 16 in order to preserve the directional relations between Eigenvectors of neighbored voxels. Thus, different shifts of two neighbored voxels result in rotations of the corresponding Eigenvectors. Use the dilation matrices for the alignment of the tensor of each voxel to the surrounding voxels.
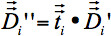
 are the components of
- Figure 4a shows a rigid brain transformation to align the basic coordinate frames. The rotation
- After this individual normalization procedure (step (i) - DTI-data I0), use all individual DTI data sets for creating a study-specific (b = 0) - template and an FA-template (step (ii) - templates T1). As the non-affine registration to an FA-template has the advantage that it provides more contrast in comparison to (b = 0) images 10, define an FA-template by averaging all individually derived FA-maps of the patients and the controls.
- In a second step, following the basic ideas of Ashburner and Friston 35, perform a non-linear MNI normalization (step (iii)) of the DTI data sets by minimizing the mismatch between regional intensities of the FA-map to be fitted and of the FA-template according to the squared differences (X2) - that way, you obtain DTI data I1.
- Based on these data, new templates T2 are derived (step (iv)). Repeat this iterative process until the correlation between individual FA-maps and the FA-template is > 0.7. Usually this is reached after two iterations.
- Whole brain-based spatial statistics
The following steps 1.3.1 up to 1.3.5 are visualized schematically in Figure 5b.- Calculate FA-maps from normalized DTI data with respect to normalization procedure of 1.2. in order to preserve directional information (step (i)).
- As a preprocessing step before voxelwise statistical comparison, apply a smoothing filter (step (ii)) to the individual normalized FA-maps. For smoothing, the fact that the filter size influences the results of DTI data analysis 36 requires application of the matched filter theorem which states that the width of the filter used to process the data should be tailored to the size of the expected difference, as detailed in previous applications to DTI data of patients with neurodegenerative disorders (e.g. 28).
- Perform statistical comparison between the patient groups and the corresponding control group voxelwise by Student´s t-test, i.e. compare FA values of the patients' FA-maps with the FA values of the controls' FA-maps, for each voxel separately (step (iii)). FA values below 0.2 are not considered for calculation since cortical grey matter shows FA values up to 0.2 37.
- Statistical results have to be corrected for multiple comparisons using the false-discovery-rate (FDR) algorithm at p < 0.05 38 (step (iv)). Further reduction of the alpha error has to be performed by a spatial correlation algorithm (clustering - step (v)) that eliminated isolated voxels or small isolated groups of voxels in the size range of the smoothing kernel, leading to a threshold cluster size of 512 voxels.
- To display the results on a morphological background (step (v)), normalize the 3-D T1 weighted data sets to MNI space and average arithmetically. Perform this normalization procedure by use of a study-specific template in analogy to the normalization applied to the DTI data sets 17.
Figure 6 shows results of the whole brain-based spatial statistics (WBSS) of ALS patients vs. controls. Figure 6a shows the local maximum of decreased FA values in a sagittal, coronar and axial view (thresholded at p < 0.01, corrected for multiple comparisons). Figure 6b shows projectional FT with starting points in the corticospinal tract used as basis for TFAS. Figure 6c shows group differences in FA-maps detected by whole brain based spatial statistics (WBSS) between a sample of ALS patients and matched controls in a slicewise visualization.
- Tractography and tractwise fractional anisotropy statistics (TFAS)
Figure 7 illustrates the process of group-based FT including TFAS as described in 1.4.1 up to 1.4.4.- In order to apply group-based FT algorithms, generate averaged DTI data sets from the patients' data and from the controls' data together according to the methods previously described 17. This averaging requires careful treatment of the orientational information which is preserved during the normalization process according to techniques described by 16 - for details see 30.
- Perform tractography in averaged DTI data sets of subject groups by application of a streamline tracking technique 31. Identify manually defined seed points adjacent to the local maxima by the whole brain-based FA analyses which are the basis for the consecutive FT analysis. After identification of the seeds, perform tractography and define the voxels of the delineated fibers as a group-specific mask for the following TFAS 30.
- In order to quantify the tractography results, apply the technique of TFAS by using the fiber tracts that were created on the averaged DTI data sets of all subjects of each group (patient data and control data together) for the selection of the voxels that contribute to a comparison between the patients' and the controls' FA-maps.
- Consider all resulting voxels with an FA value above 0.2 for statistical analysis by Student's t-test.
- If desired, the TFAS technique could be applied to any derived DTI metrics, such as mean diffusivity (MD), radial anisotropy, axial anisotropy, etc. (for an example, see 28).
- The results are displayed on a morphological background consisting of the MNI-normalized 3-D T1-weighted data sets.
Results
1. QC and correction for corrupted gradient directions in application to data of patients with hyperkinetic disorders
As an example for the effect of the application of QC and subsequent volume exclusion (as a consequence from the correction for corrupted GD), Figure 8 shows differences in whole brain based spatial statistics with and without volume exclusion for group comparison of 29 premanifest Huntington's disease subjects vs. 30 age and gender matched controls. The scanning protocol was performed on a 1.5 Tesla Magnetom Symphony (Siemens Medical, Erlangen, Germany). The DTI study protocol was identical for patients and controls and consisted of 72 volumes (40 slices, 96 x 96 pixels, slice thickness 2.3 mm, pixel size 2.3 x 2.3 mm), representing 64 gradient directions (b = 1,000 sec/mm2) and 8 scans with minimal diffusion weighting (b = 100 sec/mm2). The echo time (TE) and repetition time (TR) were 90 msec and 8,000 msec, respectively.
2. DTI in xeroderma pigmentosum
Xeroderma pigmentosum (XP) is a rare autosomal recessive progeroid syndrome where the underlying DNA repair defect plays a central role in the aging process 39,40. A multiparametric MRI approach to characterize the cerebromorphological phenotype was used in seven XP patients of different subtypes in order to assess the macrostructural and microstructural cerebral morphology in comparison to controls 41, including DTI, volumetric measurements, and MR spectroscopy (1H MRS).
The MRI protocol was acquired on a 1.5 Tesla MR system (Magnetom Symphony, Siemens, Erlangen, Germany), equipped with a standard headcoil. T1 weighted (T1w) scans consisted of 196 slices with a slice thickness of 1.0 mm (256 x 256 pixels, pixel size 1.0 x 1.0 mm). TE and TR were 12 msec and 456 msec, respectively. The DTI study protocol consisted of 13 volumes (45 slices, 128 x 128 pixels, slice thickness 2.2 mm, pixel size 1.5 x 1.5 mm), representing 12 gradient directions and one scan with gradient 0 (b = 0). TE and TR were 93 msec and 8,000 msec, respectively; b was 800 sec/mm2 and five scans were averaged online by the scanner software in image space.
Due to the clinical and demographic heterogeneity of the XP-subjects, the comparison was not performed at the group level but rather in a pairwise manner, i.e. each XP-subject was analyzed in comparison to an age- and gender matched control. FA-map comparison was performed for ROIs located in the thalamus, in the upper corticospinal tract, in the internal capsule, and in the corpus callosum. Furthermore, directionality changes were compared pairwise for FT and consecutive TFAS, with starting points in the thalamus. DTI demonstrated significantly reduced WM directionality in all regions investigated, i.e. the thalamus, the corticospinal tracts and the dorsal corpus callosum, with volume and directionality reductions of the fiber projections involving both the craniocaudal fibers and the interhemispheric connections (Figure 9). These findings, although heterogeneous among the study sample, could be correlated with the clinico-neurological symptoms. The imaging findings support the position that myelin structures degrade prematurely in the brain of XP patients, as discussed in 41.
DTI in neurodegeneration (motor neuron diseases)
Morphological changes in amyotrophic lateral sclerosis (ALS) patients by structural MRI analysis 42,43 as well as sensorimotor functional connectivity changes in ALS patients 21 have been reported recently. In this work, as an example for application of the analysis methods WBSS and TFAS, twenty ALS patients were investigated by multiparametric MRI. Severity of physical symptoms as measured with the revised ALS functional rating scale (ALS-FRS-R) was in the range of mild to moderate (35.9 ± 8.0), and none of the patients showed neuropsychological signs of frontotemporal dementia. As control group twenty age- and gender matched healthy controls were scanned.
The scanning protocol was performed on a 1.5 Tesla Magnetom Symphony (Siemens Medical, Erlangen, Germany). The DTI study protocol was identical for patients and controls and consisted of 13 volumes (45 slices, 128 x 128 pixels, slice thickness 2.2 mm, pixel size 1.5 x 1.5 mm), representing 12 gradient directions and one scan with gradient 0 (b = 0). TE and TR were 93 msec and 8,000 msec, respectively; b was 800 sec/mm2and five scans were averaged online by the scanner software in image space.
The results for the ALS group showed extensive FA reductions along large parts of the CST and the CC, in the latter including the segment III according to the Hofer and Frahm scheme 44 but reaching beyond to ventral and dorsal CC areas (Figure 6).The results for the ALS group showed extensive FA reductions along large parts of the CST and the CC, in the latter including the segment III according to the Hofer and Frahm scheme 44 but reaching beyond to ventral and dorsal CC areas (Figure 6).
A further example was the investigation of WM involvement patterns in other motor neuron diseases (MND), i.e. ALS, primary lateral sclerosis (PLS), and hereditary spastic paraparesis (HSP) subdivided into pure (pHSP) and complicated (cHSP), by use of a two-fold approach of DTI analysis: WBSS on FA-maps was complemented by FT results and subsequent TFAS. DTI-based comparisons of ALS and PLS samples have been described by other authors as well 45. The PLS group analysis showed a similar pattern of decreased FA along the CST anatomy while the CC involvement was marked but less extensive than in ALS and more restricted to segment III. The analysis in the pHSP sample demonstrated FA reductions in the CST which included more circumscribed areas within this structure whereas the CC alterations were, similar to the pattern observed in the ALS group, extended over large parts of the dorsal CC including the motor segment. Finally, the cHSP group showed the largest areas of decreased FA which accumulated to one large connected cluster including the complete CST structure and large dorsal and also ventral parts of the CC. In summary, the controlled DTI analysis in a total of 72 patients with different MND showed characteristic lesion patterns correlated with the involvement of distinct brain areas within the pathological processes of the different disease entities. For a detailed description and discussion, please refer to 22,28,46
3. DTI for longitudinal comparisons
As an example for application of DTI in longitudinal comparison, a 46-year-old patient with biopsy-proven anaplastic oligoastrocytoma WHO III° was scanned. After complete surgery, the patient received combined radio-/chemotherapy and 6 cycles of adjuvant chemotherapy.
DTI was acquired at 4 timepoints, i.e. before combined radio-/chemotherapy and 2, 5, and 9 months after radio-/chemotherapy in order to depict the status of the regional and global WM integrity in a longitudinal design.
The scanning protocol was performed on a 1.5 Tesla Magnetom Symphony (Siemens Medical, Erlangen, Germany). The DTI study protocol consisted of 52 volumes (64 slices, 128 x 128 pixels, slice thickness 2.8 mm, pixel size 2.0 x 2.0 mm), representing 48 gradient directions and four scans with gradient 0 (b = 0). TE and TR were 95 msec and 8,000 msec, respectively; b was 1,000 sec/mm2.
Figure 10 exemplarily displays differences in the FA-maps between the DTI scan after radio-/chemotherapy and DTI scan 7 months later, i.e. scans of timepoints 2 and 4. WBSS is performed according to section 1.3. with an FA threshold of 0.15, FDR corrected.

Figure 1. In DTI, a voxel represents the diffusion properties of several bundles of axons to calculate a diffusion tensor, illustrated as ellipsoid. For each voxel, the tensor information could be parameterized in fractional anisotropy (FA) maps or used for fiber tracking (FT).
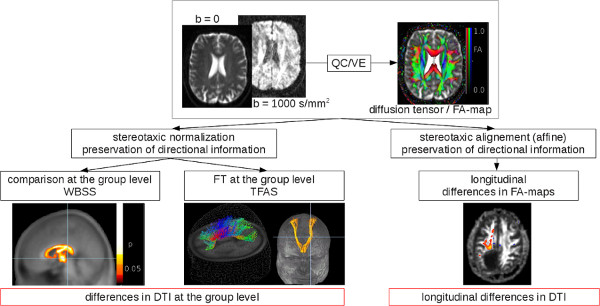
Figure 2. Upper panel: After a quality check (QC) and the corresponding volume elimination (VE), DTI metrics, e.g. FA-maps could be calculated. In the next step, either stereotaxic normalization (left) allows for comparison at the group level (whole brain based spatial statistics - WBSS and/or tractwise fractional anisotropy statistics - TFAS) or stereotaxic alignment (right) allows for comparison of longitudinal FA-maps. These analyses either lead to differences at the group level (left) or detect longitudinal differences within single subject DTI data (right). Click here to view larger figure.
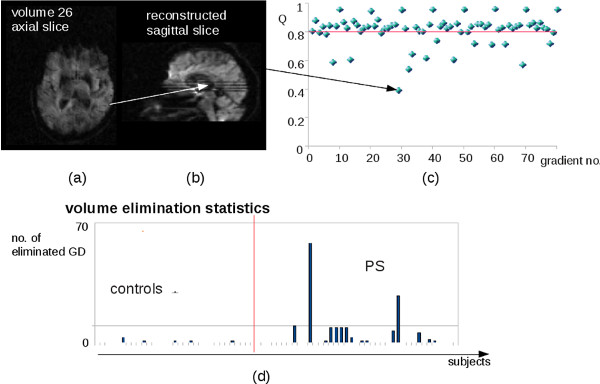
Figure 3. (a) Representative motion corrupted axial slice with reduced intensity which was detected by the QC algorithm. (b) The respective localization in the reconstructed sagittal volume, indicated by a white arrow. The motion corruption is also visually indicated by a relative intensity loss compared to adjacent axial slices. (c) By application of a threshold of 0.8 (red line) in total 17 gradient directions were detected for volume elimination. The black arrow indicates the volume of (a) and (b). (d) Volume elimination statistics (number of eliminated gradient directions - GD) for 29 presymptomatic Huntington's disease subjects (PS) and 30 controls.
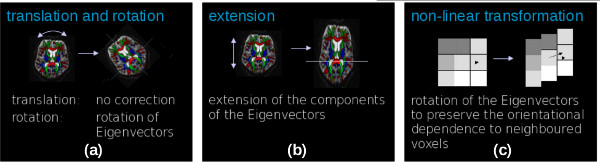
Figure 4. Preservation of directional information during stereotaxic normalization. (a) rigid brain transformation by translation and rotation to align the basic coordinate frames. (b) linear deformation according to landmarks. The components of the Eigenvectors had to be adapted according to the linear deformation. (c) non-linear normalization equalizing non-linear brain shape differences. The 3-D vector shifts were different for each voxel leading to a separate transformation for each voxel of the 3-D voxel array in order to preserve the directional relations between Eigenvectors of neighbored voxels.
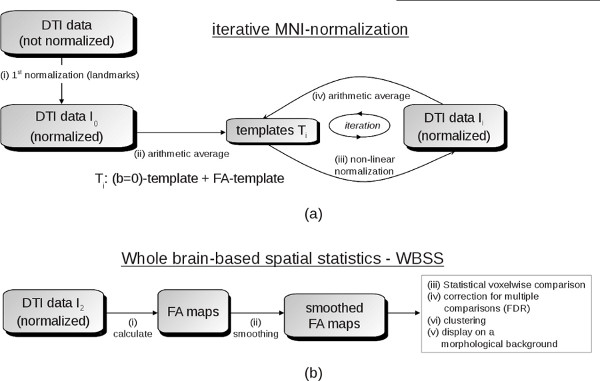
Figure 5. (a) Schematic example for an iterative template-specific MNI-normalization: after a 1st normalization step based on landmarks, by arithmetic averaging of DTI-data I0, first templates T1 ((b = 0) template and FA-template) were obtained. Subsequently, in an iterative procedure, normalized DTI-data I1 were obtained by non-linear normalization to the previously defined templates (T1). From these newly normalized DTI-data I1, new templates (T2) were derived which again could be used for normalization. This iterative process is stopped when a predefined coincidence (measure by correlation) between DTI-data and templates was reached. (b) Scheme for data pre-processing prior to whole brain-based spatial statistics (WBSS): FA-maps are calculated from normalized DTI data and a smoothing filter to the individual normalized FA-maps is applied. In a consecutive step, voxelwise statistical comparison between the patient groups and the corresponding control group is performed. After correction for multiple comparisons using the false-discovery-rate (FDR) algorithm and a clustering procedure for further reduction of the alpha error, results are displayed on a morphological background. Click here to view larger figure.

Figure 6. Results of the whole brain-based spatial statistics (WBSS) of ALS patients vs. controls. (a) Local maximum of decreased FA values in a sagittal, coronar and axial view (thresholded at p<0.01, corrected for multiple comparisons). (b) FT with starting points in the corticospinal tract used as basis for TFAS. (c) (animation 1): Group differences in FA-maps detected by whole brain based spatial statistics (WBSS) between a sample of ALS patients and matched controls in slicewise visualization. Click here to view larger figure.
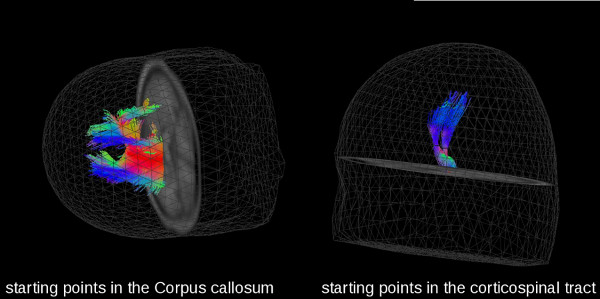
Figure 7. (animation 2): Fiber tracking (FT) on group averaged data (controls) with starting points in the corpus callosum (left) and in the corticospinal tract (right). Click here to view larger figure.
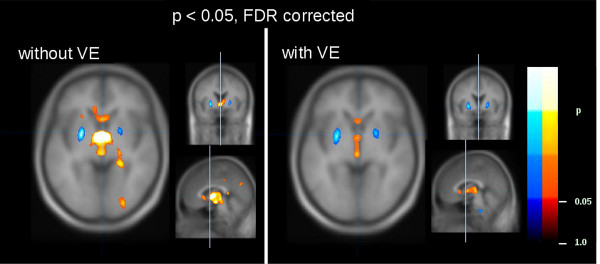
Figure 8. Whole brain based spatial statistics before artifact correction (volume elimination - VE) (left) and after artifact correction (right), each corrected at p < 0.05, false discovery rate (FDR)). FA increase in cold colors, FA decrease in hot colors.
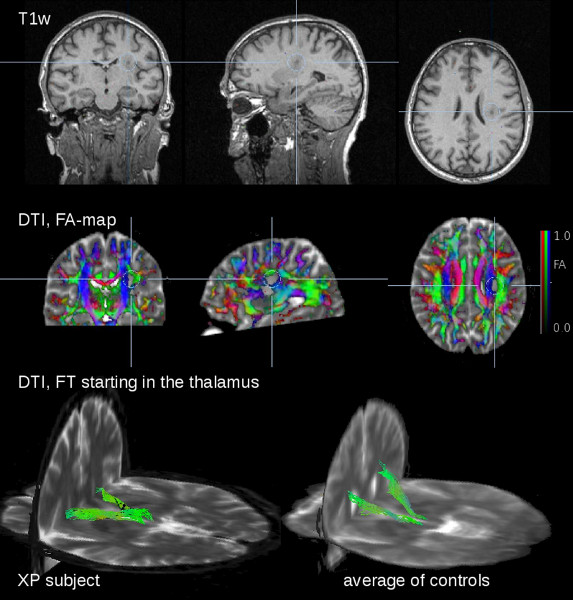
Figure 9. Multiparametric MRI for a subject with xeroderma pigmentosum (XP). Upper row: T1-weighted conventional MRI post contrast in coronar, sagittal, and axial view. Focus on a left-hemispheric contrast-enhanced lesion with perifocal edema within the frontoparietal white matter. Middle row: FA maps (display threshold 0.2) with the identical focus. Lower row: FT results with seed points in the thalamus - left: XP subject, right: average FT from 7 controls.
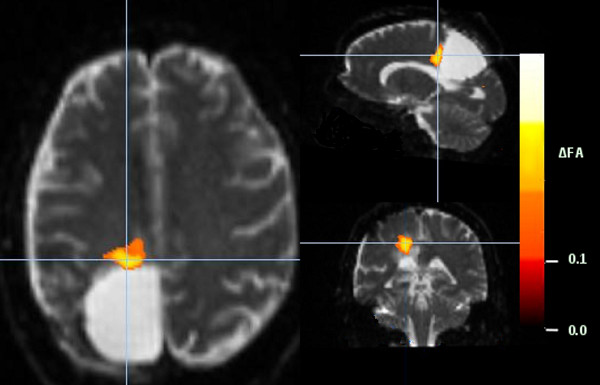
Figure 10. Patient with biopsy-proven anaplastic oligoastrocytoma WHO III° and complete surgery and combined radio-/chemotherapy and adjuvant chemotherapy. Longitudinal differences in FA-maps between two subsequent scans with a time interval of 7 months (FA difference 0.15, FDR corrected).
Discussion
Inter-subject averaging of DTI data can be achieved with respect to diffusion amplitude (by use of FA information) and diffusion direction (based upon FT), respectively. Averaging of FA maps allows for the statistical comparison of subject groups by WBSS and TFAS. This methodological framework gives an introduction to DTI techniques with inter-subject averaging and group comparison. Stereotaxic normalization and comparison of FA maps at the group level allows for several possibilities to quantify differences between subject groups. WBSS and TFAS seems to be a probate way to measure differences at group level in groups of subjects with a groupwise similar pattern of brain alterations, e.g. neurodegenerative diseases. For disorders with heterogeneous clinical phenotypes, an analysis approach at the group level might not be used, but rather an analysis in a pairwise manner might be appropriate, as demonstrated e.g. in the study in the XP patients. This DTI-based brain mapping at single case level is also important in another clinical context, i.e. the combination of different non-invasive neuroimaging tools and their co-integration into frameless stereotaxy/neuronavigational systems after registration as an important and valuable element of preneurosurgical diagnostics. Various technical approaches such as fMRI techniques, DTI, MRS, positron emission tomography (PET), single photon emission computed tomography (SPECT), and magnetoencephalography (MEG) with options of useful combinations are in clinical use (e.g. 47,48,49).
Generally, DTI-based techniques are limited in that they are only able to analyze the directionality in white matter with an MRI-specific resolution in the order of millimeters. FT reconstructions enable to visualize the most probable axonal fiber directionality, not the axonal structures themselves. Thus, it will not be possible by DTI to image axons directly. Specific limitations of the DTI data acquisition and consecutive analysis as described here are first the spatial resolution which can be achieved within a certain predefined scanning time. However, this acquisition is limited by what the subjects with decreased physical capacities due to age and diseased conditions might stand. Restricted voxel size leads to difficulties to resolve regions with crossing fibers. Second, most studies presented here were performed with 12 diffusion weighted gradient directions - such a DTI scanning protocol allows for FA-mapping with sufficient quality. FT with 12 gradient directions reveals proper results in big axon fiber structures; however, as a third limitation, problems could occur in regions of crossing fibers and in regions where no distinct fiber structures can be separated in the given spatial resolution. Suggestions to resolve crossing fibers were first the "fast-marching" algorithm 50 which in principle remembers the history of the tract and marches with big steps through the crossing fiber region, and second the so-called "q-ball" imaging 51 which by acquisition of a large number of gradient directions (>100) allows to detect more than one direction in a single voxel. A different approach to obtain detailed information about multidirectional fiber architecture is the high angular resolution diffusion-weighted imaging (HARDI) where additional directional acquisition schemes (e.g. 129 diffusion encoding gradient directions) deliver more information on areas with fiber crossings than standard DTI 52. Several options for FT were implemented in TIFT: Streamline tracking 2,3, Tensor Deflection 53, Fast Marching-algorithm 50, and modifications of those techniques 31. The choice of the FT algorithm does not affect the analysis strategy, i.e. each of the implemented FT algorithms could be used during the analysis process at the group level. Since there exists no general optimized FT technique the choice of the FT technique is depending on the specific question addressed by the study. Novel developments of FT algorithms (e.g. 54) could help to further improve the results, especially in resolving crossing fiber structures. A completely different approach would be the use of TBSS 10 (see Introduction).
The processing pipeline reported in this study was primarily developed for clinical studies when the clinical routine MRI protocol is required to be rather short, i.e. voxel resolutions in the order of 2 mm and a limited number of signal accumulations (SA) and gradient directions (GD), i.e. SA x GD in the order of 50 to 80 are used. For studies focusing on high resolution DTI scans (voxel resolutions including slice thickness <1.5 mm and high resolution tensor scanning including GD > 50 with a certain number of signal accumulations (SA > 2), i.e. SA x GD > 100, an alternative for accurate spatial normalization is the use of high dimensional warping algorithms on separate anatomical data sets 55. Furthermore, the postprocessing reported in this study is based on the use of a study-specific template which intrinsically requires the need of an iterative normalization process. An alternative could be the non-iterative normalization to a stereotaxically standardized DTI template with the drawback that the improved accuracy of stereotaxic normalization to a study specific template would not be taken advantage of. One limitation of running FT on spatially normalized data sets is that tracking could be limited by the normalization process, i.e. linear and non-linear normalization steps could lead to slight inaccuracies of tensor directionality. On the other hand, algorithms like global tracking 54 that work on e.g. high angular resolution diffusion imaging data 56 require more information than that available in diffusion tensors. TFAS is an algorithm that is running on averaged DTI data sets so that, for a clinical study setup, it provides good results in basic FT structures that for instance are prone to be affected by neurodegeneration. If FT should be performed on very subtle axonal structures, requiring a high-resolution acquisition protocol as described above, an alternative could be to run FT on native data and then perform a spatial normalization of the resulting FT structures.
Additionally, the most critical step in the analysis procedure is an accurate co-registration of the DTI data to each other. Poor co-registration might lead to false positive or false negative results. In order to improve co-registration quality, the iterative character of the normalization process by use of study-specific templates is a key step in data processing. Additionally, smoothing of the resulting data sets helps to improve data quality by reduction of residual spatial inaccuracies. Another iterative approach to obtain parameters for spatial normalization has been recently published by Mohammadi and coworkers 57 and made available as a toolbox for SPM. Their algorithm has been primarily developed to compute normalization parameters for a symmetric template.
In the sense of a troubleshooting process, the concept of the TIFT software allows to control results after each pre- and postprocessing step. That way, individual data/results screening (also of single data sets) on consistency and plausibility is becoming feasible in order to finally allow for interactions at any step of the analysis cascade.
Taken together, these studies support the notion that FA is a sensitive marker of cerebral WM pathology (see also 58). Given that biomarker-focused approach is now a priority in many neurological and especially neurodegenerative diseases, the current studies strengthen the role of DTI as an additional tool for defining the brain pathoanatomy by microstructural in vivo fingerprint characteristics. DTI analyses at a group level seem to be useful for the identification and quantification of pathoanatomical features in terms of noninvasive markers. Further results can be provided by combined analysis of advanced MRI-based techniques of the computational neuroanatomy, i.e. the combination of DTI with e.g. intensity-based analysis of 3-D T1-weighted MRI (e.g. 59), or resting state functional magnetic resonance imaging (e.g. 60) as well as with the correlation of other clinically derived quantitative parameters.
In the complementary or multiparametric approach, DTI is combined with other MRI modalities, such as T2- or T1-weighted imaging, MT or Magnetic Resonance Spectroscopy (MRS) in order to obtain comprehensive and complementary information 29. As examples, 61 and 23 correlated DTI-FA results with T2 relaxation time in multiple sclerosis, and 62 performed tissue characterization by the combination of DTI and T1-weighted imaging. The multiparametric approach, as shown in the study in the XP patients at single-subject level, allows for complementary and comprehensive analysis of affectation of brain structures by brain diseases. The possibilities of DTI for monitoring disease progression at individual level in longitudinal observations have been shown, but more longitudinal studies are necessary in the future to make use of this potential.
Disclosures
Authors have nothing to disclose.
Acknowledgements
Parts of this work, i.e. the study on QC and correction for corrupted gradient directions in application to data of patients with hyperkinetic disorders, were supported by the European HD network (EHDN project 070). The MRI scans in this certain study were acquired as part of the London site TRACK-HD cohort.
Materials
| Name | Company | Catalog Number | Comments |
|---|---|---|---|
| MR scanner | Siemens 1.5 T Magnetom Symphony | ||
| analysis software | TIFT - Tensor Imaging and Fiber Tracking |
References
- Moseley, M. E., Cohen, Y., et al. Diffusion-weighted MR imaging of anisotropic water diffusion in cat central nervous system. Radiology. 176, 439-445 (1990).
- Mori, S., van Zijl, P. C. M. Fiber tracking: principles and strategies - a technical review. NMR Biomed. 15, 468-480 (2002).
- Basser, P. J., Mattiello, J., LeBihan, D. MR Diffusion Tensor Spectroscopy and Imaging. Biophys J. 66, 259-267 (1994).
- Mattiello, J., Basser, J. P., Le Bihan, D. Analytical expression for the b-matrix in NMR diffusion imaging and spectroscopy. J. Magn. Reson. A. 108, 131-141 (1994).
- Pierpaoli, C., Basser, P. J. Toward a quantitative assessment of diffusion anisotropy. Magn. Reson. Med. 36, 893-906 (1996).
- Pajevic, S., Pierpaoli, C. Color schemes to represent the orientation of anisotropic tissues from diffusion tensor data: application to white matter fiber tract mapping in the human brain. Magn. Reson. Med. 42, 526-540 (1999).
- Le Bihan, D., Mangin, J. F., et al. Diffusion tensor imaging: concepts and applications. J. Magn. Reson. Imaging. 13, 534-546 (2001).
- Conturo, T. E., Lori, N. F., et al. Tracking neuronal fibre pathways in the living human brain. Proc. Natl. Acad. Sci. U.S.A. 96, 10422-10427 (1999).
- Lori, N. F., Akbudak, E. Diffusion tensor fibre tracking of human brain connectivity: aquisition methods, reliability analysis and biological results. NMR Biomed. 15, 494-515 (2002).
- Smith, S. M., Jenkinson, M., et al. Tract-based spatial statistics: voxelwise analysis of multi-subject diffusion data. Neuroimage. 31, 1487-1505 (2006).
- Agosta, F., Pagani, E., et al. Assessment of white matter tract damage in patients with amyotrophic lateral sclerosis: a diffusion tensor MR imaging tractography study. AJNR. Am. J. Neuroradiol. 31, 1457-1461 (2010).
- Talairach, J., Tournoux, P. Coplanar stereotaxic atlas of the human brain. , Thieme Medical. New York. (1988).
- Brett, M., Johnsrude, I. S., Owen, A. M. The problem of functional localization in the human brain. Nat. Rev. Neurosci. 3, 243-249 (2002).
- Collins, D. L., Neelin, P., Peters, T. M., Evans, A. C. Automatic 3-D intersubject registration of MR volumetric data in standardized Talairach space. J. Comput. Assist. Tomogr. 18, 192-205 (1994).
- Friston, K. J., Ashburner, J., Frith, C. D., Poline, J. -B., Heather, J. D., Frackowiak, R. S. J. Spatial registration and normalization of images. Human Brain Mapp. 2, 165-189 (1995).
- Alexander, D. C., Pierpaoli, C., Basser, P. J., Gee, J. C. Spatial transformations of diffusion tensor magnetic resonance images. IEEE Trans. Med. Imaging. 20, 1131-1139 (2001).
- Müller, H. -P., Unrath, A., Ludolph, A. C., Kassubek, J. Preservation of Diffusion Tensor Properties during Spatial Normalization by use of Tensor imaging and Fiber Tracking on a Normal Brain Database. Phys. Med. Biol. 52, N99-N109 (2007).
- Likitjaroen, Y., Meindl, T., et al. Longitudinal changes of fractional anisotropy in Alzheimer's disease patients treated with galantamine: a 12-month randomized, placebo-controlled, double-blinded study. Eur. Arch. Psychiatry Clin. Neurosci. 262, 341-350 (2012).
- Zhang, Y., Schuff, N. Progression of white matter degeneration in amyotrophic lateral sclerosis: A diffusion tensor imaging study. Amyotroph. Lateral Scler. 12, 421-429 (2011).
- Pierpaoli, C., Barnett, A. Water diffusion changes in Wallerian degeneration and their dependence on white matter architecture. Neuroimage. 13, 1174-1185 (2001).
- Agosta, F., Valsasina, P., et al. Sensorimotor functional connectivity changes in amyotrophic lateral sclerosis. Cereb Cortex. 21, 2291-2298 (2011).
- Müller, H. -P., Unrath, A., Huppertz, H. J., Ludolph, A. C., Kassubek, J. Neuroanatomical patterns of cerebral white matter involvement in different motor neuron diseases as studied by diffusion tensor imaging analysis. Amyotroph Lateral Scler. 13, 254-264 (2012).
- Reich, D. S., Zackowski, K. M. Corticospinal tract abnormalities are associated with weakness in multiple sclerosis. Am. J. Neuroradiol. 29, 333-339 (2008).
- Abe, O., Yamada, H. Amyotrophic lateral sclerosis: Diffusion tensor tractography and voxel-based analysis. NMR Biomed. 17, 411-416 (2004).
- Sage, C. A., Peeters, R. R., Gorner, A., Robberecht, W., Sunaert, S. Quantitative diffusion tensor imaging in amyotrophic lateral sclerosis. Neuroimage. 34, 486-499 (2007).
- Preti, M. G., Baglio, F., et al. Assessing corpus callosum changes in Alzheimer's disease: comparison between tract-based spatial statistics and atlas-based tractography. PLoS One. 7, e35856(2012).
- Borroni, B., Brambati, S. M., et al. Evidence of white matter changes on diffusion tensor imaging in frontotemporal dementia. Arch. Neurol. 64, 246-251 (2007).
- Unrath, A., Müller, H. -P., Riecker, A., Ludolph, A. C., Sperfeld, A. D., Kassubek, J. Whole brain-based analysis of regional white matter tract alterations in rare motor neuron diseases by diffusion tensor imaging. Hum Brain Mapp. 31, 1727-1740 (2010).
- Müller, H. -P., Lulé, D., Unrath, A., Ludolph, A. C., Riecker, A., Kassubek, J. Complementary Image Analysis of Diffusion Tensor Imaging and 3-Dimensional T1-Weighted Imaging: White Matter Analysis in Amyotrophic Lateral Sclerosis. J. Neuroimaging. 21, 24-33 (2011).
- Müller, H. -P., Unrath, A., Sperfeld, A. D., Ludolph, A. C., Riecker, A., Kassubek, J. Diffusion tensor imaging and tractwise fractional anisotropy statistics: quantitative analysis in white matter pathology. Biomed. Eng. Online. 6, 42(2007).
- Müller, H. -P., Unrath, A., Riecker, A., Pinkhardt, E. H., Ludolph, A. C., Kassubek, J. Inter-subject variability in the analysis of diffusion tensor imaging at the group level: fractional anisotropy mapping and fiber tracking techniques. Magn. Reson. Imaging. 27, 324-334 (2009).
- Müller, H. -P., Glauche, V., et al. Stability of white matter changes related to Huntington's disease in the presence of imaging noise: a DTI study. PLoS Curr. 3, RRN1232(2011).
- Müller, H. -P., Süßmuth, S. D., Landwehrmeyer, G. B., Ludolph, A. C., Tabrizi, S. J., Klöppel, S., Kassubek, J. Stability effects on results of diffusion tensor imaging analysis by reduction of the number of gradient directions due to motion artifacts: an application to presymptomatic Huntington's disease. PLoS Curr. 3, RRN1292(2011).
- Shen, Y., Larkman, D. J., Counsell, S., Pu, I. M., Edwards, D., Hajnal, J. V. Correction of High-Order Eddy Current Induced Geometric Distortion in Diffusion-Weighted Echo-Planar images. Magn. Reson. Med. 52, 1184-1189 (2004).
- Ashburner, J., Friston, K. J. Nonlinear Spatial Normalization Using Basis Functions. Human Brain Mapping. 7, 254-266 (1999).
- Jones, D. K., Symms, M. R., Cercignani, M., Howard, R. J. The effect of filter size on VBM analyses of DT-MRI data. Neuroimage. 26, 546-554 (2005).
- Kunimatsu, A., Aoki, S., et al. The optimal trackability threshold of fractional anisotropy for diffusion tensor tractography of the corticospinal tract. Magn. Reson. Med. Sci. 3, 11-17 (2004).
- Genovese, C. R., Lazar, N. A., Nichols, T. Thresholding of statistical maps in functional neuroimaging using the false discovery rate. Neuroimage. 15, 870-878 (2002).
- Cleaver, J. E. Defective repair replication of DNA in xeroderma pigmentosum. Nature. 218, 652-656 (1968).
- Anttinen, A., Koulu, L., et al. Neurological symptoms and natural course of xeroderma pigmentosum. Brain. 131, 1979-1989 (2008).
- Kassubek, J., Sperfeld, A. D. The cerebro-morphological fingerprint of a progeroid syndrome: white matter changes correlate with neurological symptoms in xeroderma pigmentosum. PLoS One. 7, e30926(2012).
- Canu, E., Agosta, F. The topography of brain microstructural damage in amyotrophic lateral sclerosis assessed using diffusion tensor MR imaging. AJNR. Am. J. Neuroradiol. 32, 1307-1314 (2011).
- Verstraete, E., Veldink, J. H., Hendrikse, J., Schelhaas, H. J., van den Heuvel, M. P., van den Berg, L. H. Structural MRI reveals cortical thinning in amyotrophic lateral sclerosis. J. Neurol. Neurosurg. Psychiatry. 83, 383-388 (2012).
- Hofer, S., Frahm, J. Topography of the human corpus callosum revisited- comprehensive fiber tractography using diffusion tensor magnetic resonance imaging. Neuroimage. 32, 989-994 (2006).
- Iwata, N. K., Kwan, J. Y., et al. White matter alterations differ in primary lateral sclerosis and amyotrophic lateral sclerosis. Brain. 134, 2642-2655 (2011).
- Kassubek, J., Ludolph, A. C., Müller, H. -P. Neuroimaging of motor neuron diseases. Ther. Adv. Neurol. Disord. 5, 119-127 (2012).
- Kassubek, J., Juengling, F. D. Multimodality functional neuroimaging. In: C. Stippich (Ed.): Clinical functional MRI - Presurgical functional neuroimaging. , Springer. Berlin/Heidelberg/New York. (2007).
- Stadlbauer, A., Buchfelder, M., Salomonowitz, E., Ganslandt, O. Fiber density mapping of gliomas: histopathologic evaluation of a diffusion-tensor imaging data processing method. Radiology. , 257-846 (2010).
- Stadlbauer, A., Hammen, T., et al. Differences in metabolism of fiber tract alterations in gliomas: a combined fiber density mapping and magnetic resonance spectroscopic imaging study. Neurosurgery. 71, 454-463 (2012).
- Staempfli, P., Jaermann, T., Crelier, G. R., Kollias, S., Valavanis, A., Boesiger, P. Resolving fiber crossing using advanced fast marching tractography based on diffusion tensor imaging. Neuroimage. 30, 110-120 (2006).
- Ehricke, H. H., Otto, K. M., Klose, U. Regularization of bending and crossing white matter fibers in MRI Q-ball fields Magn. Reson Imaging. 29, 916-926 (2011).
- Hirsch, J. G., Schwenk, S. M., Rossmanith, C., Hennerici, M. G., Gass, A. Deviations from the diffusion tensor model as revealed by contour plot visualization using high angular resolution diffusion-weighted imaging (HARDI). MAGMA. 16, 93-102 (2003).
- Lazar, M., Weinstein, D. M., et al. White matter tractography using diffusion tensor deflection. Human Brain Mapping. 18, 306-321 (2003).
- Reisert, M., Mader, I., Anastasopoulos, C., Weigel, M., Schnell, S., Kiselev, V. Global fiber reconstruction becomes practical. Neuroimage. 54, 955-962 (2011).
- Klein, A., Andersson, J. Evaluation of 14 nonlinear deformation algorithms applied to human brain MRI registration. Neuroimage. 46, 786-802 (2009).
- Bammer, R. Basic principles of diffusion-weighted imaging. Eur. J. Radiol. 45, 169-184 (2003).
- Mohammadi, S., Keller, S. S. The influence of spatial registration on detection of cerebral asymmetries using voxel-based statistics of fractional anisotropy images and TBSS. PLoS One. 7, e36851(2012).
- Turner, M. R., Grosskreutz,, et al. Towards a neuroimaging biomarker for amyotrophic lateral sclerosis. Lancet Neurol. 10, 400-403 (2011).
- Müller, H. -P., Kassubek, J. Multimodal imaging in neurology - special focus on MRI applications and MEG. Synthesis Lectures in Biomedical Engineering. Enderle, J. D. 16, Morgan & Claypool Publishers. (2008).
- Douaud, G., Filippini, N., Knight, S., Talbot, K., Turner, M. R. Integration of structural and functional magnetic resonance imaging in amyotrophic lateral sclerosis. Brain. 134, 3470-3479 (2011).
- Kolind, S. H., Laule, C., et al. Complementary information from multi-exponential T2 relaxation and diffusion tensor imaging reveals differences between multiple sclerosis lesions. Neuroimage. 40, 77-85 (2008).
- Verma, R., Zacharaki, E. I. Multiparametric tissue characterization of brain neoplasms and their recurrence using pattern classification of MR images. Acad. Radiol. 15, 966-977 (2008).
Reprints and Permissions
