We describe a procedure for profiling salivary proteins using multiplexed microsphere-based antibody arrays. Monoclonal antibodies were covalently linked to fluorescent dye-encoded 4.5 μm polymer microspheres using carbodiimide chemistry. The modified microspheres were deposited in fiber-optic microwells to measure protein levels in saliva using fluorescence sandwich immunoassays.
A subscription to JoVE is required to view this content. Sign in or start your free trial.
Method Article
Multiplexed Fluorescent Microarray for Human Salivary Protein Analysis Using Polymer Microspheres and Fiber-optic Bundles
In This Article
Summary
Abstract
Herein, we describe a protocol for simultaneously measuring six proteins in saliva using a fiber-optic microsphere-based antibody array. The immuno-array technology employed combines the advantages of microsphere-based suspension array fabrication with the use of fluorescence microscopy. As described in the video protocol, commercially available 4.5 μm polymer microspheres were encoded into seven different types, differentiated by the concentration of two fluorescent dyes physically trapped inside the microspheres. The encoded microspheres containing surface carboxyl groups were modified with monoclonal capture antibodies through EDC/NHS coupling chemistry. To assemble the protein microarray, the different types of encoded and functionalized microspheres were mixed and randomly deposited in 4.5 μm microwells, which were chemically etched at the proximal end of a fiber-optic bundle. The fiber-optic bundle was used as both a carrier and for imaging the microspheres. Once assembled, the microarray was used to capture proteins in the saliva supernatant collected from the clinic. The detection was based on a sandwich immunoassay using a mixture of biotinylated detection antibodies for different analytes with a streptavidin-conjugated fluorescent probe, R-phycoerythrin. The microarray was imaged by fluorescence microscopy in three different channels, two for microsphere registration and one for the assay signal. The fluorescence micrographs were then decoded and analyzed using a homemade algorithm in MATLAB.
Introduction
Since the first microarray reported by Mark Schena and coworkers in the mid-1990s, this powerful tool has been utilized in many fields of biological research1. Antibody microarrays capable of simultaneously detecting multiple proteins in diagnostic fluids, such as blood, have important applications in clinical diagnostics and biomarker screening2-10. Saliva, containing many of the same analytes as blood, has been considered as a preferable alternative to blood because saliva collection is safe, noninvasive, and can be carried out by minimally-trained medical personnel11-13. Currently, multiplexed protein analysis using saliva samples is limited by several important factors, including the low concentration of target analyte14 and the wide concentration range of different biomarkers15.
.Herein, we demonstrate the analysis of six proteins: human vascular endothelial growth factor (VEGF), interferon gamma-induced protein 10 (IP-10), interleukin-8 (IL-8), epidermal growth factor (EGF), matrix metallopeptidase 9 (MMP-9), and interleukin-1 beta (IL-1β). The performance of the method was initially verified using standard solutions constituting recombinant analyte proteins and blocking buffer. Real saliva samples collected from patients of different chronic respiratory diseases as well as healthy controls were also tested with satisfactory performance. The protocol should be applicable to other protein analytes and other microsphere-based assays. This platform offers considerable advantages to the Analytical Chemistry field as it enables fast, accurate, and reproducible simultaneous analysis of low concentrations of several proteins with a broad dynamic range, minimal non-specific interactions, reduced sample consumption, and low cost in comparison to an analogous Enzyme-Linked Immunosorbent Assay (ELISA).
Access restricted. Please log in or start a trial to view this content.
Protocol
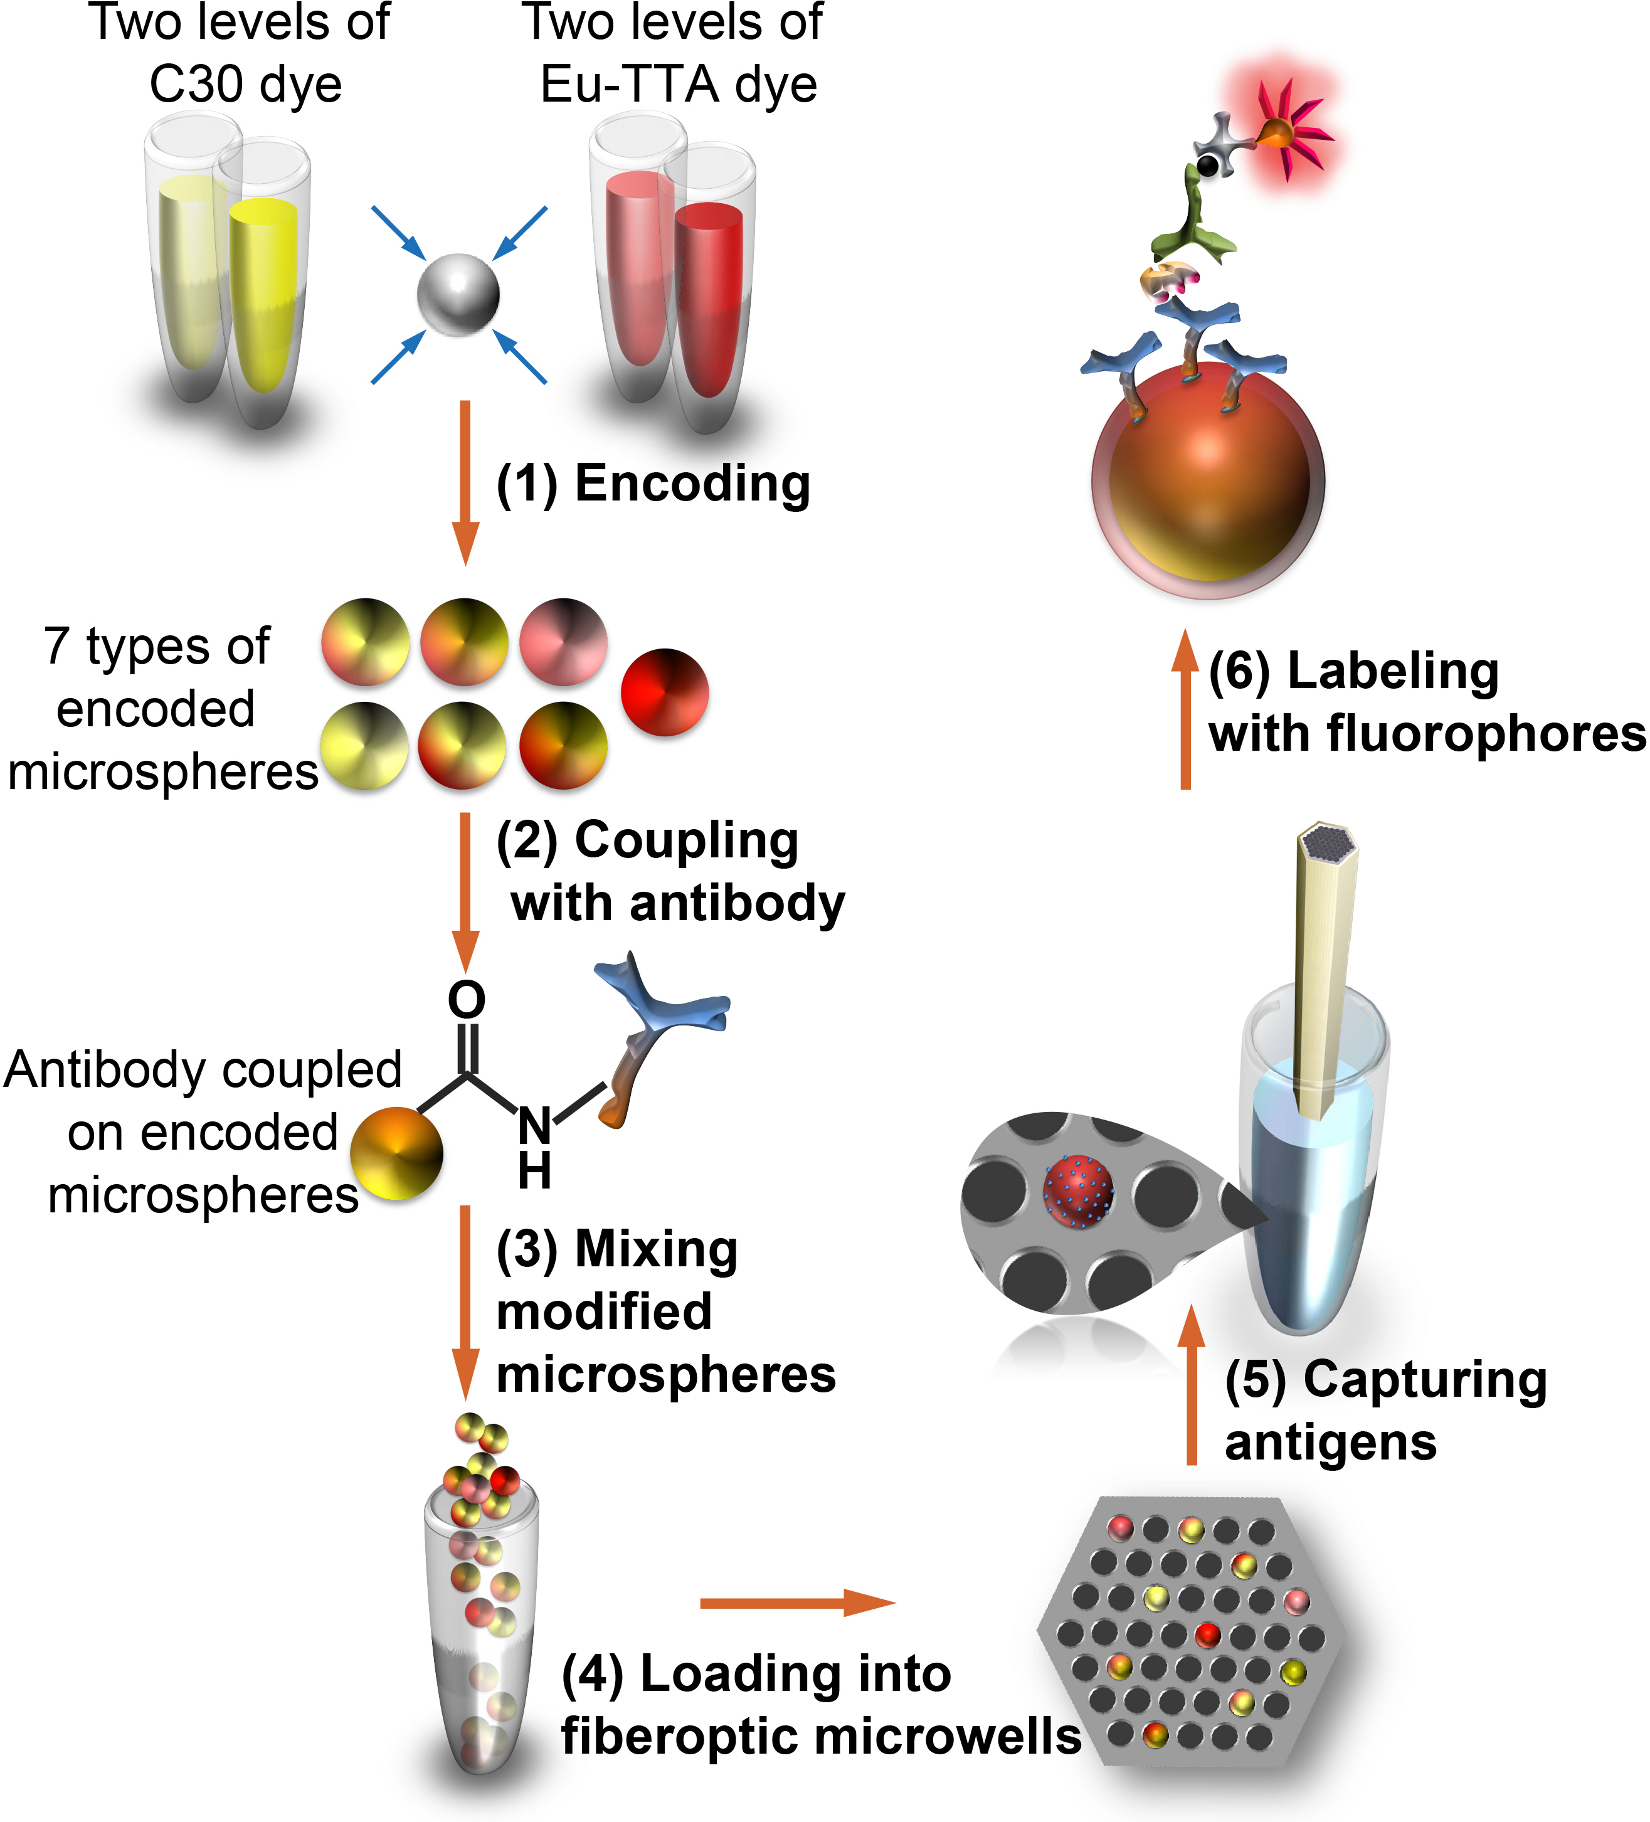
Figure 1. Workflow for applying fiber-optic microsphere antibody array to saliva profiling.
(1) Microspheres are internally encoded with two fluorescent dyes; (2) the encoded microspheres are externally modified with protein-specific monoclonal antibodies; (3) the multiplexed microspheres are mixed, and (4) randomly deposited in microwells etched at the proximal end of a fiber-optic bundle; (5) salivary proteins are captured by microspheres through sandwich immunoassay, and (6) quantified using fluorescence microscopy.
1. Microspheres Encoding
- Weigh sodium europium (III) thenoyltrifluoroacetonate trihydrate (Eu-TTA, MW = 869.54 g/mol) in an amber glass vial and prepare a 200 mM stock solution in tetrahydrofuran (THF). Mix gently by pipetting; visually verify the dye is completely dissolved.
- Weigh coumarin 30 (C30, MW = 347.41 g/mol) in an amber glass vial and prepare a 12 mM stock solution in THF. Mix gently by pipetting; visually verify the dye is completely dissolved.
- Prepare 700 μl of working solution for each microsphere type using the stock solutions and THF to reach final concentration listed in Table 1.
- Ensure microspheres (10% w/v) are well suspended by vortexing, and then transfer 60 μl suspension to a 1.5 ml microcentrifuge tube.
- Add 600 μl PBS to microsphere suspension and mix by pipetting 20x. Centrifuge the tube at 10,000 rpm for 3 min and carefully remove the supernatant. Repeat this process another 2x to wash the microspheres.
- Wash the microsphere pellet 3x with THF using a similar procedure as step 1.5.
- Centrifuge the microsphere/THF suspension at 10,000 rpm for 3 min, remove the supernatant, and re-suspend the pellet in 600 μl working solution listed in Table 1. Transfer the mixture to a new 1.5 ml microcentrifuge tube.
- Seal the microcentrifuge tube with Parafilm and place it on a shaker. Shake at 3,000 rpm and incubate for 24 hr, protect from light by covering the setup using a box covered with aluminum foil.
- Centrifuge the microsphere suspension at 10,000 rpm for 3 min to form a pellet.
- Remove the supernatant dye solution, wash the microspheres 6x with 600 μl methanol and then with 600 μl PBS containing 0.01% Tween-20 another 6x, as described in step 1.5.
- Store the encoded microspheres in 600 μl PBS containing 0.01% Tween-20 at 4 °C until use, protect from light.
| Microsphere type name: | 1 | 2 | 3 | 4 | 5 | 6 | 7 |
| Eu-TTA (mM) | 100 | 100 | 10 | 100 | 10 | ||
| C30 (mM) | 1 | 1 | 6 | 6 | 1 | 6 |
Table 1. Concentrations of Eu-TTA and C30 working solutions.
2. Preparation of Protein-capture Microspheres
- Prepare MES buffer [2-(N-morpholino)ethanesulfonic acid (MES) 0.1 M, NaCl 0.9%, SDS 0.01%, pH 5.7] and PBS/SDS buffer (Sodium Phosphate 0.01 M, NaCl 0.154 M, SDS 0.01%, pH 7.4) in advance at room temperature.
- Add 200 μl encoded microsphere suspension (containing ~2 mg microspheres) into a Safe-Lock 1.5 ml microcentrifuge tube. It is important to use this type of microcentrifuge tube to avoid spillage during the incubation in step 2.6.
- Wash the microspheres with 600 μl MES buffer 3x as described in step 1.5. Add 700 μl MES to the microsphere pellet and mix well by pipetting.
- Prepare 0.105 g/ml 1-ethyl-3-[3-dimethylaminopropyl] carbodiimide hydrochloride (EDC, MW = 191.7 g/mol) and 0.163 g/ml sulfo-N-hydroxysulfosuccinimide (sulfo-NHS, MW = 217.13 g/mol) solutions in MES buffer in separate tubes.
- Add 150 μl freshly prepared EDC solution drop by drop into the microsphere suspension. The EDC hydrolyzes very quickly, thus it is essential to use freshly made solution to ensure the immobilization efficiency. Immediately after the addition of the EDC, add 150 μl sulfo-NHS solution to the microspheres, mix well by pipetting and verify the suspension is homogenous.
- Cap the tube, seal it with Parafilm, and place it on a shaker. Shake at 1,500 rpm for 4 hr, protect from light using a box covered with aluminum foil.
- Centrifuge the microsphere suspension at 10,000 rpm for 3 min to form a pellet and remove the supernatant. Wash the microspheres with 500 μl PBS/SDS buffer 3x as described in the step 1.5.
- Add 200 μl PBS/SDS buffer to the pellet, mix the microspheres well and transfer the solution to 300 μl PBS/SDS buffer containing 60 μg capture antibodies. It is important to suspend the microsphere pellet first and then add the microsphere suspension into the antibody solution.
- Incubate the antibody-microspheres mixture by shaking at 1,500 rpm for 4 hr on a shaker, protect from light using a box covered with aluminum foil.
- Centrifuge the microsphere suspension at 10,000 rpm for 3 min to form a pellet and remove the supernatant. Wash the microspheres with 500 μl StartingBlock (TBS) blocking buffer 3x, as described in step 1.5.
- Mix microspheres with 1 ml of TBS blocking buffer and incubate microspheres at 1,500 rpm for 1 hr on a shaker, protect from light using a box covered with aluminum foil.
- Centrifuge the microsphere suspension at 7,000 rpm for 3 min to form a pellet and remove the supernatant. Wash the pellet 3x with 500 μl TBS blocking buffer, as described in step 1.5.
- Centrifuge the microsphere solution at 7,000 rpm for 3 min to form a pellet and remove the supernatant. Add 500 μl TBS blocking buffer and mix by pipetting.
- Store the modified microsphere suspension at 4 °C until use, protect from light.
- Repeat this procedure to make other types of microspheres using corresponding antibodies.
3. Fiber-optic Microarray Assembly
- Mix 50 μl of each type of protein-capture microspheres into a new autoclaved microcentrifuge tube. Centrifuge the stock microspheres pool at 7,000 rpm for 3 min, and remove the supernatant so that the remaining volume is approximately 100 μl.
- Hand-cut fiber-optic bundles to approximately 5 cm in length and sequentially polish both ends on a polishing machine using 30, 15, 9, 6, 3, 1, 0.5, and 0.05 μm-sized diamond lapping films. Sonicate the polished bundle in deionized water for 2 min to remove any particles.
- Put a small magnetic stirring bar into a 0.5 ml microcentrifuge tube, add 400 μl of protein-free PBS buffer and stir on a magnetic stirring plate for 30 min to remove air bubbles.
- Etch one end of the polished fiber bundle in a 0.025 N HCl solution for 150 sec10,16. Immediately submerge and sonicate the etched end in deionized water for 1 min. Dry the fiber bundles with compressed air.
- Mount the fiber bundle on a fiber holder and block the etched end in the bubble-free, Protein-free PBS buffer for 1 hr.
- Deposit 1 μl aliquot of the stored microsphere suspension on the etched end of the fiber-optic bundle. Protect the setup from light with a box with aluminum foil, and wait for 15 min. The volume of the suspension will decrease by evaporation and force the microspheres into the etched microwells. Repeat this loading step one more time.
- Use a swab saturated with sample solution to remove microspheres that are not trapped in the microwells. The protein microarray is now ready to use. Go immediately to step 4.1 for saliva analysis.
4. Saliva Sample Analysis Using Microspheres Microarray
- Add 200 μl sample solution (100 μl saliva supernatant diluted with equal volume of StartingBlock T20 (PBS) blocking buffer. The collection protocol for saliva supernatant has been published previously10). into a 0.5 ml autoclaved microcentrifuge tube. Dip the protein microarray loaded on the fiber into the solution and incubate on the shaker at 600 rpm for 2 hr, protect from light using a box covered with aluminum foil.
- Prepare 20 ml wash buffer by adding 200 μl 10 % BSA solution and 200 μl 10% Tween-20 into 19.6 ml PBS, mix well by gently shaking.
- Dip the protein microarray into a new autoclaved microcentrifuge tube containing 200 μl wash buffer and shake at 600 rpm for 2 min. Repeat this wash 3x.
- Incubate the microarray in 100 μl solution of a detection antibody cocktail containing 5 μg/ml of anti-VEGF, IP-10, IL-8, EGF, MMP-9, IL-1β biotinylated detection antibodies in StartingBlock T20 (PBS) blocking buffer for 30 min at room temperature on the shaker at 600 rpm, protect from light using a box covered with aluminum foil.
- Wash the microarray 3x with wash buffer as described in step 4.3.
- Incubate the microarray in 200 μl of 20 μg/ml streptavidin R-phycoerythrin conjugate (SAPE) solution in PBS at 600 rpm on the shaker for 10 min, protect from light using a box covered with aluminum foil.
- Wash the microarray 5x with wash buffer as described in step 4.3.
- Clean the distal end of the fiber (i.e., the end away from the microspheres) bundle with a swab saturated with absolute ethanol.
- Dry both ends of the fiber with compressed air. Mount the fiber on an epifluorescent microscope and image through the distal end of the fiber.
- Acquire microsphere images corresponding to Eu-TTA, C30, and SAPE fluorescence emission intensities. Optical filters setup and exposure times for fluorescence imaging of Eu-TTA, C30, and SAPE are depicted in Table 2.
| Channel | Eu-TTA | C30 | SAPE |
| Exciter | 365/10x | 350/50x | 546/10x |
| Beamsplitter | 525DCLP | 400DCLP | 560LP |
| Emitter | 620/60m | 460/50m | 580/30m |
| Exposure time | 1 sec | 0.3 sec | 1 sec |
Table 2. Parameters for the three fluorescent images of the microarray.
Access restricted. Please log in or start a trial to view this content.
Results
Fluorescence images from three channels showing a small section of the fiber-optic bundle are shown in Figures 2A-C. These images were analyzed using an algorithm written in MATLAB (as described in more detail in the Discussion section). The analysis employs both information from the Eu-TTA encoding image (Figure 2A) and the C30 encoding image (Figure 2B) to decode the microspheres, and the fluorescence intensities of different microspheres in the signal image (F...
Access restricted. Please log in or start a trial to view this content.
Discussion
Researchers should pay extra attention to the following steps: for better decoding accuracy, it is necessary to verify the microspheres were homogeneously suspended in all incubation and wash steps during the microspheres encoding procedure. In addition, the encoded microspheres need to be protected from light throughout the entire experiment. Following proper encoding and storage procedures, we found that overall decoding accuracy was above 99%. The encoded microspheres should be stored at 4 °C. Avoid freez...
Access restricted. Please log in or start a trial to view this content.
Disclosures
The authors declare that they have no competing financial interests.
Acknowledgements
This work was supported by the National Institutes of Health (grant 08UDE017788-05). E.B.P. also acknowledges support from the Spanish Foundation for Science and Technology (FECYT). The authors thank Shonda T. Gaylord and Pratyusha Mogalisetti for critical reading of the manuscript.
Access restricted. Please log in or start a trial to view this content.
Materials
| Name | Company | Catalog Number | Comments |
|---|---|---|---|
| Eu-TTA dye | Fisher Scientific | AC42319-0010 | |
| THF | Sigma-Aldrich | 34865-100ML | |
| Amber glass vial | Fisher Scientific | 03-339-23B | |
| Coumarin 30 dye | Sigma-Aldrich | 546127-100MG | |
| Microspheres | Bangslabs | PC05N/6698 | |
| 1.5 ml microcentrifuge tubes | Fisher Scientific | 05-408-129 | |
| PBS 10x concentrate | Sigma-Aldrich | P5493-1L | |
| Water | Sigma-Aldrich | W4502-1L | |
| Methanol | Sigma-Aldrich | 34860-100ML | |
| Tw-20 | Sigma-Aldrich | P7949-100 ml | |
| BupH MES buffered saline | Thermo Scientific | 28390 | |
| SDS | Sigma-Aldrich | 05030-500ML-F | |
| NaOH solution | Fisher Scientific | SS256-500 | |
| Safe-lock microcentrifuge tube | VWR labshop | 53511-997 | |
| EDC | Thermo Scientific | 22980 | |
| Sulfo-NHS | Thermo Scientific | 24510 | |
| Human VEGF capture antibody | R&D Systems | MAB293 | |
| Human IP-10 capture antibody | R&D Systems | MAB266 | |
| Human IL-8 capture antibody | R&D Systems | MAB208 | |
| Human EGF capture antibody | R&D Systems | MAB636 | |
| Human MMP-9 capture antibody | R&D Systems | MAB936 | |
| Human IL-1β capture antibody | R&D Systems | MAB601 | |
| Mouse IgG1 isotype control antibody | R&D Systems | MAB002 | |
| StartingBlock (TBS) buffer | Thermo Scientific | 37542 | |
| HCl standard solution 1.0 N | Sigma-Aldrich | 318949-500 ml | |
| 0.5 ml microcentrifuge tubes | Fisher Scientific | 05-408-120 | |
| Protein-free (PBS) buffer | Thermo Scientific | 37572 | |
| Recombinant human VEGF 165 | R&D Systems | 293-VE | |
| Recombinant human IP-10 | R&D Systems | 266-IP | |
| Recombinant human IL-8 | R&D Systems | 208-IL | |
| Recombinant human EGF | R&D Systems | 236-EG | |
| Recombinant human MMP-9 | R&D Systems | 911-MP | |
| Recombinant human IL-1β | R&D Systems | 201-LB | |
| StartingBlock T20 (PBS) buffer | Thermo Scientific | 37539 | |
| Blocker BSA in PBS | Thermo Scientific | 37525 | |
| Biotinylated VEGF detection antibody | R&D Systems | BAF293 | |
| Biotinylated IP-10 detection antibody | R&D Systems | BAF266 | |
| Biotinylated IL-8 detection antibody | R&D Systems | BAF208 | |
| Biotinylated EGF detection antibody | R&D Systems | BAF236 | |
| Biotinylated MMP-9 detection antibody | R&D Systems | BAF911 | |
| Biotinylated IL-1β detection antibody | R&D Systems | BAF201 | |
| Streptavidin, R-phycoerythrin | Invitrogen | S-21388 | |
| Ethanol (200 proof) | Sigma-Aldrich | E7023-500ML |
References
- Schena, M., Shalon, D., Davis, R. W., Brown, P. O. Quantitative monitoring of gene-expression patterns with a complementary-DNA microarray. Science. 270, 467-470 (1995).
- Schena, M. Protein Microarray. , Jones and Bartlett Publishers. (2004).
- Tam, S. W., Wiese, R., Lee, S., Gilmore, J., Kumble, K. D. Simultaneous analysis of eight human Th1/Th2 cytokines using microarrays. J. Immunol. Methods. 261 (01), 157-165 (2002).
- Wang, C. C., et al. Array-based multiplexed screening and quantitation of human cytokines and chemokines. J. Proteome Res. 1, 337-343 (2002).
- de Jager, W., Velthuis, te, Prakken, H., Kuis, B. J., W,, Rijkers, G. T. Simultaneous detection of 15 human cytokines in a single sample of stimulated peripheral blood mononuclear cells. Clin. Diagn. Lab. Immunol. 10, 133-139 (2003).
- Lee, H. J., Nedelkov, D., Corn, R. M. Surface plasmon resonance imaging measurements of antibody arrays for the multiplexed detection of low molecular weight protein biomarkers. Anal. Chem. 78, 6504-6510 (2006).
- Vignali, D. A. A. Multiplexed particle-based flow cytometric assays. J. Immunol. Methods. 243 (00), 243-255 (2000).
- Rissin, D. M., et al. Single-molecule enzyme-linked immunosorbent assay detects serum proteins at subfemtomolar concentrations. Nat. Biotechnol. 28, 595-599 (2010).
- Zhang, H., Nie, S., Etson, C. M., Wang, R. M., Walt, D. R. Oil-sealed femtoliter fiber-optic arrays for single molecule analysis. Lab Chip. 12, 2229-2239 (2012).
- Blicharz, T. M., et al. Fiber-Optic Microsphere-Based Antibody Array for the Analysis of Inflammatory Cytokines in Saliva. Anal. Chem. 81, 2106-2114 (2009).
- Mukhopadhyay, R. Devices to drool for. Anal. Chem. 78, 4255-4259 (2006).
- Wong, D. T. Salivary diagnostics powered by nanotechnologies, proteomics and genomics. J. Am. Dent. Assoc. 137, 313-321 (2006).
- Segal, A., Wong, D. T. Salivary diagnostics: enhancing disease detection and making medicine better. Eur. J. Dent. Educ. 12, 22-29 (2008).
- St John, M. A. R., et al. Interleukin 6 and interleukin 8 as potential biomarkers for oral cavity and oropharyngeal squamous cell carcinoma. Arch. Otolaryngol. Head Neck Surg. 130, 929-935 (2004).
- Herr, A. E., et al. Microfluidic immunoassays as rapid saliva-based clinical diagnostics. Proc. Natl. Acad. Sci. U.S.A. 104, 5268-5273 (2007).
- Pantano, P., Walt, D. R. Ordered nanowell arrays. Chem. Mater. 8, 2832-2835 (1996).
- Schena, M. Protein Microarrays. , Jones and Bartlett Publishers. (2005).
- Mouse IgG1 Isotype Control [Internet]. , Available from: http://www.rndsystems.com/Products/MAB002 (2013).
Access restricted. Please log in or start a trial to view this content.
Reprints and Permissions
