A standardized mouse model of subarachnoid hemorrhage by intraluminal Circle of Willis perforation is described. Vessel perforation and subarachnoid bleeding are monitored by intracranial pressure monitoring. In addition various vital parameters are recorded and controlled to maintain physiologic conditions.
Method Article
A Murine Model of Subarachnoid Hemorrhage
In This Article
Summary
Abstract
In this video publication a standardized mouse model of subarachnoid hemorrhage (SAH) is presented. Bleeding is induced by endovascular Circle of Willis perforation (CWp) and proven by intracranial pressure (ICP) monitoring. Thereby a homogenous blood distribution in subarachnoid spaces surrounding the arterial circulation and cerebellar fissures is achieved. Animal physiology is maintained by intubation, mechanical ventilation, and continuous on-line monitoring of various physiological and cardiovascular parameters: body temperature, systemic blood pressure, heart rate, and hemoglobin saturation. Thereby the cerebral perfusion pressure can be tightly monitored resulting in a less variable volume of extravasated blood. This allows a better standardization of endovascular filament perforation in mice and makes the whole model highly reproducible. Thus it is readily available for pharmacological and pathophysiological studies in wild type and genetically altered mice.
Introduction
SAH is the stroke subtype with the least beneficial outcome for patients: 40% of the patients die within a month after the bleeding1 and survivors rarely have a clinically favorable outcome.
The large majority of spontaneous SAHs (80%) are caused by rupture of intracranial aneurysms which are mostly located along the anterior and posterior communicating artery, the basilar artery, and middle cerebral artery (MCA)2.
Such aneurysms are difficult to model in animals and therefore animal models of SAH are either performed by injection of blood into the subarachnoid space/cerebral ventricles or by endovascular perforation of a subarachnoid vessel.
Autologous blood injection into the cisterna magna is easy to perform and reproducible as the blood volume can be directly controlled3. Unfortunately some aspects of the SAH pathophysiology, e.g. the vessel injury, cannot be modeled by this procedure. Another technical approach for induction of SAH is the opening of an intracisternal vein4.
However, the intraluminal CWp at the MCA branch appears to be the procedure that models the pathophysiology in humans most closely5. The method was developed and first described in rats by Bederson and colleagues and at the same time by Veelken and colleagues6,7. Later the intraluminal perforation model was adapted to mice8,9. A filament is inserted into the external carotid artery (ECA) and advanced to the skull base via the internal carotid artery (ICA). At the branching point of the MCA the filament perforates the vessel and induces a bleeding into the subarachnoid space at the skull base. The blood then distributes into the remaining subarachnoid space along fissures and blood vessels. Bleeding is stopped by clot formation at the site of perforation, but rebleedings, which are often detrimental in patients10, can occur. Accordingly, the endovascular filament model became a widely used SAH model during the past few years. The most frequently mentioned drawback of the filament perforation model is that bleeding volume cannot be directly controlled and may therefore be variable. This variability can significantly be reduced by tight control of animal physiology and post-hemorrhagic ICP.
Mice have the great advantage that a large number of genetically modified strains are available. However, due to their small size surgical procedures tend to be more complex than in larger species, e.g. rats or rabbits. Therefore the downscaling of techniques developed for rats to mice often does not lead to the desired results, e.g. as mice have a very limited body weight and blood volume noninvasive techniques for blood pressure and blood gas analysis as well as for hemoglobin saturation and heart rate monitoring have to be applied whenever possible. Accordingly, the aim of the current publication is to describe the filament perforation model for SAH in mice and to demonstrate how this model can be performed in a standardized and highly reproducible manner.
Protocol
All surgical procedures were subjected to ethical review and approved by the government of Upper Bavaria (reference number: 55.2-1-54-2532.3-13-13 and -2532-136-11). Animals are male C57BL/6 mice with a body weight of approximately 25 g.
1. Animal Preparation
- Induce anesthesia by putting the mouse into a chamber. Flush the chamber with 5% isoflurane until the animal loses consciousness.
- Inject premixed anesthetics intraperitoneally: fentanyl (0.05 mg/kg), midazolam (5 mg/kg) and medetomidine (0.5 mg/kg). Check reflexes before and regularly during the procedure. Reinject one third of the initial amount hourly to maintain anesthesia.
- Intubate orotracheally with a tube made from a 20 G venous catheter11. For intubation fix the animal on a slanted platform (30°), retract the tongue with bent forceps, visualize the vocal cords under an operation microscope and insert the tube into the trachea during inspiration.
- Place the mouse in a prone position and check the correct placement of the tube with a piece of cotton or a microcapnograph.
- Connect the intubation tube to the respirator. Ventilate the mouse with room air supplemented with 25% oxygen with a frequency of 180-220 breaths/min and a stroke volume of 200-250 μl.
- Connect the intubation tube to the microcapnograph. Maintain the end-expiratory pCO2 at 30 mmHg by adjusting the ventilation frequency.
- Insert a rectal temperature probe and place the animal on a heating pad in order to maintain 37 °C core body temperature.
- Apply the annular pulsoximeter sensor on the right hind paw.
- Open the skin above the skull with a pair of scissors. The incision should be approximately 0.5 cm long and between ear and eye.
- Dissect the left temporal muscle with a scalpel from the temporal bone.
- Glue the laser Doppler flowmeter (LDF) probe on the left temporal bone. Hold the probe in a fixed position until the glue hardens.
- Drill a hole of approximately 1.5 mm diameter with a dental drill into the left temporal bone. Cool the bone with saline to prevent heat damage.
- Insert the ICP probe into the cranial cavity. Push forward as dorsally as possible to prevent brain tissue damage and bleeding.
- If the probe is at the right position, fix, and seal it with cement. Let the cement dry for 5 min.
- Turn the mouse carefully to a supine position.
- For continuous blood pressure monitoring, catheterize the left femoral artery.
- Connect the femoral catheter to the blood pressure monitoring device.
2. SAH Induction
- Open the skin with a pair of scissors from sternum to chin (2 cm). Dissect the connective tissue bluntly and push the salivary glands aside.
- Expose the left common carotid artery (CCA) and mobilize it. Preserve the vagal nerve, which runs in the same connective tissue sheath as the CCA. Move cranial and expose and mobilize the ICA and the ECA using the same technique.
- Ligate the ECA as far cranially as possible.
- Prearrange two more ligations for the filament around the ECA.
- Occlude the CCA and the ICA temporarily with microclips. Position the microclips with a microclip applicator. Make sure the clips are applied correctly by gently pulling them back.
- Cut a hole for the filament insertion into the ECA with a vessel scissors.
- Insert a Prolene 5-0 filament with 12 mm length into the ECA.
- Close the insertion site with one prearranged ligation.
- Remove the microclips with a microclip applicator from the CCA and the ICA.
- Advance the filament with a forceps into the ICA until the ICP rises. A sudden rise of the ICP indicates bleeding induction.
- Withdraw the filament immediately and ligate the ECA by closing both prearranged ligations consecutively. This prevents bleeding out of the insertion site.
- Suture the skin wound.
- Monitor the physiologic parameters of the animal for another 20 min.
- Remove ICP and LDF probes and suture the skin wound.
3. End of Experiment
- Perfuse the animal transcardially with 20 ml of saline (room temperature) followed by 20 ml of 4% PFA in PBS (4 °C).
- Dissect the brain out of the skull. Cut the skull in the midline and between the orbital cavities. Then peel the bone from the brain.
- Evaluate the blood distribution in the subarachnoid space.
4. Considerations in Case of Survival Surgery (not shown in the video)
- Inject Carprofen (4 mg/kg subcutaneously) for postoperative analgesia directly after anesthesia induction. During the postoperative observation period Carprofen (4 mg/kg subcutaneously) is injected every 24 hr.
- Instead of invasive blood pressure measurement make use of a noninvasive blood pressure monitoring system.
- For termination of anesthesia inject antagonizing agents subcutaneously: naloxone (1.2 mg/kg), flumazenil (0.5 mg/kg) and atipamezole (2.5 mg/kg).
- Extubate the animal.
- After regaining of reflexes put the animal into a preheated chamber. Keep the animal at approximately 32 °C for 24 hr.
- Animals are checked regularly for spontaneous breathing and their general condition during the first hours after surgery. If the brain stem is affected animals have breathing problems and should be euthanized.
- Animals are checked daily for their general condition and body weight as well as for neurological and sensory deficits15.
Results
Mortality
Once the surgery technique is mastered the procedure does not elicit any intraoperative mortality. Also bleeding can be achieved in virtually all animals. Postoperative mortality is 30-40% with most animals dying on day 1 after surgery (Figure 5).
ICP values after SAH
The ICP before bleeding is around 4 mmHg. Bleeding results in a sharp increase of the ICP up to 120 mmHg. ICP values then stabilize within 5 min at approximately 30 mmHg (Figure 1). At 24 hr after bleeding the ICP is still slightly elevated to 10 mmHg5.
Blood pressure after SAH
Blood pressure rises immediately after bleeding induction (Figure 2). This is due to the Cushing reflex, which is initiated by elevated ICP.
Cerebral perfusion after SAH
After bleeding induction a dramatic decrease of cerebral perfusion can be monitored. Reperfusion to an individually different level occurs within 5 min after the insult (Figure 3).
Blood distributes along brain supplying arteries and cerebellar fissures
We perfused animals 3 hr after SAH transcardially with 20 ml of saline followed by 20 ml of chilled 4% PFA. The brain was carefully removed and blood distribution in the subarachnoid space was observed. Blood distributes along the perivascular space of brain supplying arteries towards the dorsal cortex. In all cases the extravasated blood covered the MCA up to the second branching. The side ipsilateral to the hemorrhage was covered with more blood than the contralateral hemisphere (Figure 4).
Blood distribution does not correlate with ICP rise
In 5 animals we investigated whether the rise of the ICP during SAH has an impact on blood distribution in the subarachnoid space. One hypothesis was that animals that show only a moderate ICP rise during SAH might exhibit less extravasated blood, which then does not distribute to the dorsal parts of the cortex. We found that only the size of the hematoma at the skull base seems to correlate with the ICP rise. Blood distribution along the brain supplying arteries did not differ between animals with different ICP peak values.

Figure 1. ICP value after SAH. Representative ICP values of 5 animals after SAH. Click here to view larger image.
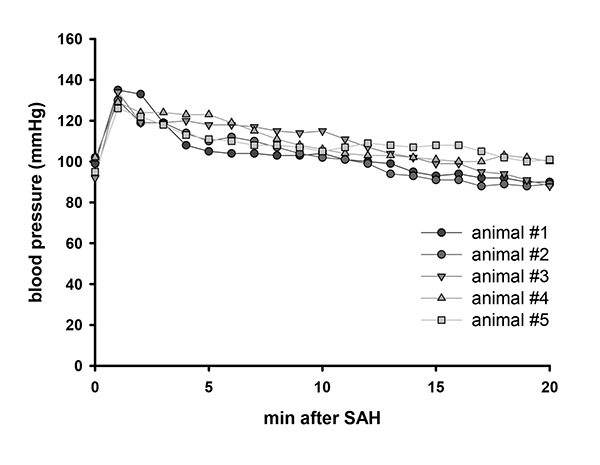
Figure 2. Blood pressure after SAH. Representative blood pressure values of 5 animals after SAH. Click here to view larger image.

Figure 3. Cerebral perfusion after SAH. Representative laser Doppler flowmeter values of 5 animals after SAH. Click here to view larger image.

Figure 4. Blood distribution along brain supplying arteries. Representative blood distribution of 5 animals after SAH. Red lines indicate blood distribution along brain supplying arteries. Click here to view larger image.

Figure 5. Survival curve after SAH. Survival curve following SAH in 49 male C57BL/6 mice. Click here to view larger image.
Discussion
Treatment options after SAH are scarce and mostly inefficacious. Therefore the pathophysiology of post-hemorrhagic brain damage needs to be further understood in order to identify new therapeutic targets and develop novel therapeutic approaches. Standardized and well reproducible animal models in genetically modified animals, i.e. mice, are crucial for such investigations. The CWp model has become a widely used model for SAH as it resembles the pathophysiology in humans closely; however, its use in mice is hampered by low reproducibility and a high interpersonal variability. Variations of the model are caused by different anesthetic protocols, which alter physiologic conditions. The amount of bleeding varies between animals due to vessel reactivity, blood pressure and coagulation differences12. Thus it is important to monitor physiologic conditions throughout the procedure and to establish surgical and monitoring protocols which reduce the variability of this model.
Blood distribution after SAH may be different between species. In the rat model blood seems to be equally distributed across both cerebral hemispheres6. As human brains show a gyrencephalic architecture the blood is likely to distribute mainly along brain sulci and not primarily along vessels. On the other hand, brain supplying arteries run in those sulci e.g. the MCA in the lateral sulcus. Thus vessel pathologies might be similar in rodent animal models and the human brain.
In our laboratory we use a combination of fentanyl, medetomidine and midazolam as described above for surgical anesthesia. This combination has a relatively small effect on blood pressure and vessel reactivity11. In contrast, isoflurane, a widely used anesthetic in SAH research, leads to peripheral vasodilation, severely impaired cerebral autoregulation13, and low blood pressure immediately after SAH12, findings which are not regularly associated with the early pathophysiology of SAH in humans. Hence, the use of an anesthetic protocol that does not disturb post-hemorrhagic pathophysiology is an important prerequisite for a valid experimental SAH model.
The amount of bleeding depends on the vessel lesion and varies therefore with filament size14. Another crucial step of the model is the withdrawal of the filament after vessel perforation. Blood flow in the ICA is disrupted by the filament and a delayed withdrawal may result in smaller bleedings. Accordingly, it is crucial to standardize the time between vessel perforation and filament withdrawal. This is of course only possible if the time point of vessel perforation can be determined with high temporal precision. In our setup this is achieved by continuous measurement of ICP. A sharp increase in ICP indicates successful vessel perforation and allows thereby the standardization of filament withdrawal and hence bleeding intensity. In addition, ICP-controlled vessel perforation prevents that the filament is advanced too far thereby preventing brain tissue damage. Accordingly, continuous ICP measurement is an excellent technique to minimize the variability of the murine SAH model.
Disclosures
Authors have nothing to disclose.
Acknowledgements
The current research is funded by the Solorz-Zak Research Foundation.
Materials
| Name | Company | Catalog Number | Comments |
|---|---|---|---|
| Equipment | |||
| operation microscope | Leica | KL2500 | |
| isoflurane vaporizer | Harvard Instruments | Continuous Flow Vaporizer | |
| respirator | Hugo Sachs | Minivent 845 | |
| microcapnograph | Hugo Sachs | Type 340 | |
| temperature controller | FHC | DC Temperature Controller | |
| dental drill | Paggen | Labset- N | |
| ICP monitor | Codman | ICP monitor | |
| blood pressure monitor | AD Instruments | Bridge Amp FE221 | |
| syringe pump | World Precision Instruments | SP101IZ | |
| pulsoximeter | Kent Scientific | MouseSTAT | |
| LDF | Perimed | Periflux 5000 | |
| analog data monitor | AD Instruments | Power Lab 16/35 | |
| Material | |||
| cement for ICP probe fixation | Speiko | Carboxylate cement | |
| glue for LDF probe fixation | Bob Smith Industries | Cyanoacrylate glue (Maxi Cure and Insta Set) | |
| venous catheter | Johnson Johnson | Jelco winged i.v. catheter; REF 4076 | modified intubation tube |
| tubing for femoral catheter | Smiths Medical | Fine Bore Polythene Tubing; ID 0.28 mm OD 0.61 mm; REF 800/100/100 | cut to 30 cm length |
| filament for vessel perforation | Ethicon | Prolene 5-0 | cut to 12 mm length |
| surgical equipment | Fine Scientific Instruments | forceps medical #5, vessel scissors 8 cm, microclip 4 mm jaw |
References
- Cahill, J., Zhang, J. H. Subarachnoid hemorrhage: is it time for a new direction. Stroke. 40, 86-87 (2009).
- van Gijn, J., Kerr, R. S., Rinkel, G. J. Subarachnoid haemorrhage. Lancet. 369, 306-318 (2007).
- Lin, C. L., et al. A murine model of subarachnoid hemorrhage-induced cerebral vasospasm. J. Neurosci. Methods. 123, 89-97 (2003).
- Altay, T., et al. A novel method for subarachnoid hemorrhage to induce vasospasm in mice. J. Neurosci. Methods. 183, 136-140 (2009).
- Feiler, S., Friedrich, B., Scholler, K., Thal, S. C., Plesnila, N. Standardized induction of subarachnoid hemorrhage in mice by intracranial pressure monitoring. J. Neurosci. Methods. 190, 164-170 (2010).
- Bederson, J. B., Germano, I. M., Guarino, L. Cortical blood flow and cerebral perfusion pressure in a new noncraniotomy model of subarachnoid hemorrhage in the rat. Stroke. 26, 1086-1091 (1995).
- Veelken, J. A., Laing, R. J., Jakubowski, J. The Sheffield model of subarachnoid hemorrhage in rats. Stroke. 26, 1279-1283 (1995).
- Kamii, H., et al. Amelioration of vasospasm after subarachnoid hemorrhage in transgenic mice overexpressing CuZn-superoxide dismutase. Stroke. 30, 867-871 (1999).
- Parra, A., et al. Mouse model of subarachnoid hemorrhage associated cerebral vasospasm: methodological analysis. Neurol. Res. 24, 510-516 (2002).
- Broderick, J. P., Brott, T. G., Duldner, J. E., Tomsick, T., Leach, A. Initial and recurrent bleeding are the major causes of death following subarachnoid hemorrhage. Stroke. 25, 1342-1347 (1994).
- Thal, S. C., Plesnila, N. Non-invasive intraoperative monitoring of blood pressure and arterial pCO2 during surgical anesthesia in mice. J. Neurosci. Methods. 159, 261-267 (2007).
- Hockel, K., Trabold, R., Scholler, K., Torok, E., Plesnila, N. Impact of anesthesia on pathophysiology and mortality following subarachnoid hemorrhage in rats. Exp. Transl. Stroke Med. 4, 5(2012).
- Wang, Z., Schuler, B., Vogel, O., Arras, M., Vogel, J. What is the optimal anesthetic protocol for measurements of cerebral autoregulation in spontaneously breathing mice? Exp. Brain Res. 207, 249-258 (2010).
- Schwartz, A. Y., Masago, A., Sehba, F. A., Bederson, J. B. Experimental models of subarachnoid hemorrhage in the rat: a refinement of the endovascular filament model. J. Neurosci. Methods. 96, 161-167 (2000).
- Feiler, S., Plesnila, N., Thal, S. C., Zausinger, S., Scholler, K. Contribution of matrix metalloproteinase-9 to cerebral edema and functional outcome following experimental subarachnoid hemorrhage. Cerebrovasc. Dis. 32, 289-295 (2011).
Reprints and Permissions
