A qPCR assay was developed for detection of Escherichia coli O157:H7 targeting a unique genetic marker, Z3276. The qPCR was combined with propidium monoazide (PMA) treatment for live cell detection. This protocol has been modified and adapted to a 96-well plate format for easy and consistent handling of numerous samples
Method Article
Detection of Live Escherichia coli O157:H7 Cells by PMA-qPCR
In This Article
Summary
Abstract
A unique open reading frame (ORF) Z3276 was identified as a specific genetic marker for E. coli O157:H7. A qPCR assay was developed for detection of E. coli O157:H7 by targeting ORF Z3276. With this assay, we can detect as low as a few copies of the genome of DNA of E. coli O157:H7. The sensitivity and specificity of the assay were confirmed by intensive validation tests with a large number of E. coli O157:H7 strains (n = 369) and non-O157 strains (n = 112). Furthermore, we have combined propidium monoazide (PMA) procedure with the newly developed qPCR protocol for selective detection of live cells from dead cells. Amplification of DNA from PMA-treated dead cells was almost completely inhibited in contrast to virtually unaffected amplification of DNA from PMA-treated live cells. Additionally, the protocol has been modified and adapted to a 96-well plate format for an easy and consistent handling of a large number of samples. This method is expected to have an impact on accurate microbiological and epidemiological monitoring of food safety and environmental source.
Introduction
PCR is a common technique for detection of E. coli O157:H7 from food and environmental samples. Identifying specific biomarkers for E. coli O157:H7 is one of the key factors for successful detection in PCR assays. The biomarkers commonly used in PCR assays for detection of E. coli O157:H7 include Shiga toxins (stx1 and stx2)1,2, uidA3,4, eaeA5,6, rfbE7, and fliC genes8,9. These biomarkers can provide variable efficiency for identification; however, most of the biomarkers cannot be used as a unique biomarker for detection of E. coli O157:H7. This inadequacy in differentiation power of target genes calls for more specific and stronger biomarker(s) for identification of E. coli O157:H710.
Numerous probes for genes or hypothetical open reading frames (ORFs) in E. coli O157:H711 were designed for qPCR assay based on the clues from DNA genotyping microarrays from our laboratory and by searching within the GenBank database of the National Center for Biotechnology Information. The sequence of Z3276 ORF, which is a fimbrial gene11, was selected for qPCR assay. Subsequently, a qPCR assay was developed through numerous trials on PCR parameters such as concentrations of primers and probes, as well as annealing and extension temperatures (data not shown). After incentive inclusivity and exclusivity tests on reference strains such as E. coli O157:H7, non-O157 and Shigella strains in the qPCR, the ORF Z3276 was identified as a specific and strong genetic marker for identification of E. coli O157:H7. Then we develop a new qPCR method using this unique biomarker for identification of E. coli O157:H7.
Another challenge in detection of E. coli O157:H7 in contaminated foods and environment is accurate determination of live cells from samples. The extended presence of DNA from dead cells and inability to differentiate viability in PCR assay could cause false-positive readings, resulting in overestimation of live cell numbers in detection. Consequently, this limits the PCR usage in accurate detection of foodborne pathogens12. A novel approach to differentiate DNA of the dead cells has been taken by combining propidium monoazide (PMA) treatment with PCR procedure in the last few years13-15. PMA is able to go inside of dead cells, and intercalate into the DNA when exposed to light, but it cannot go inside of live cells to react with the DNA of the live cells. Thus, in PMA-treated mixtures of live and dead cells, the DNA of dead cells cannot be amplified in PCR13. We combined PMA treatment with the newly developed qPCR assay to selectively detect live E. coli O157:H7 cells. Additionally, we have made the PMA-qPCR assay possible for high throughput detection.
Protocol
1. Bacterial Strains and DNA Template Preparation
- Grow bacterial strains of E. coli O157:H7, non-O157, and other pathogenic species, such as Salmonella and Shigella, at 37 °C overnight with shaking.
- Extract DNA from bacterial cultures using the appropriate kit (see table of materials) and following manufacturer's instructions.
- Measure optical density (OD260) to determine the DNA concentrations by using a spectrophotometer.
2. Primer and Probe Design for the qPCR Assay
- E. coli O157:H7 sequences are from GenBank accession number AE00517411. Design primers and probe using appropriate software for primer and probe design for real-time PCR (see materials table for details).
The sequences of primers and probe are as follows: Z3276-Forward (F) 5'-TATTCCGCGATGCTTGTTTTT-3'
Z3276-Reverse (R) 5'- ATTATCTCACCAGCAAACTGGCGG-3'
Z3276-Probe, FAM-CCGCAATCTTTCC- MGBNFQ - Reconstitute the primer powder with water, resulting in a concentration of 10 μM as a primer work solution.
- Dilute the probes to 10 μM as probe work solutions. Labeled probes vary in potency with batches. Therefore, titrate each batch of labeled probes before using for optimal qPCR performance.
3. Setting the qPCR Assay Conditions
- Prepare reaction mixture, which consists of 25.0 μl of 2x real-time PCR master mix, 200 nM of forward primer, 200 nM of reverse primer, and 100 nM of probe.
- Add 5 μl of sample DNA (100 pg) and an appropriate volume of water to reach a final volume of 50 μl.
- For nontemplate control, use 5 μl of water to replace DNA sample.
- Set the qPCR conditions as follows: 95 °C for 10 min for activation of TaqMan; followed by 40 cycles of 95 °C for 10 sec for denaturation and 60 °C for 1 min for annealing/extension.
4. qPCR Sensitivity Test
- Make a serial 10-fold dilution from a culture of mid-exponential phase (OD600 = 0.5; about 1.5 x 10⁸ CFU/ml by plating).
- Add 100 ml of cell dilutions onto a 96-well plate in triplicate.
- Centrifuge the plate at 2,500 x g for 10 min.
- Add 50 ml of DNA extraction solution to each well.
- Resuspend cell pellets with a multi-channel pipette.
- Seal the plate with a film, boil the plate in a water bath for 10 min, and centrifuge at 2,500 x g for 2 min.
5. Preparing Live and Dead Cell Mixtures for PMA Treatment
- Grow 10 ml of E. coli O157:H7 at 37 °C to mid-exponential phase and divide the culture into two aliquots.
- Boil one aliquot of cells for 10 min in a water bath for dead cells and leave the other aliquot for live cells.
- Verify there are no live cells from the heat-killed aliquot by plating the cells on LB agar plates.
- Take 2 ml of the live and heat-killed cells and adjust the concentration to 8 x 10⁶ CFU/ml with LB medium. Create four sets of cell dilutions ranging from 8 x 100 to 8 x 10⁶ CFU/ml.
- Use the first two sets of cell dilutions for live cells treated with PMA or untreated.
- To the third and fourth sets of cell dilutions, add 8 x 10⁶ dead cells to each cell dilution (8 x 100 - 8 x 10⁶) to make live and dead cell mixtures.
- Treat the third set of dilution with PMA and use the fourth set of dilution for control.
6. Treating Cells with PMA
- Dissolve PMA in dimethyl sulfoxide (or water) to make 10 mM stock solution and stored at -20 °C in the dark.
- Aliquot 400 μl of the live cells, dead cells, and mixture of live and dead cells in three separate microtubes.
- Add 2.0 ml of 10 mM PMA to each cell aliquot to a final concentration of 50 μM.
- Incubate the samples at ambient temperature for 5 min in the dark, shaking gently a few times, 3 sec each time.
- Add 100 μl of samples on a 96-well plate.
- Seal the plate with an optical film and put the plate on ice.
- Set the plate 20 cm from a 650 W halogen light source and expose for 2 min for light exposure.
- Centrifuge the plate at 2,500 x g for 10 min, gently discard the supernatant and carefully drain the plate on a piece of absorbing paper.
- Resuspend cell pellets in 50 μl of DNA extraction solution by pipetting up and down twenty times with a multi-channel Pipetman.
- Seal the plate with a film, boil for 10 min in a water bath, and centrifuge at 2,500 x g for 2 min. The supernatant in the plate is the DNA from cells treated with PMA and ready for qPCR.
- Perform qPCR as described above, using 5 μl of DNA.
Results
Detection of E. coli O157:H7 by qPCR using ORF Z3276
One of the key factors of this assay is the sensitivity and specificity of the Z3276 probe used in the qPCR. It can detect as low as a few copies of the genome of DNA of E. coli O157:H7 as shown in Figure 1A. Of the 120 non-O157 strains examined, including the six major non-O157 STEC strains, O104:H4 strains, Salmonella, and Shigella strains, no cross-reactivity was found, as shown in Table 1.
Combination of the PMA treatment with qPCR
Incubating E. coli O157:H7 cells with PMA (50 mM) for 5 min in the dark and exposing to light for 2 min were selected for PMA treatment conditions. Additionally, we modified PMA treatment procedure. Compared with various transparent microtubes used in the cross-linking step, a 96-well plate was found to be more efficient to reach the optimal cross-linking effect and more convenient than handling a large number of sample tubes during the light exposure process.
Amplification of DNA from PMA-treated live and dead cells in qPCR
The effects of PMA-mediated inhibition of amplification of DNA from dead cells on this qPCR assay were shown in Figure 1 by using DNA derived from two serial 10-fold live or dead cell dilutions. The results show that the curves generated from the live cells treated with PMA (red curve) and without PMA (blue curve) seem linear and nearly identical to one another. Slight CT value differences were shown between the live cells treated with PMA and without PMA (Figure 1A), suggesting that PMA treatment had little effect on amplification of DNA of the live cells in the qPCR. But a 15-CT value difference (32,000 fold) was shown between the dead cells treated with PMA and without PMA, demonstrating that PMA treatment efficiently suppressed DNA amplification from the dead cells (Figure 1B).
Detection of live cells from live and dead cell mixtures in qPCR
Two sets of live cell dilutions (8 x 100 - 8 x 10⁶ CFU) were treated with PMA or without PMA to detect live cells from live/dead cell mixtures. The qPCR results (Figure 2A) demonstrated a parallel inverse progressive trend of CT values as related to the numbers of treated live cells (purple bars) to the untreated samples (blue bars). The treated live cells yielded a somewhat higher CT values than those of untreated live cells. A similar inverse progressive trend in CT values was observed with the real number of live cells in the live/dead cell mixtures treated with PMA (green bars) as well in Figure 2B. In addition, this downward trend of CT values was observed with the number of live cells in the mixtures despite the presence of 106 dead cells. These results showed that the CT values of the live/dead cell mixtures represented the DNA from the live cells alone, whereas the DNA amplification from the dead cells was efficiently suppressed by PMA treatment. But, the CT values of live/dead cell mixtures treated with PMA were fluctuated and failed to reflected the live cell numbers in the mixtures in Figure 2B (yellow bars).
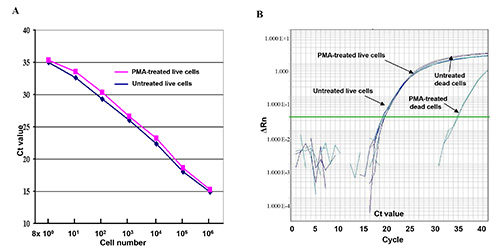
Figure 1. Live and dead cells treated with PMA or without PMA in qPCR assay. (A) A serial of 10-fold-diluted live E. coli O157:H7 cell dilutions (8 x 100 - 8 x 10⁶ CFU) were treated with PMA or without PMA. The CT values represent the average CT values of the triplicates in the qPCR assay. (B) Comparison of DNA amplification of live cells and dead cells treated with PMA and without PMA in the q comparison qPCR assay. ΔRn refers to fluorescence intensity change. Click here to view larger image.
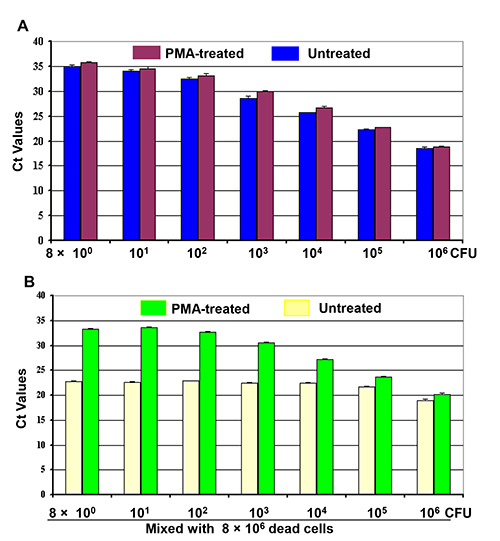
Figure 2. Differentiation of live cells from live/dead cell mixtures by PMA-qPCR. Four sets of 10-fold dilutions of cell cultures (8 x 100 - 8 x 10⁶ CFU) were made as indicated. (A) First set of cell dilution was treated with PMA while the second cell dilution was or untreated before DNA extraction. (B) 8 x 10⁶ dead cells were mixed with the third and fourth sets of cell dilutions to make two sets of live/dead cell mixtures as indicated. One set of the cell mixtures was treated with PMA and the other set was treated without PMA before DNA extraction. Each bar represents the average CT values of a triplicate experiment ± SD.
| Organism | Serotype | No. of strains tested |
| E. coli | 2006 spinach O157:H7 outbreak isolates | 186 |
| 2006 Taco Bell O157:H7 isolates | 58 | |
| 2006 Taco John O157:H7 isolates | 11 | |
| DMB strain collections from other O157:H7 outbreaks | 112 | |
| O104:H4 | 3 | |
| O26 | 18 | |
| O103 | 13 | |
| O111 | 24 | |
| O121 | 2 | |
| O45 | 5 | |
| O145 | 9 | |
| O113 | 2 | |
| O91 | 1 | |
| O55 | 9 | |
| Other | 19 | |
| Salmonella | Typhi | 1 |
| Newport | 2 | |
| Shigella dysenteriae | 6 | 2 |
| Shigella sonnei | Unknown | 2 |
| Shigella flexneri | 4 | 1 |
| Shigella boydii | 1 | 1 |
| Total | 481 | |
Table 1. Strains used for validation in real-time PCR assay for identification of E. coli O157:H7.
Discussion
A primary aim of the study involves use of an ORF Z3276, a unique to E. coli O157:H7, as a sole biomarker for qPCR assay. At present, most qPCR assays are targeting virulence genes, such as stx1, stx2, and eaeA1,2,5,6 or shared phenotypic genes, such as uidA3,4, rfbE and fliC genes8,9. Occasionally, a species or strain cannot be definitely identified by the virulence gene(s), such as stx1and stx2 genes, as those genes are present in different species or strains16 as well. Using rfbE and fliC for target genes, both genes are needed to be used for complete identification17. Using ORF Z3276 as a biomarker, this qPCR assay has been demonstrated to be sensitive and specific assay (Table 1). This assay has been subjected to stringent inclusivity and exclusivity tests, including O157:H7 strains (n = 367), over 100 non-O157 strains, and other pathogenic species, such as Salmonella and Shigella. All O157:H7 strains examined were positively detected, and no cross-reactivity was found from the non-O157 strains (Table 1), indicating that ORF Z3276 is a unique and strong biomarker for detection of E. coli O157:H7.
The other objective of the study is to selectively detect live cells from dead cells by PMA treatment before DNA extraction. PMA can penetrate into the dead cells with compromised membrane and bind to DNA, and thus inhibits the DNA amplification of dead cells in PCR13. We have modified the PMA-treatment procedure, and adapted it to a 96-well plate format for the procedure. The right intensity of light exposure is essential to obtain the optimal cross-linking effect. Previously, microtubes have been used in this step13-15. However, separate microtubes are difficult to handle in light exposure step, and these tubes are not absolutely transparent to obtain the best cross-liking. Using a 96-well plate, we improved the efficiency of PMA-treatment. These changes may impact the assay in several ways: they make it easier to obtain a thorough and uniform cross-linking effect, especially with numerous samples; the treated samples can be moved from one plate to another to make it possible for detection of large number of samples; and they provide this PMA-qPCR assay with automation potential for the whole process. The limitation of this PMA-qPCR assay is that PMA treatment increases the PCR assay cost somewhat and slightly reduced the sensitivity of PCR assay.
Disclosures
The authors have nothing to disclose.
Acknowledgements
We thank the U.S. Department of Homeland Security for providing part of the funding.
Materials
| Name | Company | Catalog Number | Comments |
|---|---|---|---|
| AB 7900HT Fast Real-time PCR system | ABI | ||
| 2x Universal master mix | ABI | 4304437 | |
| PrepMan Ultra | ABI | 4318930 | |
| Primer Express | ABI | ||
| Probes | ABI | Top of Form | |
| PMA | Biodium | 40013 | |
| Puregen cell and tissue kit | Qiagene | ||
| DU530 spectrophotometer | Beckman | ||
| Spectrophotometer | NanoDrop Technology | ND-1000 | |
| 650 W Halogen light source | Britek | H8061S | |
| Otptical Adhesive film | ABI | 4311971 | |
| Optical 96-well reaction plate | ABI | 4316813 |
References
- Barletta, F., et al. Validation of five-colony pool analysis using multiplex real-time PCR for detection of diarrheagenic Escherichia coli. J. Clin. Microbiol. 47, 1915-1917 (2009).
- Gannon, V. P., King, R. K., Kim, J. Y., Thomas, E. J. Rapid and sensitive method for detection of Shiga-like toxin-producing Escherichia coli in ground beef using the polymerase chain reaction. Appl. Environ. Microbiol. 58, 3809-3815 (1992).
- Cebula, T. A., Payne, W. L., Feng, P. Simultaneous identification of strains of Escherichia coli serotype O157:H7 and their Shiga-like toxin type by mismatch amplification mutation assay-multiplex PCR. J. Clin. Microbiol. 33, 248-250 (1995).
- Li, Y., Mustapha, A. Simultaneous detection of Escherichia coli O157:H7, Salmonella, and Shigella in apple cider and produce by a multiplex PCR. J. Food. Prot. 67, 27-33 (2004).
- Schmidt, H., et al. Differentiation in virulence patterns of Escherichia coli possessing eae genes. Med. Microbiol. Immunol. 183, 23-31 (1994).
- Fratamico, P. M., Sackitey, S. K., Wiedmann, M., Deng, M. Y. Detection of Escherichia coli O157:H7 by multiple PCR. J. Clin. Microbiol. 33, 2188-2191 (1995).
- Desmarchelier, P. M., Bilge, S. S., Fegan, N., Mills, L., Vary, J. C., Tarr, P. I. A PCR specific for Escherichia coli O157 based on the rfb locus encoding O157 lipopolysaccharide. J. Clin. Microbiol. 36, 1801-1804 (1998).
- Fields, P. I., Blom, K., Hughes, H. J., Helsel, L. O., Feng, P., Swaminathan, B. Molecular characterization of the gene encoding H antigen in Escherichia coli and development of a PCR-restriction fragment length polymorphism test for identification of E. coli O157:H7 and O157:NM. J. Clin. Microbiol. 35, 1066-1070 (1997).
- Fricker, M., Messelhäußer, U., Bushch, U., Scherer, S., Ehling-Schulz, M. Diagnostic real-time PCR assays for detection of emetic Bacillus cereus strains in foods and recent food-borne outbreaks. Appl. Environ. Microbiol. 73, 1892-1898 (2007).
- Li, B., Chen, J. Q. Real-time PCR methodology for selective detection of viable Escherichia coli O157:H7 cells by targeting Z3276 as a genetic marker. Appl Environ. Microbiol. 78, 5297-5304 (2012).
- Perna, N. T., et al. Genome sequence of enterohaemorrhagic Escherichia coli O157:H7. Nature. 409, 529-533 (2001).
- Wang, S., Levin, R. E. Discrimination of viable Vibrio vulnificus cells from dead cells in real-time PCR. J. Microbiol. Methods. 64, 1-8 (2006).
- Nocker, A., Cheung, C. Y., Camper, A. K. Comparison of propidium monoazide with ethidium monoazide for differentiation of live vs. dead bacteria by selective removal of DNA from dead cells. J. Microbiol. Methods. 67, 310-320 (2006).
- Nocker, A., Sossa-Fernandez, P., Burr, M. D., Camper, A. K. Use of propidium monoazide for live/dead distinction in microbial ecology. Appl. Environ. Microbiol. 73, 5111-5117 (2007).
- Cawthorn, D. M., Witthuhn, R. C. Selective PCR detection of viable Enterobacter sakazakii cells utilizing propidium monoazide or ethidium bromide monoazide. J. Appl. Microbiol. 105, 1178-1185 (2008).
- Chassagne, L., Pradel, N., Robin, F., Livrelli, V., Bonnet, R., Delmas, J. Detection of stx1, stx2, and eae genes of enterohemorrhagic Escherichia coli using SYBR Green in a real-time polymerase chain reaction. Diagn. Microbiol. Infect. Dis. 64, 98-101 (2009).
- Liu, Y., Gilchrist, A., Zhang, J., Li, X. F. Detection of viable but nonculturable Escherichia coli O157:H7 bacteria in drinking water and river water. Appl. Environ. Microbiol. 74, 1502-1507 (2008).
Reprints and Permissions
