Here we describe a protocol that couples two proteomic techniques, namely 2-dimensional Electrophoresis (2DE) and Mass Spectrometry (MS), to identify differentially expressed/post-translational modified proteins among two or more groups of primary samples. This approach, together with functional experiments, allows the identification and characterization of prognostic markers/therapeutic targets.
A subscription to JoVE is required to view this content. Sign in or start your free trial.
Method Article
From a 2DE-Gel Spot to Protein Function: Lesson Learned From HS1 in Chronic Lymphocytic Leukemia
In This Article
Summary
Abstract
The identification of molecules involved in tumor initiation and progression is fundamental for understanding disease’s biology and, as a consequence, for the clinical management of patients. In the present work we will describe an optimized proteomic approach for the identification of molecules involved in the progression of Chronic Lymphocytic Leukemia (CLL). In detail, leukemic cell lysates are resolved by 2-dimensional Electrophoresis (2DE) and visualized as “spots” on the 2DE gels. Comparative analysis of proteomic maps allows the identification of differentially expressed proteins (in terms of abundance and post-translational modifications) that are picked, isolated and identified by Mass Spectrometry (MS). The biological function of the identified candidates can be tested by different assays (i.e. migration, adhesion and F-actin polymerization), that we have optimized for primary leukemic cells.
Introduction
Chronic Lymphocytic Leukemia (CLL), the most common adult leukemia in the Western countries, derives from the accumulation of monoclonal neoplastic CD5+ B lymphocytes and is clinically very heterogeneous. It may be present as a pre-leukemic form, defined as monoclonal B-cell lymphocytosis (MBL) 1,2,3. In other cases the disease can appear either with an indolent clinical course, that can remain stable for years before needing treatment, or as a progressive chemorefractory disease with dismal prognosis despite therapy. Finally, it may progress into a frequently lethal high grade lymphoma (Richter’s Syndrome-RS) 2,3,4. Patients are usually classified in two main subsets: good and bad prognosis, based on a set of prognostic factors that provides complementary information on predictors of disease outcome and survival. Clinical heterogeneity likely reflects biological heterogeneity. A number of genetic, microenvironmental and cellular factors have been shown to concur to disease pathogenesis though no unifying mechanisms have been found 5. In detail, several studies have demonstrated that differences in the clinical course of the disease can be partially explained by the presence (or the absence) of some biological markers that have a prognostic value 6,7,8. These data demonstrated that a better understanding of the disease biology could provide additional hints for the clinical management of the pathology, by the identification of both prognostic markers and therapeutic targets.
The goal of the present paper is to show how a combination of different proteomic techniques can be used for the identification of proteins involved in CLL onset and progression. Our approach demonstrates that it is possible to join together basic proteomic and clinical data5.
In the present workflow, primary leukemic cells from selected patients (good vs bad prognosis) are isolated and cell lysates are then used to obtain proteomic maps. 2DE allows the characterization of the proteomic profile of a cell population, including post-translational modifications, thus giving indirect information on the biological activity of each protein. Whole cell lysates are resolved by a first dimension run based on the isoelectric point, followed by a second dimension run on a polyacrylamide gel that resolves proteins based on their molecular weight. Comparative analysis of proteomic maps allows the identification of differentially expressed proteins (both in terms of abundance and post-translational modifications) as spots on the gel that can be cut and analyzed by Mass Spectrometry. The role of each candidate can be then exploited by different assays.
This approach, restricted to CLL in the current manuscript, can be easily expanded to other diseases/samples, thus providing information about the proteomic/biological differences between two groups (i.e. pathologic vs normal, stimulated vs unstimulated, wild-type vs knockdown).
Access restricted. Please log in or start a trial to view this content.
Protocol
NOTE: All tissue samples were obtained with approval of the institutional review board of San Raffaele Hospital (Milan, Italy).
1. Human Tissue Samples and Cell Purification (Figure 1)
NOTE: Leukemic lymphocytes were obtained from the Peripheral Blood (PB) of CLL patients, diagnosed according to Mulligan et al. 9
1.1) Leukemic Cell Separation from PB
- Collect PB in vacutainer blood collection tubes with Sodium Heparin.
- Transfer blood into a 15 ml tube and add human B-cell enrichment cocktail at 50 μL/mL of whole blood. Mix well and incubate 20 min at room temperature.
- Dilute sample with an equal volume of PBS + 2% FBS, mix gently and carefully overlay blood over the Ficoll, making sure not to break the interface. Use at least 1 part of Ficoll to 2 parts of the diluted sample (i.e. 4 ml Ficoll + 10 ml blood in a 15 ml tube).
- Centrifuge at 400 x g, at room temperature (20 °C) for 20 min with no brake. Mononuclear cells will be at the interface.
- Carefully aspirate the interface to recover the cells and place into a new tube. Wash cells once with PBS and centrifuge at 300 x g, 4 °C in the dark for 5 min. The pellet will be at the bottom.
- Discard the supernatant. Resuspend the pellet in the remaining supernatant by flicking the tube back and forth with fingers. Dilute the pellet with 10 ml complete RPMI medium (RPMI 1640 supplemented with 10% Fetal Calf Serum and 15 mg/ml gentamicin) and count cells using the Trypan Blue exclusion method.
1.2) Purity Evaluation
NOTE: Purity of all preparations needs to be always above 99%.
- Incubate 100 μl of purified cell suspension with the following antibodies (commercially available; see Table of Materials): CD3FITC (5 µl/test), CD14PE (5 µl/test), CD19ECD (6 µl/test), CD16-CD56PC5 (2 µl/test), CD5PC7 (4 µl/test), for 20 min at 4 °C in a FACS tube.
- Wash the sample with 4 ml of PBS (centrifuge for 5 min at 300 x g) and check the purity by flow cytometry.Check in the plot the % of CLL cells (> 99%) which co-express CD19 and CD5 on their surface as shown in Figure 1(6). Ensure that the preparations are virtually devoid of NK, T lymphocytes and monocytes by checking the % of CD3, CD14 and CD16-56 in the plot, which should be near zero.
1.3) Samples Storage
- For proteomic studies, collect 25 x 106 cells in a 1.5 ml tube, centrifuge cells at 300 x g for 10 min, discard the supernatant and lyophilize pellets for 4 hr. Keep at -80 °C until use.
- For validation assays, resuspend cells in complete RPMI (quantity depends on the further assay that is chosen) and proceed with Step 4.
2. Two-dimensional Electrophoresis (2-DE) (Figure 2)
2.1) Isoelectrofocusing (IEF)
- Solubilize CLL cells pellets with a final volume of 380 μl 2-DE buffer (344 μl of a RBthio solution (9 M Urea, 10 mM Tris, 4% CHAPS), 30 μl of 65mM DTT, 6 μl of 2% IPG buffer ampholine pH 4-7).
- Apply protein samples (1 mg) to 18 IPG strips (pH 4-7) and perform IEF following standard protocol as described by Conti et al. 10
- Equilibrate strips in 2 ml of Equilibration Buffer (EB: 50 mM pH 8.8 Tris-HCl buffer containing 6 M urea, 30% glycerol, 2% SDS), supplemented with 2% of fresh DTT, for 15 minutes at RT. Discard EB+DTT and add 2 ml of EB supplemented with 2.5% Iodoacetamide. Incubate for 15 min at RT on a rocking platform.
2.2) SDS-PAGE
- Dry the strips on a paper without touching the gel to remove the excess of EB. Load each strip on top of a 9-16% gradient SDS-PAGE gel. Add a small volume of SDS-Electrophoresis Buffer (Tris 25 mM, Glycine 192 mM, SDS 0,1% w/v) on top of the gel to facilitate loading of the strip.
- Seal the gel by adding ~5 ml of agar solution (0.8%) to prevent floating of the strip, then assemble the electrophoretic unit and fill with SDS-Electrophoresis buffer. Perform the run at 60 mA/gel for 4 hr at 4 °C.
- Remove the gel from the electrophoretic unit and place it in the proper staining box.
2.3) Silver Stain for Preparative Gel
| FIXER | 50% Methanol 12% Acetic Acid 0,05% Formalin | 2 hr (or overnight)* |
| WASH BUFFER | 35% Ehanol | 20 min (repeat the step three times) |
| SENSITIZING | 0,02% Sodium Thiosulfate | 2 min |
| WASH | H2O | 5 min (repeat the step three times) |
| SILVER NITRATE | 0,2% Silver Nitrate 0,076% Formalin | 20 min |
| WASH | H2O | 1 min (repeat the step twice) |
| DEVELOPER | 6% Sodium Carbonate 0,0004% Sodium Thiosulfate 0,05% formalin | Until the staining is sufficient |
| STOP | 50% Methanol | 30 min |
| * 2 hr is the minimum time required for protein fixation |
Table 1.
NOTE: Protein spots can be visualized by staining gels with MS compatible silver stain11. All the solutions needed for silver staining are listed in Table 1.
- Prepare about 200 ml of each solution/gel and proceed as indicated in Table 1. Carefully add each solution to the staining box containing the gel. Perform all incubations on a rocking platform.
- After the staining, remove the Stop Solution and leave the gel in a solution of 1% Acetic Acid until acquisition.
2.4) Gel Acquisition and Analysis
- Acquire images at high resolution using a densitometer within 3 days from the staining.
- Analyze 2-D protein patterns by using software for 2-DE gels.
NOTE: The software allows a fast and reliable image comparison.- Create a project by choosing “create a new project” from the contextual menu. Create a folder and import the gels by choosing “import gel images” with .tif, .png. or .gel extension.
- Once the gels are imported and added to the workspace, perform an automated spot detection by selecting the gels for spot detection and choosing “edit > spot> detect” in the menu.
- Next, perform a background subtraction by selecting from the menu “subtract background”. Note: After that it is possible to compare multiple gels and to detect differences or similarities by quantitative and/or qualitative analysis.
3. Protein Identification by MALDI-TOF MS analysis (Figure 3)
3.1) Protein Digestion
- Rinse the gel with water and excise spots of interest from gels either by manual (cutting with a clean scalpel) or by automated excision.
- Wash gel particles with water (100-150 μl), spin down (30 sec at 400 x g) and remove the liquid.
- Add an equal volume (depending on the gel volume) of CH3CN to the gel pieces and wait for 10-15 min until the gel pieces shrink. Dry the gel particles in a vacuum centrifuge.
- Add 75-100 µl of 10 mM Dithioerythritol diluted in 50 mM NH4HCO3 and incubate for 30 min at 56 °C (Reduction Step). Shrink again the gel pieces with CH3CN as described in Step 3.1.3.
- Proceed with alkylation by adding 75-100 µl of a solution 55 mM Iodoacetamide diluted in 50 mM NH4HCO3 and incubate for 20 min at room temperature in the dark.
- Shrink the gel pieces once more with CH3CN using enough volume to cover the gel pieces as described in Step 3.1.3. Dry in a vacuum centrifuge.
- Rehydrate the particles in a buffer containing 25 mM NH4HCO3, 5 mM CaCl2,and 12,5 ng/μl of trypsin at 4 °C for 20 min. Use enough volume of buffer to cover the gel pieces. Remove the un-absorbed supernatant from the gel pieces and add 25 mM NH4HCO3, 5 mM CaCl2 without trypsin to cover the gel.
- Leave samples at 37 °C at least 3 hr (the minimum time required for peptide digestion) to overnight.
3.2) Mass Spectrometry Analysis (Dried droplet technique)
- Spot 1 μl aliquot of each sample onto a stainless steel MALDI plate and mix with 1 µl of α-cyano-4-hydroxycinnamic acid as matrix, prepared in 50% CH3CN and 0.1% TFA.
- Obtain mass spectra on a MALDI–TOF mass spectrometer. Accumulate about 200 spectra per spot, adjusting laser intensity to prevent signal saturation or to increase the signal. Process spectra via Data Explorer software as described below:
- Import the .dat file and perform the baseline correction by choosing “process > baseline correction”. Calibrate masses using the trypsin autolysis products and matrix peaks by choosing “process > mass calibration > manual calibration; select peaks close to m/z 855.1 and 2163.1 by left dragging and select the corresponding reference masses, then click “plot” and “apply calibration” in the manual calibration window.
- Adjust the threshold for peak detection (“peak >peak detection”), duplicate the active trace (“display >duplicate active trace”), select the new trace and perform the deisotoping (“peak >deisotoping”). Using the macro “getpeaklist”, generate a list of masses to be used for the identification. If required, manually remove noise signals picked as peaks to clean the list and get a better identification.
- Identify proteins by searching a comprehensive non-redundant protein database using ProFound and Mascot as search engines12.
- Use the following parameters in all searches: one missed cleavage per peptide, methionine oxidation as variable modification, cysteine carbamidomethylation as fixed modification and an initial mass tolerance of 50 ppm.
4. Cytoskeletal Activity Assays (Figure 4)
NOTE: Resuspend cells purified in Step 1 in complete RPMI (106 cells/200 μl).
4.1) Migration Assay. This test allows quantification of the migratory capacity of the analyzed cells (lymphocytes ). Use a transwell chamber of 6.5 mm diameter and 5.0 μm pore size and perform the assay in triplicate. Optimize pore size and migration time (Step 4.1.3) in the case of different cell types.
- Prepare the lower chamber by adding 600 μl of complete RPMI with or without the specific stimuli (i.e. SDF-1) to measure the induced and the spontaneous migration respectively.
- Put the upper chamber on it and let the system equilibrate for 30 minutes at 37 °C in the incubator.
- Seed 106 cells/200 μl in the upper chamber (total cell number) and incubate the plate for 4 hr at 37 °C in the incubator.
- Remove the upper chamber, collect the media in the lower chamber and wash the lower chamber once with 1 ml PBS. Collect the PBS in the tube.
- Centrifuge 5 minutes at 300 x g, discard the supernatant and resuspend in 500 μl PBS.
- By flow cytometry, count the number of migrated cells after 1 min of acquisition. In case of an isolated cell population it is not necessary to add any surface antibody. Check the number of cells in a bi-dimensional dot plot considering the side scatters of the cells and the number of events visualized in 1 min, which is the number to use for calculation.
- Calculate the Migration Index (MI) as:

4.2) Adhesion assay. This assay allows measuring the adhesion capacity of the cells. Perform the assay in triplicate.
- Pre-coat 96-wells plate (flat-bottom) with 50 μl/well of either 2% BSA-PBS (as background) or 1 μg ICAM-1 diluted in PBS, overnight at 4 °C.
- Wash the plate twice with PBS and block non-specific sites by adding 2% BSA-PBS (100 μl/well) for 1 hr at 37 °C.
- In the meantime resuspend cells at 5 x 10⁶/ml in complete RPMI, label them with 1 mM CMFDA-green cell tracker and incubate 30 min at 37 °C.
- Add 1 x 10⁶ cells/well to the pre-coated wells after discarding the blocking solution (Step 4.2.2) and incubate 1 hr at 37 °C.
- Quantify adhesion by using an ELISA reader (Excitation filter: 485 nM, Emission filter: 535 nM). Perform a first measurement on the total input (INPUT).
- Wash the plate gently with 2% BSA-PBS (200 μl/well) 4 times (x). Perform a reading of the plate after each washing step (Adhesionx).
- After background subtraction for each measurement, calculate specific adhesion (ADHESION):

4.3) Polymerization assay. This is a colorimetric assay that quantifies F-actin polymerization. Perform the assay in triplicate.
- Resuspend 1x10^6 cells in 100 μl of pre-warmed complete RPMI and add the specific stimulus (i.e. α-IgM 20 μg/ml ) for 10 min.
- Stop the reaction with 400 μl of 4% paraformaldehyde and fix cells for 10 min at RT.
- Wash 3 times with PBS (centrifuge at 300 x g for 5 min, 4 °C).
- Discard the supernatant and permeabilize cells with PBS-saponine 0.2% (200 μl) on ice for 2 min.
- Wash 3 times with PBS-saponine 0.1% (centrifuge at 100 x g for 5 min, 4 °C), discard the supernatant and resuspend in 100 μl PBS-saponine 0.1%.
- Stain with Phalloidin-Alexafluor 488 (3 μg/ml) for 30 min at room temperature in the dark.
- Wash 3 times with PBS-0.1% saponine. Discard the supernatant and resuspend in 300 μl PBS.
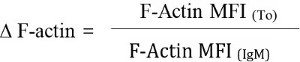
- Quantify the amount of F-actin by flow cytometry, calculating the Mean Florescence Intensity (MFI) of the Phalloidin. Analyze the generated data in a single dimension plot in order to produce a histogram based on the fluorescent intensity, the MFI value is shown in the graph report.
- Measure F-actin polymerization (∆ F-actin) as:
Access restricted. Please log in or start a trial to view this content.
Results
We isolated primary leukemic B cells form PB of CLL patients and we analyzed proteomic maps. Samples (n = 104) were grouped in two main subsets based on the clinical features of each patient (bad prognosis vs good prognosis) and comparative analysis of 2DE gels was performed.
The analysis allowed identification of spots differentially expressed between the two subsets (in term of presence/absence or shift on the gel, implying changes in post-translational modifications; n ≈ 16). We ex...
Access restricted. Please log in or start a trial to view this content.
Discussion
The aim of this manuscript is to describe an optimized protocol for the identification of molecules involved in the pathogenesis of CLL, even if this approach can be extended to other diseases and/or other sample types16-18. By comparing the proteomic profiles of 2 subsets of CLL patients, good vs bad prognosis19, we demonstrated that they differ in the phosphorylation status of HS1 and that its activation affects the migration and adhesion capacity of leukemic cells.
Access restricted. Please log in or start a trial to view this content.
Disclosures
The authors have nothing to disclose.
Acknowledgements
We thank the Lymphoid Malignancies Unit, Elisa ten Hacken, Lydia Scarfò, Massimo Alessio, Antonio Conti, Angela Bachi, and Angela Cattaneo.
This project was supported by: Associazione Italiana per la Ricerca sul Cancro AIRC (Investigator Grant and Special Program Molecular Clinical Oncology – 5 per mille #9965)
C.S. and B.A designed the study, performed the experiments, analyzed the data and wrote the manuscript. M.T.S.B., U.R., F.B. P.R. assisted in writing the manuscript. P.G. and F.C.C. designed the study provided patients’ samples and clinical data.
Access restricted. Please log in or start a trial to view this content.
Materials
| Name | Company | Catalog Number | Comments |
|---|---|---|---|
| Acetonitril | MERCK | 61830025001730 | |
| Ammonium Bicarbonate | SIGMA | A6141-500G | |
| 1,4-Dithioerythritol | SIGMA | D9680-5G | |
| Iodoacetamide | SIGMA | I6125-25G | |
| Calcium chloride dihydrate | SIGMA | 223506-25G | |
| Trypsin, Sequencing Grade | ROCHE | 11418475001 | |
| α-cyano-4-hydroxycinnamic acid | SIGMA | C2020-10G | |
| Trifluoroacetic acid | SIGMA | T6580 | |
| ZipTipµ-C18 | MILLIPORE | ZTC18M096 | |
| RosetteSep Human B Cell Enrichment Cocktail | STEMCELL | 15064 | |
| PBS | EUROCLONE | ECB4004L | |
| FBS | DOMINIQUE DUTSCHER | S1810 | |
| Lymphoprep | SENTINEL DIAGNOSTICS | 1114547 | |
| Trypan Blue | SIGMA | T8154 | |
| CD19 | BECKMAN COULTER | 082A07770 | ECD |
| CD5 | BECKMAN COULTER | 082A07754 | PC5 |
| CD3 | BECKMAN COULTER | 082A07746 | FITC |
| CD14 | BD | 345785 | PE |
| CD16 | BECKMAN COULTER | 082A07767 | PC5 |
| CD56 | BECKMAN COULTER | 082A07789 | PC5 |
| Ettan IPGphor 3 Isoelectric Focusing Unit | GE-Healthcare | 11-0033-64 | |
| Urea | SIGMA | U6504 | |
| Tris-Hcl Buffer | BIO-RAD | 161-0799 | |
| CHAPS | SIGMA | C2020-10G | |
| DTT | SIGMA | D9163-5G | |
| IPGstrips | GE-Healthcare | 17-1233-01 | Linear pH 4-7 18cm |
| IPGbuffer | GE-Healthcare | 17-6000-86 | pH 4-7 |
| Glycerol | SIGMA | G6279 | |
| PROTEAN II XL Cell | BIO-RAD | 165-3188 | |
| SDS | INVITROGEN | NP0001 | |
| Acrilamide | BIO-RAD | 161-0156 | |
| Agarosio | INVITROGEN | 16500 | |
| Methanol | SIGMA | 32213 | |
| Acetic Acid | VWR | 631000 | |
| Formalin | BIO-OPTICAL | 05-K01009 | |
| Ethanol | VWR | 9832500 | |
| Sodium Thiosulfate | FLUKA | 72049 | |
| Silver Nitrate | FLUKA | 85228 | |
| Molecular Dynamics Personal SI Laser Densitometer | Amersham Biosciences | ||
| ImageMaster 2D Platinum 5.0 | Amersham Biosciences | ||
| Sodium Carbonate | MERCK | A0250292 | |
| MALDI-TOF Voyager-DE STR | Applied Biosystems | ||
| Data Explorer software (version 3.2) | Applied Biosystems | ||
| transwell chambre 6.6 mm diameter | CORNING | 3421 | |
| RPMI | EUROCLONE | ECB2000L | WITH L-GLUTAMINE |
| Gentamicin | SIGMA | G1397 | |
| SDF-1 | PREPROTECH | 300-28A | |
| Flat-bottom 96-well plate | BECTON DICKINSON | 353072 | |
| BSA | SANTA CRUZ | 9048-46-8 | |
| ICAM-1 | R&D Systems | 720-IC | |
| CMFDA | Life Thechnology | C7025 | Green |
| IgM | SOUTHERNBIOTECH | 2020-02 | |
| Paraformaldehyde | SIGMA | P6148 | |
| Saponine | SIGMA | S-7900 | |
| Phalloidin | Life Thechnology | A12379 | Alexa fluor 488 |
References
- Caligaris-Cappio, F., Ghia, P. Novel insights in chronic lymphocytic leukemia: are we getting closer to understanding the pathogenesis of the disease. J Clin Oncol. 26, 4497-4503 (2008).
- Rawstron, A. C., et al. Monoclonal B-cell lymphocytosis and chronic lymphocytic leukemia. N Engl J Med. 359, 575-583 (2008).
- Dagklis, A., Fazi, C., Scarfo, L., Apollonio, B., Ghia, P. Monoclonal B lymphocytosis in the general population. Leuk Lymphoma. 50, 490-492 (2009).
- Fazi, C., et al. General population low-count CLL-like MBL persists over time without clinical progression, although carrying the same cytogenetic abnormalities of CLL. Blood. 118, 6618-6625 (2011).
- Caligaris-Cappio, F., Bertilaccio, M. T., Scielzo, C. How the microenvironment wires the natural history of chronic lymphocytic leukemia. Seminars in cancer biology. , (2013).
- Damle, R. N., et al. Ig V gene mutation status and CD38 expression as novel prognostic indicators in chronic lymphocytic leukemia. Blood. 94, 1840-1847 (1999).
- Lanham, S., et al. Differential signaling via surface IgM is associated with VH gene mutational status and CD38 expression in chronic lymphocytic leukemia. Blood. 101, 1087-1093 (2003).
- Wiestner, A., et al. ZAP-70 expression identifies a chronic lymphocytic leukemia subtype with unmutated immunoglobulin genes, inferior clinical outcome, and distinct gene expression profile. Blood. 101, 4944-4951 (2003).
- Mulligan, C. S., Thomas, M. E., Mulligan, S. P. Lymphocytes, B lymphocytes, and clonal CLL cells: observations on the impact of the new diagnostic criteria in the 2008 Guidelines for Chronic Lymphocytic Leukemia (CLL). Blood. 113, 6496-6497 (2009).
- Conti, A., et al. Proteome study of human cerebrospinal fluid following traumatic brain injury indicates fibrin(ogen) degradation products as trauma-associated markers. J Neurotrauma. 21, 854-863 (2004).
- Mortz, E., Krogh, T. N., Vorum, H., Gorg, A. Improved silver staining protocols for high sensitivity protein identification using matrix-assisted laser desorption/ionization-time of flight analysis. Proteomics. 1, 1359-1363 (2001).
- Zhang, W., Chait, B. T. ProFound: an expert system for protein identification using mass spectrometric peptide mapping information. Anal Chem. 72, 2482-2489 (2000).
- Scielzo, C., et al. HS1 protein is differentially expressed in chronic lymphocytic leukemia patient subsets with good or poor prognoses. J Clin Invest. 115, 1644-1650 (2005).
- Muzio, M., et al. HS1 complexes with cytoskeleton adapters in normal and malignant chronic lymphocytic leukemia B cells. Leukemia. 21 (9), 2067-2070 (2007).
- Scielzo, C., et al. HS1 has a central role in the trafficking and homing of leukemic B cells. Blood. 116, 3537-3546 (2010).
- Kashuba, E., et al. Proteomic analysis of B-cell receptor signaling in chronic lymphocytic leukaemia reveals a possible role for kininogen. J Proteomics. 91, 478-485 (2013).
- Dhamoon, A. S., Kohn, E. C., Azad, N. S. The ongoing evolution of proteomics in malignancy. Drug Discov Today. 12, 700-708 (2007).
- Ummanni, R., et al. Identification of clinically relevant protein targets in prostate cancer with 2D-DIGE coupled mass spectrometry and systems biology network platform. PLoS One. 6, (2011).
Access restricted. Please log in or start a trial to view this content.
Reprints and Permissions
