Mesenchymal stem cells (MSCs) have a differentiation potential towards osteoblastic lineage when they are stimulated with soluble factors or specific biomaterials. This work presents a novel option for the delivery of MSCs from human amniotic membrane (AM-hMSCs) that employs the bovine bone matrix Nukbone (NKB) as a scaffold.
Method Article
Isolation of Human Mesenchymal Stem Cells and their Cultivation on the Porous Bone Matrix
In This Article
Summary
Abstract
Mesenchymal stem cells (MSCs) have a differentiation potential towards osteoblastic lineage when they are stimulated with soluble factors or specific biomaterials. This work presents a novel option for the delivery of MSCs from human amniotic membrane (AM-hMSCs) that employs bovine bone matrix Nukbone (NKB) as a scaffold. Thus, the application of MSCs in repair and tissue regeneration processes depends principally on the efficient implementation of the techniques for placing these cells in a host tissue. For this reason, the design of biomaterials and cellular scaffolds has gained importance in recent years because the topographical characteristics of the selected scaffold must ensure adhesion, proliferation and differentiation into the desired cell lineage in the microenvironment of the injured tissue. This option for the delivery of MSCs from human amniotic membrane (AM-hMSCs) employs bovine bone matrix as a cellular scaffold and is an efficient culture technique because the cells respond to the topographic characteristics of the bovine bone matrix Nukbone (NKB), i.e., spreading on the surface, macroporous covering and colonizing the depth of the biomaterial, after the cell isolation process. We present the procedure for isolating and culturing MSCs on a bovine matrix.
Introduction
There pair and regeneration of tissuesis one of themain objectives of medical science because a lesion in a tissue ororgan can be incapacitating and, in some cases, lethal. In context, the health workers and researchers are constantly searching techniques, methods and tools to provide new therapeutic alternativesto promote there pair-regeneration process of damaged tissue. Therefore, biomedical sciences have focused on the study of mesenchymal stem cells (MSCs), especially adult stem cells, because this cell lineage represents an ideal model to study the tissue regeneration process, due to its potential to differentiate to ectodermal, mesodermal, and endodermal cell lineages However, to make therapy with MSCs a reality, the characterization of thetherapeutic potential of MSCs must be accompanied by the implementation of new cell culture techniques using biomaterials and cellular scaffolds that guarantee the desired behavior of the MSCs in the host tissue.
The principal challenge to overcome in the implementation of a culture with MSCs in bone regeneration is to secure cell adhesion on the selected biomaterial, which generally presents a porous structure with adistribution of pores ranging from micrometers to millimeters have been employed but frequently require sophisticated reagents, equipment, and procedures that alter the behavior of cells. These procedures are suitable for in vitro estimation, but not for the extrapolation and implementation in complex open systems, such as human or in vivo assays. Techniques that focus on ensuring cell adhesion to random topographies, such as porous bone materials, have been studied by the adhesion of the material to the bottom of culture wells and employed collagens and agarose polymers. For these methods, the cells that were seeded on the surface were retained in the pores and on the top surface. However, this aspect cannot be ensured in an in vivo system, in which the body fluids surrounding the biomaterial could drag the cells from the desired site on porous scaffolds is the use of ultrasonic stimulation, which requires sophisticated equipment but promotes the expression of osteoblastic markers in in vitro assays5. The use of continuous cultures requires bioreactors, which guarantee a homogeneous distribution of nutrients in the culture medium; however, a significant percentage of the cultured cells is lost when replacing the culture medium due to the flow rate that is used in this technique and the medium adhering to the walls of the equipment. These issues increase the cellular mass that is necessary for this type of culture and the time for obtaining a sufficient number of cells7. Thus, the methodology presented in this work represents a technique that should be extrapolated to in vivo systems because the cells are seeded in micro-mass on a top surface material, and after the appropriate incubation times, 60% of the initial cellular mass is adhered. Moreover, this technique does not require the addition of osteoblastic inductors (e.g., dexamethasone, ascorbic acid, or beta-glycerophosphate) or ultrasonic stimuli to induce osteoblastic differentiation and maintenance of the osteoblast phenotype because NKB is an osteoconductive and osteoinductive scaffolds8, the method for the culture of MSCs from the human amniotic membrane (AM-hMSCs) on macroporous bone biomaterial presented in this work representsapossibility to insert cells into damaged bone tissue and induce differentiation to the osteoblastic lineage.
Protocol
This research was performed in accordance with the World Medical Association’s Declaration of Helsinki regarding the ethical conduct of research involving humans and was approved by the Research Ethic Board of Facultad de Medicina, UNAM (project number 101-2012).
1. Isolation of Human Mesenchymal Stem Cell
- Preparation of reagent
- Prepare phosphate-buffered saline solution (PBS) and supplement with 1% antibiotic-antimycotic solution.
- Prepare Dulbecco's Modified Eagle's Medium, high glucose (HG-DMEM), and add 10% fetal bovine serum (FBS) and 1% antibiotic-antimycotic solution.Sterilize this culture medium by filtration through a 0.2 µm filter.
- Prepare a collagenase II solution at 100 U/ml in HG-DMEM without FBS or antibiotic-antimycotic solution.
- Sterilize the following surgical instruments,which are needed for the isolation, by autoclaving: standard scissors, simple dissecting forceps, fine-point and toothed forceps and a scalpel handle (#4).
- Isolation of mesenchymal stem cells of human amniotic membrane
- Hold the umbilical cord with one hand and with the other hand, detach the amniotic membrane (AM), which looks like a translucent sheet, to obtain a fragment of approximately 5 cm2. If the chorion section is present in the sample, separate the underlying chorion by manual dissection as the chorion section is thicker than the amnion.
- Remove residual blood with three washes of 5 ml of PBS and remove clots with the simple forceps. Make a small cut in the AM with the scalpel to generate fragments of approximately 0.5 cm2.
- Enzymatic digestion of amniotic membrane
- Incubate the AM with 5 ml of 0.125% trypsin/0.5 mM EDTA solution at 37 °C for 30 min in a 50 ml conical tube at 37 °C in a 5% CO2 atmosphere. Centrifuge at 250 x g and 25 °C for 5 min and then remove the trypsin solution by discarding the supernatant.
- Add 15 ml of collagenase type II solution and incubate for 2 hr at 37 °C in a 5% CO2 atmosphere with occasional shaking according to Leyva et al.9
- Immediately after digestion with collagenase II, add 15 ml of PBS and centrifuge at 250 x g and 25 °C for 10 min.
- Discard the supernatant and wash the cellular pellet with 15 ml of PBS solution and centrifuge at 250 x g and 25 °C for 15 min. Discard the supernatant.
- Resuspend the cellular pellet in 10 ml of HG-DMEM by shaking gently.
- Expansion of mesenchymal stem cells
- Seed 2 ml of cell suspension (1 x 10⁴ cells/cm2) in culture flask, and add 2 ml of HG-DMEM and incubate the cells at 37 °C in a 5% CO2 atmosphere. Eliminate the non-adherent cell by changing the culture medium after 5-7 days.
- After this time, change the culture medium every 3 days for an additional 7-10 days to obtain a cellular confluence of 90%.
- Recover the cells and incubate them for 5 min at 37 °C in a 5% CO2 atmosphere with 0.125% trypsin/EDTA solution (trypsinization).
- Immediately after trypsinization, collect cells with a pipette and transfer to a 15 ml conical tube and centrifuge at 250 x g for 5 min.
- Discard the supernatant and resuspend the cellular pellet in 10 ml of HG-DMEM.
- Culture cell suspension in two 75 cm2 culture flasks (5 ml in each flask), and maintain the culture until 90% confluence.
- Repeat steps 1.4.3. to 1.4.6, until the 9th passage or subculture.
- Recover cells by trypsinization as in steps 1.4.3 to 1.4.5 for flow cytometry or other studies.
2. Preparation of the Porous Bone Matrix Disk (NKB)
- To wet the NKB disks (diameter, 12 mm; thickness, 2 mm), incubate each disk overnight with 3 ml of HG-DMEM without FBS in a humidified atmosphere of 5% CO2 at 37 °C, according to Fassina et al. 5
- After the wetting process, place the disk in a 50 ml conical tube and spin at 250 x g for 5 min to remove excess culture medium. Place the disk in a 24 well cell culture plate.
- Add 500 µl of HG-DMEM and incubate for 30 min at 25 °C. Ensure that no bubbles are present on the NKB disk to favor the correct distribution of nutrients and cells.
- If bubbles are observed on the disk, shake and add 300 µl of culture medium and incubate for 15 min in a humidified atmosphere of 5% CO2 at 37 °C. After this time remove 300 µl of culture medium sucking through the wall of well cell culture and confirm that no bubbles form.
- Place the disk in a new 24-well plate using simple forceps.
3. Culture of Human Mesenchymal Stem Cells on the Porous Bovine Matrix
- Seed a cellular suspension (5 x 10⁵ AM-hMSCs in 100 µl of HG-DMEM) from three subcultures, on the surface of the pre-wetted biomaterial disk and incubate for 30 min in a humidified atmosphere of 5% CO2 at 37 °C. Perform this step slowly and continuously on the upper face of the biomaterial to allow the cells to interact with the topography of all scaffold. Note: This procedure achieves the 60% of the cells attached on the biomaterial shown in the Table 1.
- Add 1.5 ml of HG-DMEM at 37 °C, and maintain the culture for 3 days in a humidified atmosphere of 5% CO2 at 37 °C. Do not generate turbulence in the addition of culture medium for avoid that the deposition of cells on the bottom of culture plate dish. This is initial time.
4. Cell Surface Markers Characterization by Flow Cytometry
- Detach the cells from 9th subculture before seeding them on the matrix disk. Use 0.25% trypsin/1 mM EDTA and fix them for 30 min in ice-cold 2% formaldehyde. Following fixation, wash the cells once with 0.05% PBS.
- Block non-specific binding by incubating the cells with 20% human immunoglobulin for 3 min on ice and incubate 0.1 x 10⁶ cell aliquots with phycoerythrin (PerCP)-conjugated MAb against CD73, FITC-conjugated MAb CD90, PE-conjugated MAb against CD34, FITC-conjugated MAb CD45 and PE-conjugated MAb CD105 for 1 hr at 25 °C in the dark. Isotype-matched FITC-conjugated MAb, PE-conjugated MAb andPerCP-conjugated MAb will serve as negative controls.
- Calculate the expression levels of the surface markers using software for data acquisition and analysis.
5. Cell Adhesion Detection by Scanning Electron Microscopy
- Rinse the cell-disk samples at 3 days of culture twice with PBS and fixthe samples with 4% (v/v) glutaraldehyde solutionin a 0.1 M Na-cacodylate buffer (pH 7.2).
- Prepare the samples for microscopic observation, as previously reported by Rivera-N et al.10 and observe using a scanning electron microscope at an electric potential of 15 kV and at a magnification of 500X and 2000X.
6. Cell Proliferation Assay
- To the cell-disk samples containing 1.5 ml of culture medium, add 150 µl of vital colorant(AB) according to manufacturer’s guidelines and incubate the cells in a humidified atmosphere of 5% CO2 at 37 °C.
- Immediately after the addition of AB (0 hr) and each 24 hr until reaching 7 days of cell culture, measure the absorbance at 570 nm with a reference wavelength of 600 nm.
7. Colony Forming Unit (CFU)11
- Culture 100 cells per 100 mm tissue culture diskin HG-DMEM and incubate for 14 days in a humidified atmosphere of 5% CO2 at 37 °C.
- Wash the culture with PBS and stain with 0.5% crystal violet in methanol for 5-10 min at room temperature.
- Wash the plates with PBS twice and count the visible colonies using a hemocytometer.
Results
Human mesenchymal stem cell isolation
After mechanical separation of the AM from the chorion using blunt dissection (Figure 1), an adherent cell population was obtained by trypsin and collagenase II digestion. These cell populations attached in the culture dish presenta fibroblast-like cell morphology at 3 days post isolation as shown in the optical micrograph (Figure 2A) and scanning electron micrograph (Figure 2B).The placentas used in this work were obtained from healthy donor mothers withprevious informed consent.
Cell characterization by flow cytometry
The cell population that was obtained from the AM was strongly reactive to the surface mesenchymal markers CD90+ (93.5% ± 6.85) and CD73+ and CD105+ (79% ± 3.46) and showed a negative reaction to hematopoietic markers such as CD34- and CD45. Thus, the AM-hMSCs used in this work were mesenchymal, in accordancewith information previously reported by Leyva et al. (Figure 3). Additionally, this result coincides with the immunophenotype characteristics that were established by the International Society for Cellular Therapy (ISCT) for mesenchymal stem cells.
Cell adhesion on bone matrix
The scanning micrographs show the behavior of the AM-hMSCs seven days after layering on the NKB. The surface of the biomaterial was covered with spherical cells (day one), and some spreading cells apparently attached to the bovine matrix surface on the seventh day. At higher magnification, the spreading cells appeared to be in close contact via filipodial processes (FL) (Figure 4).
Cell proliferation on bone matrix
The results of the AB assay showed a small decrease in relative absorbance units (RAU) of bovine matrix condition (+bone matrix) after 1 day of incubation and then on the fifth day, the presence of the scaffold induces an increase in the cell proliferation statistically significant in comparison with the culture performed in the absence of bovine matrix (-bone matrix) (Figure 5).
Colony Forming Unit
The CFU is a traditionally assay of stem cells. The AM-hMSCs isolated in this work preserved its capability to form discrete colonies at 14 days in culture.
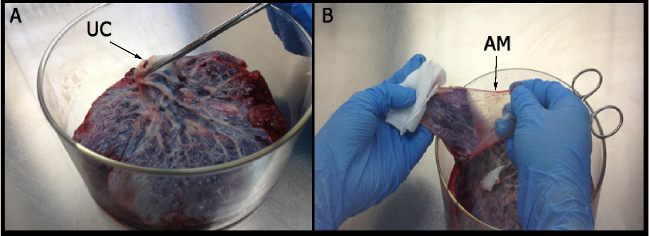
Figure 1: Isolation of amniotic membrane. (A) The umbilical cord (UC) is held with one hand to identify the region in which the amniotic membrane is obtained. (B) The amniotic membrane (AM) resembles a translucent film without blood innervations.
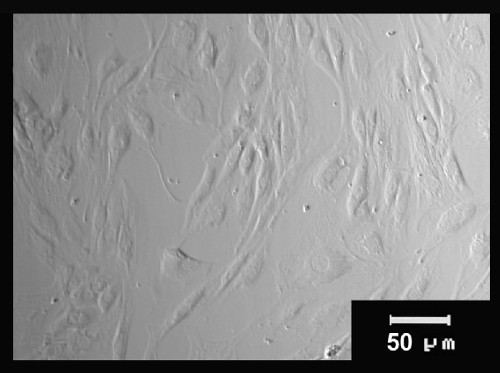
Figure 2: Morphological characteristics of stem cells from the human amniotic membrane. AM-hMSC cultures at 3 days post-isolation were observed using an optical microscope and shown the fibroblast-like morphology.
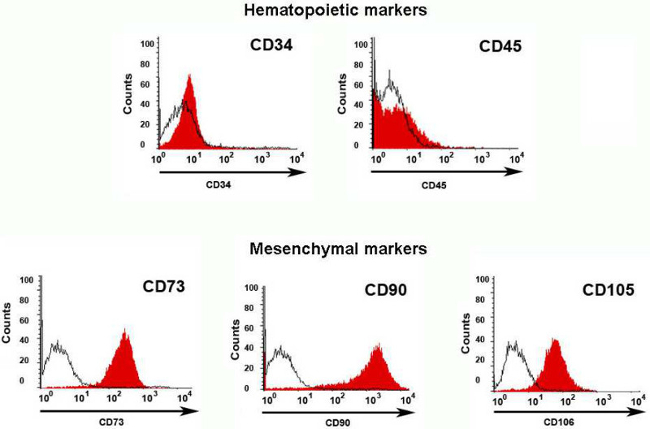
Figure 3: Flow cytometry characterization. The cells from human amniotic membrane were mostly mesenchymal cells because they were positive for mesenchymal markers (CD73, CD90, CD105), as shown by the displacement of histogram to the right, and negative for hematopoietic markers (CD34 and CD45), as confirmed by the displacement of the histogram to the left. The antigens are shown in red histograms, while the control isotypesfor the PE and FITC fluorochromes are observed in black.
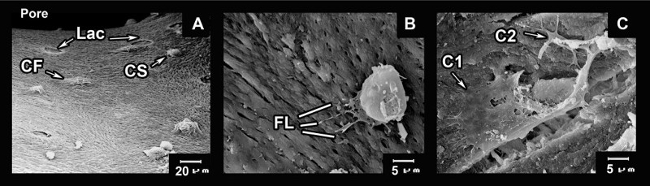
Figure 4: Cell adhesion on bovine bone matrix. A series of SEM images showing attachment of the cells to pores of the biomaterial. (A) Panoramic vision of a NKB pore with several cells adhered to the biomaterial in the spherical state (CS) and flattened (CF) on the surface of the biomaterial, is also possible to appreciate the bone lacuna indicates as (Lac) at three day of culture on the bovine matrix. (B) Amplification of the cell in the process of adapting at the surface of the material through filipodial projections. (C) Interaction between two cells adhered and flattened on the bovine matrix (C1, cell 1; and C2, cell 2). Please click here to view a larger version of this figure.
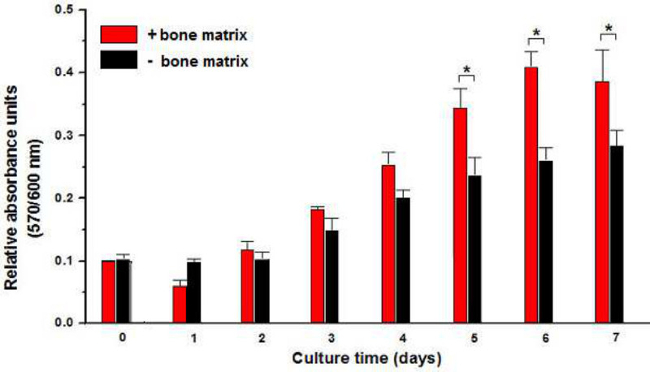
Figure 5: Proliferation of cells on bovine bone matrix. Cell proliferation was evaluated by AB reduction and expressed in relative absorbance units along 7 days of cultivation. Results are shown the influence of bone matrix (+bone matrix) in AM-hMSCs proliferation which was statically different in comparison with the negative condition (-bone matrix). (*p <0.05)
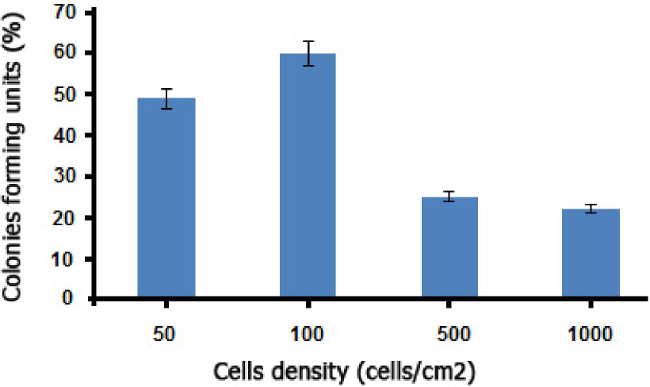
Figure 6: CFU assay of MSCs initially plated at varying densities and incubated for 14 days (mean*/- SD, n = 10).
| Cells adhered | Cell adhesion (%) | |
| Cells on the bottom | 187667 ± 1208 | 62.47 |
| Cells on the scaffold | 312333 ±1208 | 37.53 |
Table 1: Efficiency of adhesion on bovine matrix. The cells adhered to the bottom of the plate dish and the cells adhering on the scaffold were counted by hemocytometer after being recovered by trypsinization.The data presented in the table correspond to two experiment independent for triplicate ± standard deviation
Discussion
The stem cells that were obtained from human amniotic membrane (Figure 1) showed a fibroblast-like morphology, similar to mesenchymal cells (Figure 2) and were principally MSCs. In addition, flow cytometry assays revealed that these cells were positive for mesenchymal cell markers (CD73, CD90, and CD105) and negative for hematopoietic lineage markers (CD34, CD45) (Figure 3). Also, the AM-hMSCs isolated in this work present the capability of forming CFUs (Figure 6). Similarly, the mesenchymal stem cells isolated in this form retained the ability to attach to osteoinductor biomaterial (Figure 4), and proliferate on the scaffold (Figure 5).
For these reasons, the culture method of AM-hMSCs on macroporous bone biomaterial that was used in this work represents an opportunity to insert cells within injured bone tissue and induce its differentiation to the osteoblastic lineage. This culture system does not require the addition of osteoblastic inductors to maintain the osteoblast phenotype and osteoblastic differentiation process because NKB is an osteoconductive andosteoinductive material8. The use of waste tissues, such as human placenta, represents a simple and ethical alternative to access a population of stem cells with the potential to differentiate into MSCs, in comparison with other sources that frequently involve invasive methods or low cell yield.
The proposed culture method could be extrapolated to in vivo systems because the cells are seeded in micro-mass on the top surface material, and the cells colonize and adhere to the entire biomaterial surface after the appropriate incubation times. Furthermore, sophisticated reagents, equipment and procedures are not required, unlike existing methods when implementing this technique are the micro-mass cultureas well as the slow and steady deposition of the cellular aliquot on the material to ensure that the cells preferentially interact with the biomaterial, and not with the bottom of the plate. Another critical point is the use of pre-wetted material before culturing the cells, as this ensures that the cells will have the necessary nutrients from the culture medium when they are integrated into the material regardless if they are on the surface or within the pores. Finally, the use of an osteoinductive biomaterial is critical to this process because it avoids the addition of external factors to induce and maintain osteoblastic differentiation. The limitation of the technique is that it is based on the osteoinductive potential of the bovine matrix; however, the proposed culture system can be extrapolated to any porous material with a pore distribution of 20 to 200 µm. Therefore, the procedure presented in this work is an alternative method for culturing mesenchymal stem cells in various materials that are employed for tissue engineering, especially for bone regeneration.
Disclosures
The authors have nothing to disclose.
Acknowledgements
We acknowledge the scholarship and financial support provided by the Consejo Nacional de Ciencia y Tecnología (CONACyT No.49887), Facultad de Medicina-UNAM DGAPA IN201510 and DGAPA IN216213 ; Salvador Correa of Instituto Nacional de Perinatología for help with the biological material; and Biocriss, S. A. de C. V for donating Nukbone. Also thank to Ing. Héctor Martínez of IIM, UNAM and M en C Fabiola Gonzalez of CINVESTAV for technical assistance.
Materials
| Name | Company | Catalog Number | Comments |
|---|---|---|---|
| sterile phosphate buffered saline | GIBCO,LIFE TECHNOLOGIES | 10010023 | cell culture |
| penicillin-streptomycin | GIBCO,LIFE TECHNOLOGIES | 10378016 | cell culture |
| FBS | GIBCO,LIFE TECHNOLOGIES | 26140111 | cell culture |
| Dulbecco's Modified Eagle's Medium (DMEM) with high glucose | GIBCO,LIFE TECHNOLOGIES | 11965118 | cell culture |
| collagenase type II | GIBCO,LIFE TECHNOLOGIES | 17101015 | cell culture |
| 3 mM calcium chloride | SIGMA_ALDRICH | C5670 | cell culture |
| trypsin/0.5 mM EDTA solution | GIBCO,LIFE TECHNOLOGIES | R001100 | cell culture |
| Trypan Blue solution | GIBCO,LIFE TECHNOLOGIES | 15250061 | cell culture |
| phycoerythrin (PerCP)-conjugated CD73 | BD Pharmigen | 562245 | cytomery |
| FITC- CD90, | BD Pharmigen | 562245 | cytomery |
| PE-CD34 | BD Pharmigen | 562245 | cytomery |
| FITC-CD45 | BD Pharmigen | 562245 | cytomery |
| PE-CD105 | BD Pharmigen | 562245 | cytomery |
| BD FACSCalibur Flow Cytometer | BD Pharmigen | BD FACSCalibur | cytomery |
| alamarBlue (AB) | LIFE TECHNOLOGIES | DAL1025 | proliferation cell assay |
| SUNRISE-reader | TECAN, Germany | Sunrise | proliferation cell assay |
References
- Alviano, F., et al. Term amniotic membrane is a high throughput source for multipotent mesenchymal stem cells with the ability to differentiate into endothelial cells in vitro. BMC Developmental Biology. 7, 1-14 (2007).
- Anker, P. S., et al. Isolation of mesenchymal stem cells of fetal or maternal origin from human placenta. Stem Cells. 22 (4), 1338-1345 (2004).
- Seebach, C., Schultheiss, J., Wilhelm, K., Frank, J., Henrich, D. Comparison of six bone-graft substitutes regarding to cell seeding efficiency, metabolism and growth behaviour of human mesenchymal stem cells (MSC) in vitro. Int J Care Injured. 41, 731-738 (2010).
- Meseguer-Olmo, L. J., et al. In vitro growth kinematics of human osteoblasts on porous hydroxyapatite ceramics. Rev. Ortop. Traumatol. 50, 224-232 (2006).
- Fassina, L., et al. Low-power ultrasound as a tool to culture human osteoblasts inside cancellous hydroxyapatite. Bioinorganic Chemistry and Applications. 2010, 1-8 (2010).
- Fassina, L., et al. Ultrasonic and Electromagnetic Enhancement of a Culture of Human SAOS-2 Osteoblasts Seeded onto a Titanium Plasma-Spray Surface. Tissue Engineering Part C: Methods. 15, 233-242 (2009).
- Gomes, M. E., Holtorf, H. L., Reis, R. L., Mikos, A. G. Influence of the porosity of starch-based fiber mesh scaffolds on the proliferation and osteogenic differentiation of bone marrow stromal cells cultured in a flow perfusion bioreactor. Tissue Eng. 12, 801-809 (2006).
- Rodriguez-Fuentes, N., et al. Nukbone(R) promotes proliferation and osteoblastic differentiation of mesenchymal stem cells from human amniotic membrane. Biochemical and Biophysical Research Communications. 434, 676-680 (2013).
- Leyva-Leyva, M., et al. Characterization of mesenchymal stem cell subpopulations from human amniotic membrane with dissimilar osteoblastic potential. Stem Cells and Development. 22, 1275-1287 (2013).
- Rivera, N., et al. Blackwater fever like in murine malaria. Parasitology Research. 112, 1021-1029 (2013).
- Pochsmpally, R. Colony Forming Units Assays for MSCs. Mesenchymal Stem Cells. Methods and Protocols. Procko, D. J., Phinney, D. G., Bunnell, B. A. , Humana Press. New York, NY. (2008).
Reprints and Permissions
