Brain myeloid cells characterization following stroke can be performed by stereology using the optical fractionator method, or by a flow cytometric analysis of brain leukocytes suspensions. Both are useful techniques to perform an accurate phenotypical distinction of the main myeloid cell subsets found in the ischemic brain.
Method Article
Stereological and Flow Cytometry Characterization of Leukocyte Subpopulations in Models of Transient or Permanent Cerebral Ischemia
* These authors contributed equally
In This Article
Summary
Abstract
Microglia activation, as well as extravasation of haematogenous macrophages and neutrophils, is believed to play a pivotal role in brain injury after stroke. These myeloid cell subpopulations can display different phenotypes and functions and need to be distinguished and characterized to study their regulation and contribution to tissue damage. This protocol provides two different methodologies for brain immune cell characterization: a precise stereological approach and a flow cytometric analysis. The stereological approach is based on the optical fractionator method, which calculates the total number of cells in an area of interest (infarcted brain) estimated by a systematic random sampling. The second characterization approach provides a simple way to isolate brain leukocyte suspensions and to characterize them by flow cytometry, allowing for the characterization of microglia, infiltrated monocytes and neutrophils of the ischemic tissue. In addition, it also details a cerebral ischemia model in mice that exclusively affects brain cortex, generating highly reproducible infarcts with a low rate of mortality, and the procedure for histological brain processing to characterize infarct volume by the Cavalieri method.
Introduction
Morphological, phenotypic and gene expression alterations of microglia, as well as extravasation and activation of haematogenous macrophages and neutrophils are believed to play a pivotal role in the pathophysiological cascade following brain injury1-4. This protocol provides two approaches to estimate the number of different myeloid cell subsets of the ischemic brain and to perform their phenotypical characterization. In addition, it also provides a description of an experimental model of cerebral ischemia in mice, which consists of the transient or permanent ligation of both distal Middle Cerebral Artery (MCA) and the common carotid artery (CCA), including how to evaluate the infarct by the accurate Cavalieri method using a stereological software.
The first approach to characterize myeloid cell subsets of the ischemic brain is a stereological method based on the optical fractionator approach5. This is the most commonly used stereological probe in life sciences and provides a high degree of precision with low coefficients of error5-7. This is the best choice for cell quantification when the tissue is cut into sections, as it avoids the bias on cell estimation because of the fragmentation of the tissue into sections. This method is a very powerful way to characterize numbers, dynamics and phenotypic changes of infiltrated neutrophil subpopulations of the ischemic tissue8.
The second characterization approach is based on a modified protocol from Campanella and collaborators9 that provides a simple way to isolate brain leukocyte suspensions and to characterize them by flow cytometry. In contrast to conventional immunohistochemical techniques, flow cytometry characterization allows differentiating between microglia (CD45loCD11b+) and infiltrated myeloid cells (CD45hiCD11b+) based on their different expression levels of CD45 9-13. In addition, pro-inflammatory monocytes (CD45hiCD11b+Ly-6G-Ly-6Chi), neutrophils (CD45hiCD11b+Ly-6G+) and other leukocytes subsets of the ischemic tissue can be distinguished. This approach provides a reliable and rapid assay to assess neuroinflammation in experimental models of brain ischemia. However, tissue processing can influence the activation state and numbers of the different cell populations found in the ischemic tissue providing a semi-quantitative characterization.
Protocol
NOTE: All experimental protocols adhered to the guidelines of the Animal Welfare Committee of the Universidad Complutense (following EU directives 86/609/CEE and 2003/65/CE).
1. Cerebral Ischemia Model
NOTE: The cerebral ischemia model in this paper involves permanent or transient occlusion of both CCA (common carotid artery) and MCA (middle cerebral artery) by ligation with a nylon suture.
- Pre-surgical preparations
- Sterilize all surgical instruments by autoclaving or with a glass bead sterilizer. Disinfect the surgical area with 70% ethanol as well.
- Anesthetize mouse with appropriate anesthetics. Achieve induction by isoflurane 2.5% and maintain with by isoflurane 1.5% in a mixture of 80% air / 20% oxygen using a vaporizer. Apply artificial tears to the mice eyes to prevent dryness while under anesthesia.
- Place the mouse on a heating pad that is linked to a feedback device with a temperature probe placed in the rectum and set temperature at physiological levels (36.5 ± 0.5 ºC) during the surgical procedure.
- Common carotid artery occlusion by ligation
- Place the mouse in dorsal recumbency and immobilize with tape. Disinfect skin with 70% ethanol or povidone-iodide and cut the hair of the upper ventral part.
- Under a surgical microscope, make a 1 cm midline incision around the ventral surface of the neck.
- Pull apart all soft tissues (glandular tissue including sub-maxillary, sublingual and parotid glands) and identify the left Common Carotid Artery (CCA), which is localized lateral to the trachea. Retract the muscles and expose left CCA. Carefully dissect from vagus nerve.
- Once dissected, occlude the left CCA by a ligature using a 6/0 nylon suture. Ligate with a permanent knot or a slipknot (to allow reperfusion if a transient cerebral ischemia model is desired).
- Place the glandular tissue into its original position and close the incision on the neck skin with a 6/0 nylon suture.
NOTE: Sham animals are subjected to the same surgical procedure as MCAO animals but the CCA is not occluded.
- Distal middle cerebral artery occlusion by ligation
- Position the mouse on its right side and immobilize with tape. Disinfect the head skin with 70% ethanol or povidone-iodide and cut the hair of the mouse head (remove hair after cutting).
- Under a surgical microscope, make a skin incision between the eye and the ear. Move the skin away and hold it with tape.
- Make a horizontal incision on the temporal muscle from the right to the left. Then, make a second vertical incision on the right side of the temporal muscle (be careful to avoid cut temporal vein). Pull apart the temporal muscle from the skull and hold it with a suture to maintain a clean skull surface.
- Clean the skull surface with cold sterile saline to detect the exact position of the left Middle Cerebral Artery (MCA) via skull transparency. Perform a round craniotomy (1 mm in diameter) with a stainless steel burr in the frontal lobe between the zygomatic arch and the squamosal bone. Remove carefully the skull and expose the MCA.
- Apply a small amount of cold sterile saline solution to the surface of the brain and remove the meninges (dura and arachnoid mater) by using forceps.
- Perform ligation of the left MCA in the distal trunk just before the bifurcation between the frontal and posterior MCA branches. Occlude the left MCA by a ligature using a 9/0 nylon suture. Ligate with a permanent knot or a slipknot (to allow reperfusion if a transient cerebral ischemia model is desired). The period of time between CCA and MCA occlusion is approximately 10-20 minutes depending on the operator's experience.
- Place the temporal muscle into its original position and close the incision on the neck skin with a 6/0 nylon suture.
- Return the mouse to the cage to recover from the anesthesia (generally 5-10 min) and inject the mouse with buprenorphine intraperitoneal (I.P.) (0.3 mg/kg).
- Monitor the mouse for several hr to detect any discomfort (do not leave the mouse unattended until it has regained sufficient consciousness to maintain sternal recumbency). Since post-surgical weight lost is generally observed, place mashed food in a Petri dish to facilitate eating.
- When the animal is fully recovered, return to the company of other animals.
- If a transient MCAO model is desired, anesthetize the mouse again and remove the slipknot of the CCA and the MCA to allow reperfusion (usually between 0.5-2 hr (Figure 1)).
NOTE: Sham animals are subjected to the same surgical procedure as MCAO animals but the MCA is not occluded.
2. Perfusion and Sectioning of Brain Tissue
- 24 or 48 hr after MCAO, sacrifice the mouse with a lethal dose of anesthetic (e.g., sodium pentobarbital, I.P. 86 mg/kg or an overdose with isoflurane).
- Perfuse the mouse with phosphate buffer 0.1 M followed by 4% paraformaldehyde (PFA) in phosphate buffer (pH 7.4).
- Remove the brain as follows:
- Decapitate the animal just above the spinal cord.
- Make a posterior-anterior incision on the head's skin to expose the skull. Make two lateral cuts at the junction of the lateral walls and the base of the skull and remove the small piece of bone.
- Make a cut through the skull along the sagittal suture.
- Remove the skull overlying each hemisphere by using a forceps to expose the brain. Use a spatula to separate the brain from the skull and transfer it into 4% PFA solution.
- Post-fix for 3 hr in 4% PFA solution at 4 ºC.
- Remove PFA solution and incubate the brain for 48 hr in 30% sucrose solution to cryoprotect the brain.
- Remove sucrose solution and freeze the brain quickly in cold isopentane (-40 ºC). Store frozen brain at –80 ºC.
- Obtain coronal brain sections (30 µm) with a freezing microtome. Collect ten serial sets in a cryopreservative solution. Each serial set is composed of around 14-16 coronal slices with an interslice distance of 300 μm which adequately sample the mouse brain between 1.94 and -2.46 posterior to bregma.
3. Nissl Staining and Infarct Volume Estimation
- Nissl staining by cresyl violet
- Mount brain sections into a superfrost microscope slide. For infarct volume determination by the Cavalieri method in Nissl-stained sections, use a 1/20 slice-sampling fraction (1/2 sections of one of the ten serial sets collected in step 2.7; approximately, a total number of 7-8 sections with an interslice distance of 600 μm are used). Be careful to maintain proper anterior-posterior orientation (infarcted area is placed in the right side).
- Perform conventional Nissl staining as follows:
- Allow slide-mounted sections to dry for several hr.
- Rehydrate slide-mounted sections and stain with 0.1% cresyl violet solution for 5 min.
- Dehydrate with a graded series of EtOH (70%, 90%, and 100%; 5 min per change). Clean the slide-mounted sections with xylene, add distrene-80 plasticizer xylene (DPX) mounting media and cover with a glass coverslip.
- Using stereological software to estimate the infarct volume by the Cavalieri method in Nissl-stained serial sections
- Use parameters shown in Table 1 to quantify infarct volume by the Cavalieri method14 and a stereology system, which consists of a microscope fitted with a camera, a XYZ motorized computer stage, and stereological software (The main directions provided below are related to PCs but the directions could differ for other operating systems).
- Turn on PC, microscope, stage controller and camera in the appropriate order. Start the stereological software.
- Move the 10X objective into place and select the 10X from the objective drop down menu.
- Move around the first Nissl-stained section and find a suitable reference point. Click the mouse to establish the reference point (to move around it is necessary to active the joy free button).
- Estimate the “mounted section thickness” (the actual section thickness taking into account the shrinkage). Press the “Focus Position Meter” button and calculate the thickness from the bottom to the top of the section.
- Create a contour tool for the contralesional and ipsilesional areas and the infarcted area.
- Click on the menu “Display” and select “Display Settings”. This opens the Display Settings Dialog.
- Select the “Contours” tab and click the button “add Contour type”.
- Create a contour for each region to quantify and make them visible in the contour down menu. Click OK.
- Create a Marker tool for the contralesional and ipsilesional hemispheres and the infarcted area.
- Click on the menu “Display” and select “Display Settings” to open the Display Settings dialog.
- Select “Markers” tab and change the markers name by double clicking over the available markers. Make them visible in the Marker Bar. Click OK.
- Activate the section manager.
- Click on the menu “Tools/Serial Section Manager”. Add a new section with the “new section” button. This button opens the “Serial Section Setup dialog”.
- Set the “Block Advance” as 30 µm. Set the “mounted section thickness” with the value estimated in the step 3.2.5.
- Set the “Evaluation Interval” as 20. Use a 1/20 slice sampling fraction.
- Set “the starting section number” as 1. Set the “Z axis value for the top of the first section” as 0. Click OK.
- Draw a contour to outline the contralateral hemisphere.
- Select the Contralesional hemisphere tool (previously created in the step 3.2.6) from the contour down menu.
- Draw a contour to outline the contralateral hemisphere.
- To finish tracing the contralesional hemisphere, right click the mouse and select “close contour”.
- Estimate the contralesional hemisphere contour by Cavalieri.
- Click on the menu “Probes” and select Cavalieri Estimator. Set “Grid Spacing” as 100 µm. Set “Grid Rotation” as 0. Set the “Block Advance” as 30 µm. Click OK.
- Select “The contralesional hemisphere” button from the Markers Bar. Right click inside of the Contralesional hemisphere contour.
- Select “Paint Cavalieri Markers Mode”. Right click inside the contralesional hemisphere contour again and select “Paint Markers into Contour”.
- Deactivate Cavalieri Estimator by clicking on probes and Cavalieri Estimator and deactivate the contralesional marker button from the marker bar.
- Repeat the same procedure for the ipsilesional hemisphere and the infarcted area (steps 3.2.7 and 3.2.8). Save the data after the estimation of the area of each section.
- Calculate the contralateral, ipsilesional and infarcted areas in the rest of the Nissl-stained section.
- Create a new section as in step 3.2.6. Do not modify the values entered in the “Serial section Setup” dialog. Click Ok.
- Repeat steps 3.2.7-3.2.8 in the new section.
- Export the results of the quantification to a spreadsheet file.
- Click “Probes” in the Stereo Investigator Menu. Select “Display Probe Run List”. This opens the “Previous Stereological Runs Dialog”.
- Select all the sections by clicking over them. Press the “View Results” Button. This opens “the Cavalieri Estimator Results” where the estimated area and volume for each region are displayed.
- To export the results to a spreadsheet file, click the “Copy all Results to Clipboard” and paste to an excel file with the main results obtained from each region (Table 2).
- Express infarct volume as mm3 or as % of the hemisphere that is infarcted (%IH) using the formula15 %IH = InfVol/ContrVol*100, where
InfVol (Infarcted Tissue Volume) = ΣInfAreai,
ContrVol (Contralesional Hemisphere Volume) = ΣContrAreai
4. Stereological Quantification of Infiltrated Neutrophils After Cerebral Ischemia by the Optical Fractionator
- Staining of the brain sections:
- For estimating the total number of infiltrated neutrophils after MCAO by the optical fractionator16, use a 1/10 slice sampling fraction. Immunostain neutrophils by using conventional immunofluorescence techniques with the rat anti-Ly6G antibody (1A8) and the right secondary antibody on free-floating sections. In addition, a counterstaining with a nuclear maker like DAPI or TOPRO, although it is not necessary for neutrophil identification, can make easier to detect the infarcted area.
- Mount brain sections into a superfrost microscope slide with the infarcted area placed in the right side.
- Quantification of infiltrated leukocytes in the ischemic brain by the optical fractionator
- Use parameters shown in Table 3 to quantify infiltrated leukocytes in the ischemic brain by the optical fractionator approach with a stereology system. Repeat the steps 3.2.1-3.2.5 from section 3.
- Create a contour tool for the infarcted area as it has been described in the step 3.2.6 of the section 3.
- Create a marker tool for neutrophils as it has been described in the step 3.2.7 of the section 3.
- Activate the section manager and create a new section as in the step 3.2.8. In this case, set the “Evaluation Interval” as 10 (a 1/10 slice sampling fraction is used for estimating neutrophil number).
- Select the “Infarcted Area” contour tool (previously created in the step 4.2.1) from the contour down menu. Draw a contour to outline the infarcted area at 10X objective. Change the objective to 100X to perform neutrophil quantification (do not forget to select the 100X from the objective drop down menu).
- Click on the menu “Probes” and select the “Optical Fractionator”. Set the “XY Placement of counting Frames” as 230 for both X and Y grid size. Set “Grid Rotation” as 0. Set the “Block Advance” as 30 µm. Click OK.
- Select the “neutrophil” button from the Marker Bar. Mark stained neutrophils in the infarcted area. Once finish, deactivate the Optical Fractionator probe by clicking on “Probes” and “Optical Fractionator”. Deactivate the neutrophil button from the marker bar.
- Repeat the same procedure for each section (4.2.4-4.2.9).
- Export the results of the quantification to a spreadsheet file.
- Click “Probes” in the Stereo Investigator Menu. Select “Display Probe Run List” to open the “Previous Stereological Runs“ dialog.
- Select all the sections by clicking over them. Press the “View Results” Button to open “the Optical Fractionator Results” where the estimated number of neutrophils is displayed.
- Export the results to a spreadsheet file by clicking the “Copy all Results to Clipboard” and paste to a spreadsheet file.
5. Brain Dissociation and Flow Cytometry Analysis
NOTE: Myeloid subpopulation characterization by flow cytometry on fresh brain tissue can be used as an alternative to the previous neutrophil characterization performed on fixed and immunostained brain sections.
- Brain dissociation and single cell suspension preparation
- Make 10 ml/animal of a RPMI (Roswell Park Memorial Institute medium)-Percoll solution containing 8 ml of RPMI, 1 ml of 30% Percoll and 1 ml of a 10x PBS (phosphate buffered saline).
- Remove mouse brain after MCAO as described in the step 2.3.
- Under a microscope, dissect out core and peri-infarct areas of the ipsilateral cortex from brain ischemic mouse (or a similar region for sham and naïve animals) from the brain. Weight brain tissue and place it into 5 ml of ice-cold RPMI-Percoll (the weight step can be performed for normalization between experimental groups).
- Dissociate the tissue in a single cell suspension using a Potter-Elvehjem-type tissue grinder with Teflon pestles.
- Transfer cell suspensions to a 50 ml ultracentrifuge tube and add 5 more ml of RPMI-Percoll solution to the samples.
- Centrifuge the cell suspensions at 7,800 x g for 30 min at 25 ºC. After centrifugation, ensure a white-colored layer corresponding to myelin appears at the top of the solution.
- Remove the myelin layer carefully and filter the whole cell suspensions, including the pelleted cells, through 40-µm nylon mesh strainer.
- Add 10 ml of RPMI on the strainer to ensure that all the cells are filtered and place the solution in a 50 ml tube. Add 30 ml of RPMI and centrifuge the 50 ml of cell suspension at 600 x g for 10 min at RT.
- Discard the supernatant and resuspend the leukocyte pellet with 1 ml of PBS. Add 4 ml of lysis buffer (150 mM NH4Cl, 10 mM NaHCO3 and 0.1 mM EDTA) and incubate the cells for 2-3 min at RT to lyse erythrocytes from the cell suspension. Centrifuge the solution at 600 x g for 10 min at 4 ºC.
- Cell staining and flow cytometry
- Prepare a labeling cocktail for flow cytometry, containing 200 μl of PBS-BSA (1%) 1:100 Fc-Block, 1:40 anti-CD45-PercP rat, 1:40 anti-Ly6G-APC rat, 1:40 anti CD11b-FITC rat and 1:40 anti-Ly-6C-PE rat per sample.
- Resuspend the cells in the labeling cocktail and incubate the samples for 45 min in ice.
- Wash the labeling cocktail with 1 ml of cold PBS and centrifuge the cells at 600 x g for 10 min at 4 ºC. Resuspend the pellet with 100 µl of FACS Flow and acquire the entire cell suspension by flow cytometry.
- Use a flow cytometry analysis software to characterize and quantify cell populations.
- Main leukocyte subsets corresponding to the labeling cocktail prepared in this protocol can be characterized as follows: CD45loCD11b+: resident microglial cells; CD45hiCD11b+Ly-6G+: neutrophils; CD45hiCD11b+Ly-6G-Ly-6Chi: pro-inflammatory monocytes.
Results
The cerebral ischemia model shown here generates infarcts seen exclusively in the cortex without affecting the striatal tissue since the lenticulostriatal branches of the MCA that irrigate the striatum are not occluded (Figure 1). By Nissl staining, the damaged area can be identified as a hypochromic cortical area (Figure 2). This model is characterized by highly reproducible infarct volumes at 24 hr after MCAO (%IH 15.89 ± 0.28) estimated by Cavalieri method in Nissl-stained sections (Figure 2). Estimation of the infarcted volume by the Cavalieri method is an accurate approach with a low error that is reflected in the coefficient of error (CE) of Gundersen in the contralesional and ipsilesional hemispheres as well as in the infarcted area (Table 2). Damaged tissue volume can be expressed in mm3 but also as % IH using the formula in the section 3.2.13. In addition, the estimation of the total volume of the ipsilesional and contralesional regions allows for the calculation of edema index to correct the infarcted volume and to avoid an overestimation of the damaged tissue (Table 2).
Given the serial sectioning processing of the brain tissue, this can be taken advantage of to perform an accurate estimation of the total number of cell subpopulations, like infiltrated neutrophils, in the ischemic area, using the Optical Fractionator approach (Figure 3 and Table 4) with parameters shown in Table 3. This protocol estimates a total number of neutrophils (Ly6G-positive cells) in the infarcted area of 23,328 ± 3,623 at 24 hr and 82,856 ± 8,143 at 48 hr in mice after pMCAO (Figure 3D). In agreement with previous studies, neutrophil infiltration is directly correlated with the infarct size (Figure 3E). Estimation of the number of neutrophils by the Optical Fractionator method is an accurate approach with a low error that is reflected by the CE of Gundersen (Table 4).
The leukocyte isolation and flow cytometry characterization protocol allows the isolation of 47,922 ± 23,174 myeloid cells from the cortex of the ipsilesional hemisphere of ischemic mice. This comprises 10-30% of the total events found in the cell suspension. The vast majority of captured events using this protocol present a low FSC parameter, associated to cellular debris (Figure 4). CD11b staining shows that CD11b+ cells have a higher FSC value (Figure 4), suggesting that cell debris is not labeled with this marker and, as previously indicated, that it can be excluded from further analysis by setting the FSC threshold at 2009. The variable amount of cell debris obtained with this method suggests that differences on sample processing (timing, tissue conservation, sample temperature, efficient myelin removal, etc.) can account for it. In addition, the use of cell strainers is also needed to avoid the presence of cellular clamps in the samples; this step needs to be done prior to cell staining. Using the gating strategy shown in the Figure 5 which is based on CD11b and CD45 expression, we can discriminate between resident and infiltrated myeloid cells in the ischemic tissue. This CD11b+ population increases in the ischemic hemisphere when compared with the naive and with the sham group, in which these cells are mostly associated to a low expression of CD45 indicating that microglia is proliferating after ischemia (Figure 4, Figure 5 and Table 5). This difference is likely due to cell infiltration from the periphery, as evidenced by the appearance of a CD11b+CD45hi cell subpopulation in the ischemic brain (Figure 4, Figure 5 and Table 5) which is low number in naïve and in sham brains. The contribution of infiltrates to the CD11b+ cell population in brain ischemia is a very dynamic process4. In the MCAO model by ligature, it can vary from 30% to 60% of the total CD11b+ cells depending on the size of the lesion and of the time when the characterization has been done. Neutrophils, characterized as Ly-6G+ cells, are the most numerous infiltrated cell population found at 24 hr after MCAO in the ischemic mouse brain using this model of cerebral ischemia, as they comprise the 70-80% of the CD11b+CD45hi. The rest of the cells are mostly a subpopulation of CD11b+CD45hiLy-6G-Ly-6Chi pro-inflammatory monocytes. In this model, this population will increase in number in the ischemic brain areas from 24 to 48 hr after MCAO.
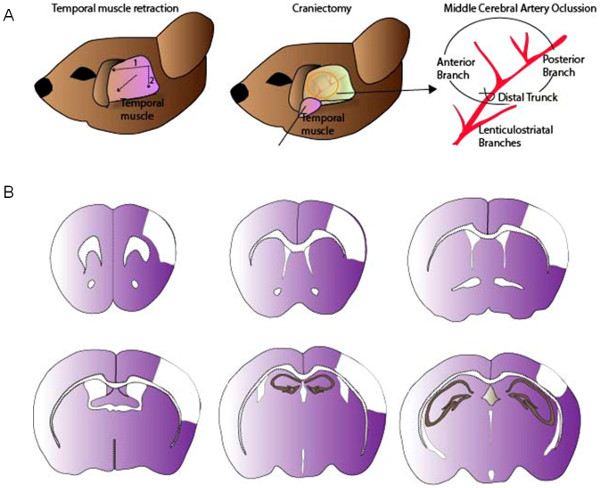
Figure 1: Surgical procedure for the MCA ligation. (A) After retraction of the temporal muscle, a small craniotomy is performed in the mouse skull. MCA is ligated by a knot or a slipknot using a 9/0 suture. (B) Representative images of the cortical lesion generated by the MCAO model. Please click here to view a larger version of this figure.
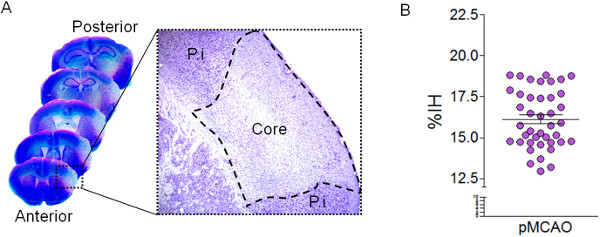
Figure 2: Quantification of infarct volume by Cavalieri. (A) Representative images of Nissl-stained brain sections 24 hr after permanent MCA ligation. The high magnification shows the hipocromatic area after Nissl staining which identifies the damaged area (core) after MCAO. The Peri-Infarct (P.I) region is also shown. (B) Quantification of the infarct volume represented as % Infarcted Hemisphere (%IH) by using the Cavalieri method in serial Nissl-stained sections, 24 hr after MCAO (n = 50 mice).
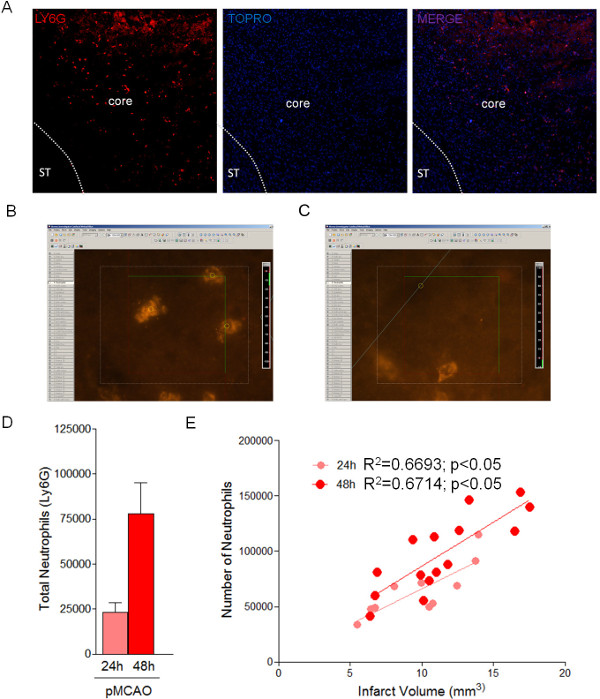
Figure 3: Stereological quantification of neutrophils in the infarcted area 24 and 48 hr after ligation, using the Optical Fractionator method. (A) Representative image of infiltrated neutrophils (Ly6G-positive cells) in the ischemic area at 24 hr after MCAO. Delimitation shows the infarcted area. (B, C) Examples of an optical dissector for neutrophil quantification by the optical fractionator. (D) Quantification of total neutrophils in the infarcted region at 24 and 48 hr (n = 4 mice). (E) Correlation of the number of neutrophils with the infarct size at 24 and 48 hr after MCA ligation. Please click here to view a larger version of this figure.
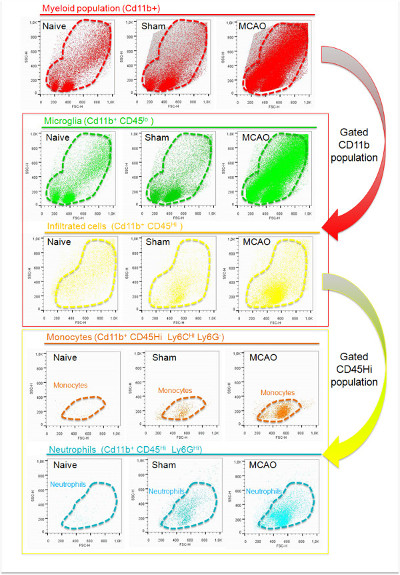
Figure 4: Representative dot-plot scatter analysis of brain leukocytes obtained from naïve, sham and ischemic (24 hr after MCAO) hemispheres on the basis of physical parameters (SSC and FSC). A population of events that express CD11b (red) was identified in all groups. This population was gated and characterized according to the expression of CD45. Cells expressing low levels of CD45 (green) were present in the ischemic and non-ischemic brain cortex and corresponded to microglial cells. In contrast, cells expressing high levels of CD45 (yellow) were only found in the ischemic hemisphere and in lesser extent in sham group. Further analysis of the CD11b+CD45hi population indicates that neutrophils (Ly-6G+ cells, blue) and pro-inflammatory monocytes (Ly-6Chi cells, orange) are the main cell subpopulations found in brain infiltrates 24 hr after stroke.Please click here to view a larger version of this figure.
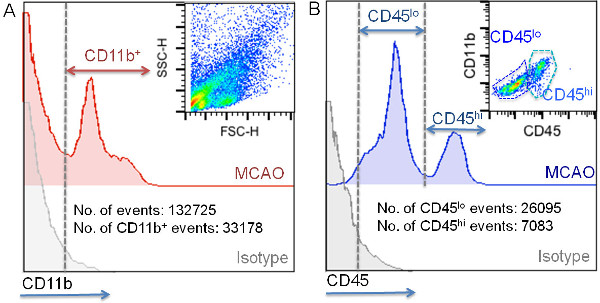
Figure 5: Gating strategies to differentiate resident from infiltrated myeloid cells in the ischemic tissue. CD11b+ cell were first gated according to isotype fluorescence intensity (A). A representative dot plot of cell suspensions of the ischemic brain is shown in the up-right corner of the panel. In addition, typical values for the total number of events and for the number of CD11b+ events acquired using this technique is shown (no. of cells/ ischemic brain hemisphere; (A) CD45 Fluorescence intensity analysis of the CD11b+ cells is shown in panel B. A representative dot plot analysis of CD45 and CD11b expression of the gated CD11b+ subpopulation is shown in the up-right corner of the panel. In addition, the typical number of CD45lo CD45hi cells acquired per ischemic brain hemisphere using this technique is shown (B).
| Parameters used for Cavalieri method | |
| Section Thickness (t) | 30 µm |
| Objective | 10X |
| Slice sampling fraction (ssf) | 1/20 |
| Distance between sections | 600 µm |
| Grid Spacing | 100 µm |
Table 1: Parameters used for the stereological quantification of the infarcted tissue.
| Results | Contralesional | Ipsilesional | Infarct |
| Area (µm²) | 151,460,000 | 155,060,000 | 22,600,000 |
| Volume (µm³) | 90,876,000,000 | 93,036,000,000 | 13,560,000,000 |
| Volume Corrected for Over Projection (µm³) | 89,957,100,000 | 92,046,300,000 | 13,416,600,000 |
| Coefficient of Error (Gundersen), m=0 | 0.068 | 0.077 | 0.067 |
| Coefficient of Error (Gundersen), m=1 | 0.015 | 0.017 | 0.015 |
| Coefficient of Error (Gundersen), alpha(q) | 0.068 | 0.077 | 0.067 |
| % Infarcted Hemisphere | 14.90 | ||
| Brain Oedema (Ips Vol/Cont Vol) | 1.02 | ||
Table 2: Representative examples of contralesional, ipsilesional and infarct volumes by the Cavalieri method using the Stereo Investigator Software.
| Parameters used for The Optical fractionator | |
| Section Thickness (tsf) | 30 µm |
| Objective | 100X |
| Slice sampling fraction (ssf) | 1/10 |
| Counting Frame Height | 40 µm |
| Counting Frame Width | 40 µm |
| X grid size | 230 µm |
| X grid size | 230 µm |
| Safe Guard | 2 µm |
| Optical Disector Height | 14 µm |
Table 3: Parameters used for the stereological quantification of infiltrated neutrophils after brain ischemia with the optical fractionator probe by using the Stereo Investigator Software.
| Estimation of Neutrophils by the Optical Fractionator | |
| Number Of Sampling Sites | 430 |
| Shape Factor | 6.24 |
| Total markers Counted | 166 |
| Estimated Neutrophils by Optical Fractionator | 117,608.03 |
| Coefficient of Error (Gundersen), m=0 | 0.22 |
| Coefficient of Error (Gundersen), m=1 | 0.09 |
Table 4: Representative example of the estimated infiltrated neutrophils after brain ischemia with the Optical Fractionator probe by using the Stereo Investigator Software.
| Cd11b+ | Neutrophils | Monocytes | Microglia | |
| Naive | 25,863 ± 4,575.8 | 473 ± 75.8 | 525 ± 191.4 | 19,012 ± 1,523 |
| Sham 24 hr | 24,563 ± 5,263 | 873 ± 192.5 | 1,124 ± 391.5 | 23,734 ± 2,910 |
| pMCAO 24 hr | 47,922 ± 23,174 | 4,874 ± 748.7 | 4,826 ± 1,345 | 35,395 ± 10,833 |
Table 5: Representative results of the estimated myeloid cells after brain ischemia with the Flow cytometry approach.
Discussion
The cerebral ischemia model introduced here gives highly reproducible infarct volumes determined 24-48 hr and 7 days after MCA ligation by different approaches8,15,17. This MCAO model has a low mortality rate (less than 1%) compared to others, minimizing the number of animals used in studies. A critical step to obtain this low rate of mortality is to maintain proper aseptic conditions to avoid infections which could impair survival after stroke induction. This MCAO model can not only be used as a permanent MCAO model, which is considered a clinical relevant model for translational research18, but also as a transitory model by transient ligation of the CCA and MCA with an slipknot and posterior reperfusion at the desired time19. This method has been successfully used in mice and rats17,20. All this evidence indicates that MCAO by ligation is a high versatile model of cerebral ischemia with multiple applications. A critical step of this technique is that it requires invasive surgery under a stereomicroscope; the craniotomy should be performed very carefully as to not to damage the zygomatic bone as well as the MCA. However, the use of sham animals (which are subjected to the surgical procedure but CCA and MCA ligation is not performed) provides a useful tool to discriminate surgical procedure-dependent effects. The extent of brain injury following this technique can be quantified by several methods. Our protocol of brain sectioning, Nissl staining and subsequent estimation of the volume by Cavalieri allows for an accurate quantification of the damaged region and minimizes the number of mice used in this type of studies since serial brain sections can also be used for different immunohistochemical analysis. For a better performance of this methodology, it is critical to choose the appropriate parameters used in the stereology software (Table 1) which will be necessary for estimating the volume of the different regions by the formula: V = 1/ssf*af*t*ΣPi (Ssf is the slice sampling fraction, t is the mean thickness of the sections, af is the area of the grid spacing and ∑P the number of points hitting the structure).
The distal MCAO by ligation can be useful to characterize the infiltrated leukocyte and immune cell subpopulations8,13 that participate in the inflammatory process following brain injury1-4. Here, we propose two different methodologies for brain immune cell characterization, a precise stereological approach and a flow cytometric analysis for better characterizing multiple leukocytes subpopulations.
Taking advantage of serial brain sectioning, the quantification of the total number of neutrophils can be achieved by the optical fractionator method16, which estimates the total number of cells from the number of cells sampled with a Systematic Randomly Sampled (SRS) set of unbiased virtual counting spaces covering the entire region of interest, in our case the infarct region, with uniform distance between unbiased virtual counting spaces in directions X, Y and Z. This method provides an accurate tool to estimate total neutrophil numbers in the ischemic brain at different times after ligation. Although it has not been shown in this study, this protocol can also be used for estimation of the different neutrophil subpopulations after ischemia21 and for an accurate quantification of any other cell population found in the ischemic brain like other infiltrated leukocytes (monocytes/macrophages) and also for estimating surviving neurons or even for neurogenesis quantification after stroke. The most important step for an accurate estimation in the desired area is the selection of the appropriate parameters, as the ones shown in the Table 3 for neutrophil quantification in the ischemic area. These parameters will be used for the stereology software to calculate the total positive cell number (N) by using the equation N = ΣQ- x 1/ssf x 1/asf x 1/tsf (ΣQ- is the total number of cells counted with the fractionator, ssf is the section sampling fraction, asf is the sampling fraction area, and tsf is the sampling fraction thickness)5. Although this methodology is slower than other quantification techniques (for example, analysis of neutrophil markers by mg of tissue, densitometry of representative images or number of neutrophils per field), it has the advantage to be an unbiased and a solid technique which provides a precise quantification of cell numbers.
The brain leukocyte isolation approach allows for a simultaneous identification and quantification of several immune cell subtypes without the need to bias the system by in vivo staining or genetic manipulations. Subsequent cell sorting from the characterized myeloid populations or their immunomagnetic separation can be used for multiple downstream applications, such as further studies on gene or protein expression. The accurate characterization of neutrophils, monocytes and microglia obtained with this method provides high specificity with respect to existing methods such as the immunohistochemical studies, an advantage that allows allocating specific functions to the different myeloid cells that mediate brain innate immune response. In addition, it can be further extended to characterize other brain populations with the appropriate label, like blood born macrophages (CD11b+CD45hiCD68+), and it can be applied for the study of other CNS pathologies or injuries. Therefore this technique provides an essential tool to explore the heterogeneity of the inflammatory response in the brain. A main limitation of this technique resides on the preparation of the leukocyte suspensions from fresh brain tissue, which can alter the activation state of the cells or their antigen alteration. Although this technique allows a more detailed qualitative characterization compared to immunohistochemical studies, it provides a less accurate quantification based on cell isolation. Despite this, the efficiency of our cell isolation protocol is similar to other published methodologies9 and it can be efficiently used to detect differences in the number of brain immune cells between control and MCAO groups or even between MCAO groups subjected to different treatments8.
Critical steps of this protocol are the tissue dissection, the tissue disruption procedure, and the myelin removal. Regarding the tissue collection, a normalization step can be included (by weighing the tissue collected) to avoid variability due to different dissection performances. In addition, normalization between different MCAO groups can also occur through infarct volume (previously determined by Magnetic Resonance). Another way to solve this problem is to use the whole ipsilateral hemisphere of both ischemic and control groups, or even use the contralateral hemisphere of the ischemic mouse as a control to minimize the number of animals used. While this approach avoids differences between each dissection, it has a main disadvantage; a dilution factor is added by increasing the total number of cells but not the number of myeloid cells which are exclusively located in the core and peri-infarct areas of the ipsilateral cortex. Regarding tissue disruption, this protocol illustrates the steps for the mechanical disruption of brain cells, avoiding enzymatic treatments and preventing surface antigen alteration9,22, an essential issue for further qualitative and quantitative analysis of the inflammatory cell subpopulations. In addition to the preparation of the cell suspension of interest, myelin removal from brain samples is a highly recommended step to avoid interference with downstream applications, such as immunomagnetic cell separation or flow cytometry23,24. This can be accomplished using different methods, such sucrose or Percoll gradients, or anti-myelin beads. Here, and based on previous studies that compare different methods for brain cell suspension isolation, mechanical disruption in combination with Percoll usage to remove myelin is used to improve cell yields and viability25.
Disclosures
The authors declare that they have no competing financial interests.
Acknowledgements
This work was supported by grants from the Spanish Ministry of Economy and Competitiveness CSD2010-00045 (MAM), SAF2012-33216 (MAM), SAF2011-23354 (IL) and RENEVAS RD06/0026/0005 (IL), and from the Local Government of Madrid S2010/BMD-2336 (MAM) and S2010/BMD-2349 (IL). IB and MIC are fellows of the Spanish Ministry of Economy and Competitiveness.
Materials
| Name | Company | Catalog Number | Comments |
|---|---|---|---|
| Photonic Led F1 | WPI | 571329-8 | Equipment |
| Temp Controller | Panlab | HB 101/2 | Equipment |
| Volvere GX | NSK | Ne22L | Equipment |
| Microscope | WPI | PZMIII-BS | Equipment |
| Stainless Steel Burrs | FST | 19007-14 | Surgical material |
| Forceps Dumont #5/45 | FST | 11251-35 | Surgical material |
| Forceps Dumont #5SF | FST | 11252-30 | Surgical material |
| Suture 6/0 | LorcaMarin | 55108 | Surgical material |
| Suture 9/0 | LorcaMarin | 61966 | Surgical material |
| Nikon Eclipse | Nikon | TE300 | Equipment |
| Isoflurane | Esteve | 571329-8 | Chemical |
| Sodium Pentobarbital | Vetoquinol | 570681 | Chemical |
| Freezing microtome | Leica Microsystems GmbH | SM2000R | Equipment |
| Superfrost slides | Thermo Scientific | 2014-07 | Lab material |
| Cresyl violet acetate | Sigma | C5042 | Chemical |
| Microscope | Nikon | Nikon Eclipse TE300 | Equipment |
| XYZ motorized computer stage and controller | Ludl electronics Products | Equipment | |
| Stereo Investigator System | Microbrightfield | Version 7.003 software | Software |
| 5 ml Tissue Grinder, Potter-Elv with teflon pestle | Thomas Scientific | 0913X70 | Lab Material |
| Polypropylene 50 ml Oak Ridge Centrifuge Tube | Nalgene | 3119-0050 | Lab material |
| Percoll | Sigma | p1644-100 | Chemical |
| RPMI 1640 | Lonza | BE12-702F | Chemical |
| Beckman Ultracentrifugue | Beckman Coulter | Equipment | |
| Beckman Coulter ultracentrifuge rotor 45 Ti | Beckman Coulter | Equipment | |
| BD Sterile Cell Strainer, 40 Micron | BD | BD 352340 | Lab Material |
| Bovine Serum Albumin | Sigma | A3733-500G | Reagment |
| FcR Blocking Reagent, mouse | Miltenyi | 130-092-575 | Antibody |
| CD11b-FITC, human and mouse | Miltenyi | 130-098-085 | Antibody |
| CD45-PE, mouse | Miltenyi | 130-102-596 | Antibody |
| Anti-Ly-6G-APC, mouse | Miltenyi | 130-102-936 | Antibody |
| PerCP/Cy5.5 anti-mouse Ly-6C | Biolegend | 128012 | Antibody |
| BD FACS Flow | BD | 342003 | Reagment |
| BD FACSCalibur; 4-color | BD | 342975 | Equipment |
| BD Cell Quest Pro Software | BD | Software | |
| FlowJo software | Treestar inc. | Software |
References
- Chamorro, A., et al. The immunology of acute stroke. Nature Reviews. Neurology. 8, 401-410 (2012).
- Iadecola, C., Anrather, J. The immunology of stroke: from mechanisms to translation. Nat Med. 17, 796-808 (2011).
- Ramlackhansingh, A. F., et al. Inflammation after trauma: microglial activation and traumatic brain injury. Annals of Neurology. 70, 374-383 (2011).
- Jin, R., Yang, G., Li, G. Inflammatory mechanisms in ischemic stroke: role of inflammatory cells. J Leukoc Biol. 87, 779-789 (2010).
- West, M. J., Slomianka, L., Gundersen, H. J. Unbiased stereological estimation of the total number of neurons in thesubdivisions of the rat hippocampus using the optical fractionator. The Anatomical Record. 231, 482-497 (1991).
- Charleston, J. S. Estimating cell number in the central nervous system by stereological methods: the optical disector and fractionator. Current Protocols in Toxicology. 12 (Unit 12.6), (2001).
- Begega, A., et al. Unbiased estimation of the total number of nervous cells and volume of medial mammillary nucleus in humans. Experimental Gerontology. 34, 771-782 (1999).
- Cuartero, M. I., et al. N2 Neutrophils, Novel Players in Brain Inflammation After Stroke: Modulation by the PPARgamma Agonist Rosiglitazone. Stroke; a. Journal of Cerebral Circulation. 44 (12), 3498-3508 (2013).
- Campanella, M., Sciorati, C., Tarozzo, G., Beltramo, M. Flow cytometric analysis of inflammatory cells in ischemic rat brain. Stroke. 33, 586-592 (2002).
- Carson, M. J., Reilly, C. R., Sutcliffe, J. G., Lo, D. Mature microglia resemble immature antigen-presenting cells. Glia. 22, 72-85 (1998).
- Perego, C., Fumagalli, S., De Simoni, M. G. Temporal pattern of expression and colocalization of microglia/macrophage phenotype markers following brain ischemic injury in mice. J Neuroinflammation. 8, 174(2011).
- Denker, S. P., et al. Macrophages are comprised of resident brain microglia not infiltrating peripheral monocytes acutely after neonatal stroke. Journal of Neurochemistry. 100, 893-904 (2007).
- Ballesteros, I., et al. Rosiglitazone-induced CD36 up-regulation resolves inflammation by PPARgamma and 5-LO-dependent pathways. Journal of Leukocyte Biology. 95 (4), 587-598 (2013).
- Michel, R. P., Cruz-Orive, L. M. Application of the Cavalieri principle and vertical sections method to lung: estimation of volume and pleural surface area. J Microsc. 150, 117-136 (1988).
- Hernández-Jiménez, M., et al. Silent Information Regulator 1 Protects the Brain Against Cerebral Ischemic Damage. Stroke. 44 (8), 2333-2337 (2013).
- Gundersen, H. J., et al. The new stereological tools: disector, fractionator, nucleator and point sampled intercepts and their use in pathological research and diagnosis. APMIS. 96, 857-881 (1988).
- Godino, M. E. C., et al. Amelioration of ischemic brain damage by peritoneal dialysis. J Clin Invest. 123, 4359-4363 (2013).
- Hossmann, K. A. The two pathophysiologies of focal brain ischemia: implications for translational stroke research. J Cereb Blood Flow Metab. 32, 1310-1316 (2012).
- García-Yébenes, I., et al. Iron overload, measured as serum ferritin, increases brain damage induced by focal ischemia and early reperfusion. Neurochem Int. 61, 1364-1369 (2012).
- Sobrado, M., et al. Synthesis of lipoxin A4 by 5-lipoxygenase mediates PPARgamma-dependent, neuroprotective effects of rosiglitazone in experimental stroke. J Neurosci. 29, 3875-3884 (2009).
- Cuartero, M. I., et al. N2 Neutrophils, Novel Players in Brain Inflammation After Stroke: Modulation by the PPARγ Agonist Rosiglitazone. Stroke. 44, 3498-3508 (2013).
- Ford, A. L., Foulcher, E., Goodsall, A. L., Sedgwick, J. D. Tissue digestion with dispase substantially reduces lymphocyte and macrophage cell-surface antigen expression. Journal of Immunological Methods. 194, 71-75 (1996).
- Pfenninger, C. V., et al. CD133 is not present on neurogenic astrocytes in the adult subventricular zone, but on embryonic neural stem cells, ependymal cells, and glioblastoma cells. Cancer Research. 67, 5727-5736 (2007).
- Tham, C. S., Lin, F. F., Rao, T. S., Yu, N., Webb, M. Microglial activation state and lysophospholipid acid receptor expression. International Journal of Developmental Neuroscience : the Official Journal of the International Society for Developmental Neuroscience. 21, 431-443 (2003).
- Nikodemova, M., Watters, J. J. Efficient isolation of live microglia with preserved phenotypes from adult mouse brain. Journal of Neuroinflammation. 9, 147(2012).
Reprints and Permissions
