This paper describes the cryo-electron microscopy methodology, which is used to obtain high quality microscopic images of macromolecules in their near-native state. The method yields images suitable for further computerized processing using the single particle approach, devised to generate the 3D reconstruction of a macromolecule.
Method Article
Do's and Don'ts of Cryo-electron Microscopy: A Primer on Sample Preparation and High Quality Data Collection for Macromolecular 3D Reconstruction
In This Article
Summary
Abstract
Cryo-electron microscopy (cryoEM) entails flash-freezing a thin layer of sample on a support, and then visualizing the sample in its frozen hydrated state by transmission electron microscopy (TEM). This can be achieved with very low quantity of protein and in the buffer of choice, without the use of any stain, which is very useful to determine structure-function correlations of macromolecules. When combined with single-particle image processing, the technique has found widespread usefulness for 3D structural determination of purified macromolecules.
The protocol presented here explains how to perform cryoEM and examines the causes of most commonly encountered problems for rational troubleshooting; following all these steps should lead to acquisition of high quality cryoEM images. The technique requires access to the electron microscope instrument and to a vitrification device. Knowledge of the 3D reconstruction concepts and software is also needed for computerized image processing. Importantly, high quality results depend on finding the right purification conditions leading to a uniform population of structurally intact macromolecules.
The ability of cryoEM to visualize macromolecules combined with the versatility of single particle image processing has proven very successful for structural determination of large proteins and macromolecular machines in their near-native state, identification of their multiple components by 3D difference mapping, and creation of pseudo-atomic structures by docking of x-ray structures. The relentless development of cryoEM instrumentation and image processing techniques for the last 30 years has resulted in the possibility to generate de novo 3D reconstructions at atomic resolution level.
Introduction
The goal of cryoEM is to obtain electron microscopic images of macromolecules in their native hydrated state. By virtue of embedding the macromolecule in vitrified water, a frozen-hydrated sample can be directly introduced and visualized in the TEM instrument. Vitrification, achieved by flash freezing (10,000 oC/sec), freezes the sample without water crystallization and ensures that molecular rearrangements during freezing are insignificant. The excess of electron scattering of the sample with respect to the surrounding buffer provides a small but sufficient contrast to see the macromolecule in the absence of any stain 1. Computerized image processing can then be used to recreate the macromolecule’s 3D structure. Large macromolecules in the ~500 kDa- multi MDa range are ideal samples for cryoEM (representing over 80% of the Electron Microscopy Data Bank (EMDB) entries); these include proteins, protein complexes, protein-nucleic acid complexes, and membrane proteins embedded in a bilayer. These macromolecules are less likely to be crystallized (with less than 2% entries in the PDB database) yet it is often the case that smaller pieces solved by x-ray crystallography or NMR can be docked into the 3D envelope created by cryoEM. On the other hand, some of the largest structures solved by cryoEM are identifiable within the full cell by thin-section TEM 2. Thus, cryoEM effectively bridges the size and resolution gap between subcellular and atomic structures.
CryoEM reflects better the macromolecule’s native structure than the more classic method of negative staining (NS), where the macromolecule is dehydrated and surrounded by a layer of heavy metal stain whereby the region of stain exclusion creates a strongly contrasted “negative“ image 3. In both cases the electron beam produces 2D projection images of the macromolecules, called particles, where the shape depends on the orientation of the macromolecule with respect to the electron beam. Many particles, at least ~1,000 and with no upper limit, can be analyzed on the computer with 'single particle analysis' (SPA) software to increase the signal to noise ratio (SNR) though averaging, and to find the particle’s spatial orientation parameters needed to recreate the macromolecule’s 3D structure by back projection 4-7. NS, with higher SNR, is used for preliminary sample characterization and to generate a de novo 3D reconstruction; its resolution rarely exceeds 20 Å, which is imposed by the dehydration and size of the heavy metal grain. In general, for cryoEM 3D structural determination, a low-resolution 3D reconstruction is first obtained from NS and then cryoEM is used to refine this low-resolution initial map to further study the macromolecule in its native hydrated state, to see its internal structure, and to increase its resolution. Note that if the NS model was distorted (the most common example is flattening resulting from dehydration 8) and the cryoEM particles had low SNR, then the distortion could carry into the cryoEM model (the model-bias artifact, which is common in low SNR datasets 9). Structural distortion would result in mismatch between the NS and cryoEM raw particles and between the raw cryoEM particles and corresponding projections of the 3D model orthogonal to the flattening direction. Model bias may resolve by itself as the 3D model undergoes successive refinement cycles. Should that not occur, which would be detected as lack of correspondence between raw cryoEM particles and corresponding projections from the 3D model, then a de novo model should be constructed from the cryoEM data. A good approach could be to use the angular reconstitution algorithm 10, which may yield several possible 3D volumes, and then use the NS 3D model to select the best possible cryoEM model that will be further refined 11. An even better strategy is to increase the SNR of the cryoEM dataset (see dedicated section in the Discussion).
The biochemical quality of the purified macromolecule has an utmost influence in the final outcome. The macromolecule, purified from tissue or expressed in heterologous systems, needs to have a high degree of purity and to be structurally intact. It should neither form aggregates nor should it disaggregate. To define a particular conformation, the preparation conditions should promote a uniform conformational state. To study complexes, it is optimal that their kD is in the nM range, otherwise fixatives have been successfully used to stabilize lower affinity interactions 12,13.
Unprocessed cryoEM images yield valuable information on the dimensions, general outline, state of aggregation/multimerization, homogeneity, and internal structure of the macromolecule. Nevertheless the potential of the technique is vastly enhanced with image processing. A 3D structure reveals the macromolecule’s overall architecture, 3D location of ligands and subunits, conformational changes, and enables docking of atomic structures determined by x-ray crystallography or NMR. The amount of information of a 3D reconstruction increases stepwise as the resolution is increased: in general 15-20 Å resolution permits unambiguous docking of atomic structures, at 9-10 Å alpha helices are visible as rods, at 5 Å it is possible to discern beta sheets, and at resolutions of 3.5 Å and better it is possible to build an atomic model 14.
The possibility to obtain informative images and a 3D reconstruction using SPA from relatively small quantities of sample make cryoEM an attractive technique, as 3-5 µl of at least 0.05 mg/ml are sufficient to prepare one TEM grid. The minimum instrumental requirements for cryoEM are a home-made or commercial cryo-plunger, an electron microscope with ultra high vacuum, image recording media and low-dose kit, a cryo-holder with its pumping station, a glow discharge apparatus, and an evaporator. Non-essential but further desirable features on the TEM are CCD camera (present in all modern TEMs) or a direct electron detector, field emission gun (FEG), energy filtering, and high throughput data collection software. This software in principle enables collecting tens of thousands of particles in a single cryoEM session 15, however the increased data storage needs and subsequent supervised post-processing time need to be taken into consideration. FEG combined with contrast transfer function (CTF) correction underlies most 3D reconstructions that reached resolution sufficient to visualize alpha helices. At that point, the level of resolution is also sample-dependent: reaching 10 Å resolution is less common for membrane proteins whereas if high order of symmetry is present then atomic resolution is more achievable. The recent development of direct electron detectors has enabled atomic resolution even for macromolecules with low (4x) or no symmetry, where the quality of the cryoEM electron density maps matches these derived from x-ray diffraction data 16,17.
Practical examples illustrating the capabilities of the technique are provided here for four important types of macromolecules where cryoEM has a continuing chief role in their structural determination. (i) With their icosahedral symmetry that increases the dataset by 60-fold and their large size that permits faithful and reproducible alignment, the structures of several icosahedral viruses have been resolved to near-atomic resolution by cryoEM followed by SPA 18. We show an example of a class of icosahedral viruses, the adeno-associated viruses (AAVs), for which near-atomic structures by cryoEM and by cryoEM/x-ray hybrid methods exist 19,20. (ii) Macromolecules with helical structure include microtubules, filaments and viruses. Their repetitive units along the helical axis can be analyzed by a more complex version of SPA adapted to the helical geometry 21. In the example we show tobacco mosaic virus (TMV), an RNA virus that has been solved to atomic resolution by cryoEM 22. (iii) Large soluble proteins have been amply studied. Among these, macromolecules forming symmetrical multimeric cylinders constitute a recurring architecture often solved at subnanometer resolution 23,24. Here we show images of KLH, an invertebrate oxygen carrier, where a hybrid molecular model was created from cryoEM/x-ray crystallography hybrid methods 25. (iv) Membrane proteins are an important class of proteins; they constitute about 1/3 of the proteins coded by the human genome, yet they are difficult to characterize structurally due to complexities associated with transmembrane domain stabilization 26, constituting less than 1.5% of the structures solved by any structural technique combined. The role of cryoEM and 3D reconstruction in their structural determination is exemplified with the ryanodine receptor (RyR), a large eukaryotic intracellular Ca2+ channel important in muscle contraction and brain signaling. The highest resolution cryoEM structures to date, with 10 Å resolution, reveal secondary structure 27.
Protocol
1. Cryo-holder Preparation and Maintenance
NOTE: The dry pumping station, consisting of a turbo pumping station and one or more cold stage controllers, is primarily used for three purposes: a) It is a safe place to store the cryo holders when they are not being used. The proper way to store the holders is to leave them in the station under vacuum. b) To evaporate the frost and humidity buildup that occurs when the liquid nitrogen is removed from the dewar and the tip of the cryo holder is exposed; this is achieved with the warm-up cycle. c) To regenerate the zeolite desiccant, and to achieve a high vacuum in the cryoholder dewars. This is necessary for holding a constant temperature when doing cryo electron microscopy.
- Warm-up Cycle.
- Insert the cryo holder into one of the pumping ports of the pumping station. Hook up one of the evacuation tubes to the metal outlet underneath the vacuum valve of the holder. Make sure that all valves on the station (V1, V2, and V3) and on the cryo holder are closed.
- Turn on the cold stage controller and connect it to the holder through the control cord. Turn on the power switch of the turbo pumping station.
- Start the Warm-up cycle option in the cold stage controller. When the vacuum in the turbo pumping station reads 10-3 Torr or better, open the butterfly valve V2, wait until the vacuum stabilizes, and then open the butterfly valve V1.
- Run the warm up cycle for around 30 min until the temperature in the holder is stable above 20 °C. Close V1, and then stop the cycle.
- Zeolite cycle. Run the Zeolite Cycle Between 4 hr and O/N Before a CryoEM Session, and Once a Week if Not in Use.
- Start the Zeolite cycle option and select the necessary time to attain a good vacuum, in the range of 1-2 x 10⁻⁴ Torr, and thus long hold time. When the vacuum reaches 10-3 Torr, open the dewar evacuation valve, V3. The pumping station will then evacuate the line to the holder; wait until the vacuum stabilizes.
- Open the valve on the cryo holder. When the cycle is complete, close the valves in the opposite order in which they were opened: the valve on the holder, then V3, V2, and finally V1. Turn off the turbo pumping station and the cold stage controller, and disconnect the cryo holder from the cold stage controller and the turbo pumping station.
2. Grid Preparation
- Cleaning.
NOTE: When using commercial holey grids, it is recommended to clean them before use, in order to remove any residual polymer that was used in the fabrication process. Do this in a glass Petri dish with 5 layers of filter paper laid at the bottom.- Place the grids on the filter paper with the holey carbon side facing up.
- Using a glass Pasteur pipette, wet the paper with several drops of chloroform around the grids until they just start floating.
- Cover the Petri dish with the lid slightly open in a fume hood O/N.
- NOTE: the thin carbon support (steps 2.2-2.3) can be omitted as the ice layer can be directly formed across the small holes in the holey carbon grid.
- Using a pair of tweezers, cleave a piece of mica to expose two new surfaces. Place the new exposed surfaces of mica face-up on a white piece of paper in a Petri dish.
- Place the Petri dish in the bell jar of a carbon evaporator. Start the pump down sequence until vacuum is below 2 x 10⁻⁶ Torr. To evaporate any impurities on the surface of the carbon rod, perform a pre-evaporation with the Petri dish covered. Then air the bell jar and remove the cover from the Petri dish.
- Perform the pump down sequence until the vacuum is below 10-6 Torr and coat the mica with a thin layer (~5 nm) of carbon. Use eye protection during carbon evaporation. Monitor the thickness of the carbon film by the resulting darkness on the paper that had been placed under the mica sheets.
- Transfer the Thin Carbon to the TEM Grid.
- Cut a 0.5 x 1 cm piece of coated mica and float the carbon off onto the flat surface of filtered, de-ionized water. Use optical lens paper to get a flat water surface. Using the tweezers, put the holey carbon side of the grid in contact with the upper surface of the floating carbon layer and pick it up.
- Repeat Steps 2.3.1 and 2.3.2 until a sufficient number of grids are prepared.
- Glow Discharge.
NOTE: The glow discharge converts the naturally hydrophobic carbon-coating layer of the grids into hydrophilic. This step is optional.- Place the grids with the carbon side facing up on a 7.5 x 2.5 cm glass slide covered with Parafilm. Place it into the chamber of the glow-discharge equipment and close the chamber.
- Pump the bell jar and glow-discharge for 20 sec at 25 mA and 7 x 10⁻² mbars.
NOTE: During this time a light purple glow becomes visible. Remove the glass slide with the grids and use them within 1 hr, otherwise, they will need to be glow discharged again.
3. Sample Plunge-freezing
NOTE: Use safety glasses and appropriate footwear when using this instrument to protect against liquid nitrogen and ethane splashes.
- Turn on the plunge-freezing apparatus. Fill humidifier reservoir with distilled water. Set the desired temperature, relative humidity and plunging conditions for blot time, blot force and adsorption time (22 °C, 95%, 2 sec, 2 and 40 sec in the example presented here). Place new blotting filter paper.
- Cool the ethane container down by filling the outer reservoir with liquid nitrogen until stability is achieved (about 10 min). Once the liquid nitrogen stops boiling, place the tip of the tube coming from the ethane tank in the inner chamber and open the valve very slowly. Liquefy the ethane in the inner chamber and fill it to 1 mm from the top. Avoid freezing the ethane. CAUTION: ethane is extremely flammable and explosive.
- Make sure tweezers are aligned within the plunge freezing apparatus.
- Turn on humidity. Load a grid onto the tweezers, and load 3-5 µl of sample onto the carbon surface (dull side) of the holey grid. Wait for the sample to adsorb to the grid and perform the blotting to achieve a thin liquid layer.
- Flash-freeze the grid by plunging it into the liquid ethane. Remove the tweezers-grid assembly from the liquid ethane holding the tweezers steadily, and transfer it to the outer chamber with liquid nitrogen. Transfer the grid to a small grid box immersed in the liquid nitrogen. Make sure to keep the vitrified sample in liquid nitrogen all the time during transfer to either the storage tank or to the cryo holder.
NOTE: Grid boxes can be stored in a large capacity (35-50 L) liquid nitrogen dewar for at least 1 year. For convenient storage they can be placed in a 50 ml Falcon tube with two drilled holes at the top and a fishing line attached to its cap that can be pulled from the mouth of the dewar.
4. Transfer the Cryo-grid to the TEM
- Insert the cryo holder into the cryo-transfer workstation. Take care not to damage the tip of the holder during insertion. Check for the presence of small fibers and dust on the rod and the O-ring of the cryo holder using a loupe, if there is any remove it with optical lens paper.
- Fill the dewar of the cryo holder and the workstation vessel with liquid nitrogen. Avoid spilling the liquid nitrogen by using the trapped funnel that comes with the workstation.
- Connect the cryo holder to the cold stage controller to monitor the temperature, and keep adding liquid nitrogen until the temperature stabilizes at around -194 °C. Make sure that the level of liquid nitrogen is under the level of the vacuum seal both in the workstation vessel and the cryo holder dewar. Pre-cool the grid tweezers, the clip ring and the blunt end of the clip ring tool on the workstation. Also pre-cool a set of large tweezers and a screwdriver in another dewar filled with liquid nitrogen.
- Quickly transfer the cryo grid box containing the frozen hydrated grids to the liquid nitrogen in the workstation using the large tweezers. Open the cryo grid box with the screwdriver, take the frozen hydrated grid and place it into the sample holder slot.
- Place the clip ring on top of the grid and gently press it with the blunt end of the clip ring tool until it is firmly seated in place. Close the cryo-shutter. Remove the tools and cryo grid box from the workstation.
- Move the entire workstation with holder and grid to the microscope console in order to minimize the transfer time of the grid in room air.
- Top off the TEM anti-contaminator with liquid nitrogen, which had been previously filled and cooled down for at least 20 min. Pre-tilt the microscope stage to -60°.
NOTE: This will minimize loss of liquid nitrogen as the holder is inserted into the airlock. - Begin the pre-pump airlock cycle on the microscope. Make sure that the valve to the electron gun is closed (especially if it is an FEG TEM). Wait for the pre-pump airlock sequence to finish (about 2 min) before inserting the cryo holder.
NOTE: This is indicated by the red light on the stage being extinguished. - Insert the holder into the airlock and rotate it 90° clockwise; connect the cold stage controller cord to the cryo holder to monitor the temperature. Wait again until the red light is extinguished and rotate both the stage and the holder back into the 0° position to insert the holder into the TEM’s high vacuum column.
- Make sure that the temperature never goes above -160 °C to avoid formation of crystalline ice.
- Refill the dewar of the cryo holder. Wait 15 – 45 min until the holder has thermally equilibrated and the TEM vacuum has recovered before recording images.
- If bubbling of the liquid nitrogen is detected, change the liquid nitrogen filling height, or gently touch the bubbling origin with a cotton swab.
5. Low-dose Data Collection
NOTE: The low-dose data collection technique is used to minimize the electron radiation damage to the sample by limiting the exposure to 20 electrons/Å2. This is achieved by alternating between three configurations: “search”, with low magnification (~5,000X) and wide field of view, “focus”, with high magnification (~150,000X) and small field of view, and “exposure”, with the desired final magnification and containing the area of interest to be recorded. Blank the beam in between modes.
- Set Up the TEM and the Low-dose Program
- Retract the cryo-shutter and open the column valves.
- Center the stage and set the eucentric height (Z) using the alpha wobbler to rock the stage ± 15°. Adjust the Z position until there is no appreciable movement while the stage is rocking. Activate the low-dose program and select the detector for each mode.
- In exposure mode find an area of the grid that has no carbon, adjust the illumination by selecting the optimal condenser aperture and spot size so that the area to be recorded is fully illuminated. Be sure to spread the beam in the overcondensation direction.
- In search mode, find a small feature that will be easily identifiable at higher magnification. In exposure mode, center this feature with the joystick (the x-y stage controller). Start at lower magnification if the feature is not in the field of view.
- In search mode, bring this feature to the center of the field using the low dose x-y image shift controls. Go to exposure mode and move the feature along the tilt axis using the joystick until it is out of the area to be recorded (0.5 - 3 microns). Go to focus mode and center the feature using the x-y image shift controls. Start at lower magnification if the feature is not in the field of view.
- Keep the beam centered at all times.
- Data Collection
- Retract the cryo-shutter and open the column valves. Activate the low dose program.
- In search mode, identify a grid square containing thin, homogeneous ice.
- Select a suitable hole and place it in the center of the field. Switch to focus mode and focus the image. Then underfocus the image between 0.5 - 4.5 microns.
- Switch to exposure mode and record the image.
- Switch to search mode and repeat steps 5.2.3-5.2.4. Move across the grid square avoiding pre-exposing good holes to be recorded.
- Finish the grid square and move to another good one.
- Readjust height (Z) and continue data collection.
Results
Careful execution of all the protocol steps outlined in Figure 1 enables visualization of frozen hydrated, non-stained macromolecules. Results for four representative specimens with different structural characteristics are shown. Their microscopic images obtained by the methods of NS and cryoEM are compared (Figure 2). (i) NS images of AAV5 reveal virus-like particles of around 130 Å diameter. The coexistence of full and empty structures corresponds to broken (that allow stain entry) and structurally intact capsids, respectively. CryoEM shows uniformly empty structures; indeed these viral particles do not contain genetic material 28. NS shows predominant round particles whereas cryoEM shows mostly hexagonal particles, reflecting their icosahedral form. (ii) Images of the helical TMV show rods of 180 Å diameter and variable length, often longer than 0.1 µm, with a helical repeat of 23 Å visible both in NS and in cryoEM. The 40 Å central channel is filled with stain in the NS images and empty in the cryoEM images. (iii) Native KLH, a didecamer of 8 MDa, assembles in characteristic barrels of 350 Å diameter and 400 Å length. NS and cryoEM reveal KLH’s rectangular side views and circular end-on views. Both techniques reveal six striations perpendicular to the symmetry axis and the equally spaced morphological units within each tier. CryoEM reveals an empty inner structure. (iv) Ryanodine receptor, a large tetrameric intracellular channel of 2.26 MDa, is seen as a square of 275 x 275 Å2. Intricate surface features such as a central cross and a central depression manifest as stain accumulation by NS, and as lower density regions by cryoEM. While NS shows similar contrast in all four tested samples, comparison of the cryoEM panels exposes the lower SNR (contrast) of RyR1 due to the presence of detergent to solubilize this membrane protein.
Typical examples of cryoEM artifacts are shown for RyR1: crystalline ice, ice contamination, astigmatism, and web-like structures (Figure 3). Their causes and prevention are further described in the discussion section.
SPA and 3D reconstruction of frozen-hydrated RyR1 reveals its fourfold symmetric structure, which reflects the protein’s homotetrameric organization (Figure 4A). The cytoplasmic domain forms a square prism of 275 x 275 x 120 Å3 and contains several reproducible globular domains forming a scaffold-like structure. The transmembrane domain forms a smaller tapered square prism with maximum dimensions 115 x 115 x 60 Å3. At 10 Å resolution it is possible to visualize alpha helices (Figure 4B). 3D difference mapping can reveal the position of important ligands, in this case the 3D difference map of FKBP12, a 12 kD protein considered a subunit of RyR1, is superimposed on RyR1 (Figure 4C) 29. Finally, conformational changes provide a dynamic view of the macromolecule. In this case RyR1 previously stabilized in either closed or open conditions reveals a mass translocation from the closed to the open state (Figure 4D) 27.
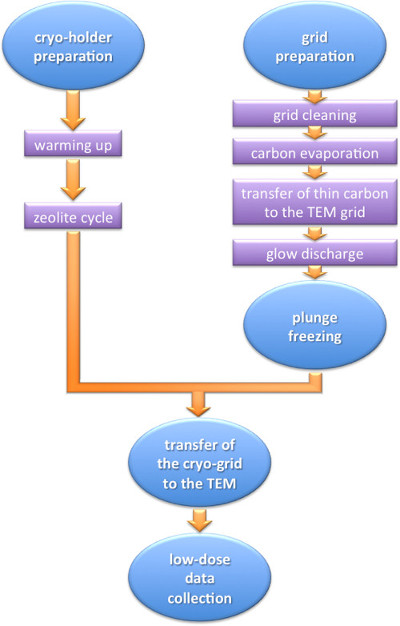
Figure 1. Flow diagram of the cryo electron microscopy technique. The diagram highlights the main steps of the protocol.

Figure 2. Comparison of NS and cryoEM for a variety of samples. (A) AAV5, an icosahedral virus. (B) TMV, a helical virus. Insets show the helical repeat, of 23 Å. (C) Native KLH. (D) RyR1; representative views are highlighted (f, fourfold view and s, side view). All samples are imaged under low dose conditions and at the same magnification of 50,000X an under an accelerating voltage of 200 kV. Scale bars, 10 nm. All NS samples are on carbon support, cryoEM samples A, C, D are on thin carbon over quantifoil, and cryoEM sample B is directly over quantifoil holes. Please click here to view a larger version of this figure.
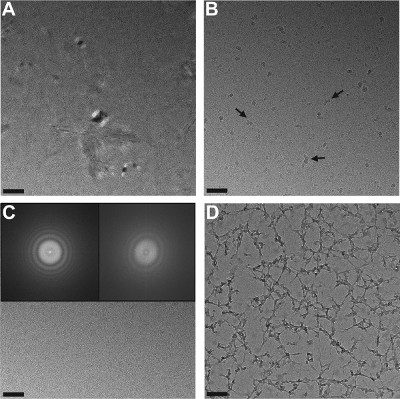
Figure 3. Gallery of images showing common cryoEM artifacts on an RyR1 cryoEM sample. (A) Crystalline ice. (B) Ice contamination (arrows). (C) Astigmatism. RyR1s in the astigmatic image are barely visible. The inset on the right shows the power spectrum of the image with asymmetric Thon rings. The inset on the left shows the power spectrum of a non-astigmatic image for reference. (D) Web-like structures. Please click here to view a larger version of this figure.
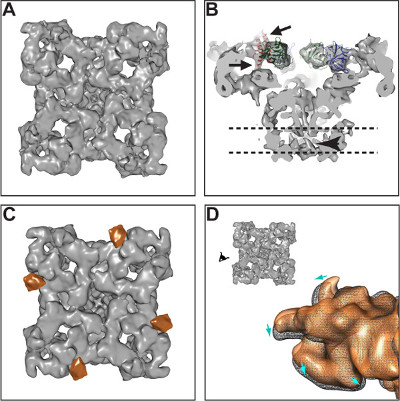
Figure 4. CryoEM and 3D reconstruction of the ryanodine receptor. (A) Isosurface representation. (B) Docking of a crystal structure of RyR1’s N-terminus 30 showing good agreement between the atomic coordinates and the cryoEM envelope; arrows point to two alpha helices that protrude from the structure. Arrowhead indicates one of the four helices that surround the pore of the ion channel. The dotted lines indicate the boundaries of the membrane. (C) RyR1 and 3D location of the FKBP12 ligand (orange color). (D) Conformational changes of RyR1 in going from the closed (orange) to the open (black mesh) conformation. Please click here to view a larger version of this figure.
Discussion
TEM followed by SPA has contributed many macromolecular 3D structures, nearing 2,000 entries in the EMDB by mid 2014. In general, for a given macromolecule, a low-resolution 3D structure is first determined from NS data, which may be followed by a higher-resolution cryoEM 3D structure. The high contrast of the molecular boundaries provided by NS, which facilitates the first 3D reconstruction, is later refined by cryoEM with its ability to map the internal structure of the macromolecule in its fully hydrated state, and the possibility to attain much higher resolution. Another advantage of cryoEM is the elimination of dehydration stress that could result in collapse of the macromolecule. In addition, there is the possibility to omit the carbon support, which eliminates possible surface absorption effects and shows the conformation that the macromolecule adopts in solution. Cryo-negative staining, a combination of cryoEM and NS, affords high contrast in a fully hydrated specimen and can also lead to 3D reconstruction using SPA, however it has been less frequently used, with less than 10 EMDB entries, in part because the stain itself may interfere with the integrity of the macromolecule 31. Two other TEM techniques conducive to 3D reconstruction are 2D electron crystallography and electron tomography. 2D electron crystallography requires a planar or tubular crystal; the crystal's electron diffraction is used for 3D reconstruction potentially leading to atomic resolution 32. In electron tomography of vitrified or traditionally fixed specimens, a macromolecule or sub-cellular component is rotated inside the TEM for subsequent tomographic reconstruction 33, with the advantage that singular objects can be reconstructed; however at present this technique has a resolution limit ranging from 40 to 20 Å 34,35. Among all these molecular TEM techniques, SPA of NS and cryoEM data has been the most widely used. The protocol illustrated here is dedicated to obtaining cryoEM images suitable for SPA analysis; nevertheless most of the protocol is also applicable to cryoEM of 2D crystals and tomographic samples.
A successful cryoEM session depends on the combined success of many critical steps; important aspects to keep in mind, explanation of common cryoEM artifacts and how to avoid them are described in the following paragraphs. This section also describes data collection guidelines to obtain high quality 3D reconstructions using the SPA method.
Avoid transition to crystalline ice. A central aspect is that the sample needs to stay in vitreous state from the moment of cryo-plunging throughout TEM observation. Thus after plunging the sample in liquid ethane all subsequent steps are performed at liquid nitrogen (-196 °C) or liquid helium (-269 °C) temperatures. Warming to above -135 °C transforms vitreous water into crystalline water; then macromolecular rearrangements may take place and water crystals dominate the image (Figure 3A); the sample should be discarded. Accidental sample warm-up could happen if cryo-plunging, transfer of the frozen grid between containers (even if protected by a gridbox), and/or cryo holder insertion into the TEM are too slow, or if the handling tweezers were insufficiently pre-cooled. Significant vacuum deterioration in the TEM upon cryo-transfer (the cold sample traps warmer incoming air) may also warm up the sample. Finally, over-irradiation of the sample could also result in transition to crystalline ice.
Minimize ice contamination. Given the small sample volume (3-5 µl) applied to the TEM grid, evaporation could concentrate buffer components (salt, detergents) and thus affect macromolecular integrity including loss of multimeric state. A high relative humidity (RH) microenvironment or chamber circumvents this problem. Alternatively cryo-plunging can be done in a sufficiently ventilated environmental cold room. After cryo-plunging RH should be as low as possible to prevent ice contamination, or condensation of ambient humidity on the cryo-grid, as the cryo-grid itself acts as a cold trap. Ice contamination consists of particles with high contrast and no substructure with sizes ranging between ~5 nm and several microns that interfere with or even totally block the image. Avoid air drafts, talking/breathing towards the cryo-grid during air transfer, and reduce ambient RH. Open liquid nitrogen containers with condensed water (visible as white suspended particles) should also be discarded.
Maximize macromolecular orientations/views. For sample support, a choice to be made is between true holey grids and thin carbon over holey grids. This depends on (i) how the sample spreads over carbon film versus the carbon holes, (ii) available sample concentration, as bare holes may require a concentration 100X higher than carbon support for a similar particle density on the image (from ~0.02 to 2 µM), and (iii) how random is the distribution of macromolecule orientations. Note that glow discharge, which makes the carbon hydrophilic, will have an important effect in all three aspects and that this will be sample-dependent. Regarding the orientation of the macromolecule, while a recurrent view is desirable for the initial structural determination by random conical reconstruction, randomness of macromolecular views is desirable when refining the 3D reconstruction to higher resolutions. In our example, RyR1 interacts with the carbon with a favorite 'fourfold' view (Figure 2D) and requires holey grids for randomness of orientations and higher resolution 36.
Maximize SNR. The best strategy to increase SNR is to reduce the background sources of noise. Excessive ice thickness and (if present) carbon film thickness beyond what is needed to support and embed the protein will add extra noise. Thus ice thickness should be reduced to the minimum necessary by controlling blotting time, pressure, RH, and filter paper quality. For carbon support, a thin (~5 nm) carbon film is layered over the thicker holey carbon film: the thick holey carbon provides mechanical resistance while the sample is imaged over the thin carbon-covered hole. On the other hand, note that extremely thin ice and/or carbon may result in an easily broken support that can turn into a web (Figure 3D). To maximize SNR, any unnecessary buffer components should be avoided. For membrane proteins, the detergent takes a significant toll on contrast (see Figure 2D, right panel). In addition by reducing surface tension the detergent changes the way in which the sample spreads on the support. Some membrane proteins require the presence of lipid in addition to detergent, which further reduces the contrast. To overcome this the sample can be diluted in a buffer with lower detergent concentration and without lipid just before cryo-plunging 37. New alternative detergents 16 and the use of nanodisks 38 to stabilize the transmembrane domain component appear to be successful approaches for imaging membrane proteins by cryoEM.
Strive for high quality images and prepare for the CTF correction. Vitrified specimens require high defocus values to generate sufficient image (phase) contrast where the CTF, the function that relates intensity to the frequency, has several zero transitions, at which point there is no information. While CTF correction is not necessary for low-resolution 3D reconstruction, when aiming for higher resolution, to recover an accurate representation of the 3D object, images with different defoci need to be collected so that computational CTF correction can be done. CTF determination and correction is included in the major SPA software packages 4-7; details can be found elsewhere 39. For optimal CTF correction, use a range of defoci. A good strategy is to alternate amongst 3-4 defocus values. The values depend on the size of the macromolecule (larger sizes require less defocus), the ice/carbon thickness (thinner sample requires less defocus), and the voltage (lower voltage requires less defocus). For 200 kV, a good starting range of values is 2.5, 3, 3.5 and 4 µm defocus. The CTF manifests as alternating rings of high and low intensity (Thon rings 40) in the reciprocal space representation, the power spectrum. Displaying the power spectrum will reveal the potential for resolution; the frequency of the widest visible Thon ring is the closest a priori estimate of the attainable resolution. The power spectrum should be checked periodically, and astigmatic (non circular) Thon rings (Figure 3C) should be corrected with the objective stigmator. Thon rings should be visible at least up to the resolution desired.
A cryoEM dataset obtained using this protocol can be directly processed by SPA in order to generate a 3D reconstruction. Even with an ideal sample, the quality of the 3D reconstruction will depend on the performance and specifications of the TEM equipment, and on the image processing. With the continued improvements in both these fronts, and with special mention to the recently developed direct electron detectors, the possibility to obtain 3D reconstructions at atomic resolution more consistently is closer than it has ever been.
Disclosures
The authors have nothing to disclose.
Acknowledgements
We thank the kind donations of AAV5 sample by Mavis Agbandje-McKenna and Antonette Bennett, and of TMV sample by Ruben Diaz. This work is supported by American Heart Association grant 14GRNT19660003 and VCU startup funds to MS.
Materials
| Name | Company | Catalog Number | Comments |
|---|---|---|---|
| Ethane | Airgas | 371745 | 99.99% purity very important, impurities can lead to high-contrast contaminants on the grid. CAUTION: flammable |
| Liquid nitrogen | Airgas | 27135 | 99% purity. CAUTION: handling liquid nitrogen in a cold room poses a serious asphyxia hazard since nitrogen displaces oxygen without any warning signs. |
| Dumont no. 5 Antimagnetic tweezers | Ted Pella | 5326 | |
| Mica sheets, 1 x 4 cm | Ted Pella | 54 | |
| Graphite rods, presharpened size 1/8” dia x 2 ¼” long tip 0.039” dia neck type | Electron Microscopy Sciences | 70220-45 | |
| 350 ml cryo-dewars | Pope | 8600 | |
| Cu 400 mesh holey grids Quantifoil | Quantifoil | Q10525 | |
| Cu 400 mesh holey grids C-Flat | Protochips | CF-1.2/1.3-4C | |
| Glow discharge device | Electron Microscopy Sciences | Model E7620 | |
| Turbo pumping station | Gatan | Model 655 | |
| Carbon evaporator | Denton Vaccum | Model 502B | |
| Freeze plunger | FEI | Vitrobot Mark IV | |
| Transmission electron microscope 200 kV | FEI | Model Tecnai F20 | |
| CCD Camera 4k x 4k | Gatan | UltraScan 4000 UHS | |
| Image Processing software CTFFIND3/CTFTILT | http://grigoriefflab.janelia.org/ctf | ||
| Image Processing software EMAN | http://blake.bcm.edu/emanwiki/EMAN2 | ||
| Image Processing software Spider | http://spider.wadsworth.org/spider_doc/spider/docs/spider.html | ||
| Image Processing software Freealign | http://grigoriefflab.janelia.org/frealign | ||
| 3D visualization software Chimera | http://www.cgl.ucsf.edu/chimera/ | ||
| Native Keyhole Limpet Hemocyanin | Biosyn |
References
- Adrian, M., Dubochet, J., Lepault, J., McDowall, A. W. Cryo-electron microscopy of viruses. Nature. 308 (5954), 32-36 (1984).
- Franzini-Armstrong, C. RyRs: Their Disposition, Frequency, and Relationships with Other Proteins of Calcium Release Units. Curr Top Membr. 66C, 3-26 (2010).
- Booth, D. S., Avila-Sakar, A., Cheng, Y. Visualizing proteins and macromolecular complexes by negative stain EM: from grid preparation to image acquisition. J Vis Exp. (58), (2011).
- Shaikh, T. R., et al. SPIDER image processing for single-particle reconstruction of biological macromolecules from electron micrographs. Nat Protoc. 3 (12), 1941-1974 (2008).
- Grigorieff, N. FREALIGN: high-resolution refinement of single particle structures. J Struct Biol. 157 (1), 117-125 (2007).
- Scheres, S. H. RELION: implementation of a Bayesian approach to cryo-EM structure determination. J Struct Biol. 180 (3), 519-530 (2012).
- Ludtke, S. J. 3-D structures of macromolecules using single-particle analysis in EMAN. Methods Mol Biol. 673, 157-173 (2010).
- Radermacher, M., et al. Cryo-electron microscopy and three-dimensional reconstruction of the calcium release channel/ryanodine receptor from skeletal muscle. J Cell Biol. 127 (2), 411-423 (1994).
- Stewart, A., Grigorieff, N. Noise bias in the refinement of structures derived from single particles. Ultramicroscopy. 102, 67-84 (2004).
- Serysheva, I. I., et al. Electron cryomicroscopy and angular reconstitution used to visualize the skeletal muscle calcium release channel. Nat Struct Biol. 2, 18-24 (1995).
- Cheng, Y., et al. Single particle reconstructions of the transferrin-transferrin receptor complex obtained with different specimen preparation techniques. J Mol Biol. 355 (5), 1048-1065 (2006).
- Stark, H. GraFix: stabilization of fragile macromolecular complexes for single particle cryo-EM. Methods Enzymol. 481, 109-126 (2010).
- Wang, L., Lashuel, H. A., Walz, T., Colon, W. Murine apolipoprotein serum amyloid A in solution forms a hexamer containing a central channel. Proc Natl Acad Sci U S A. 99 (25), 15947-15952 (2002).
- Amunts, A., et al. Structure of the yeast mitochondrial large ribosomal subunit. Science. 343 (6178), 1485-1489 (2014).
- Suloway, C., et al. Automated molecular microscopy: the new Leginon system. J Struct Biol. 151 (1), 41-60 (2005).
- Liao, M., Cao, E., Julius, D., Cheng, Y. Structure of the TRPV1 ion channel determined by electron cryo-microscopy. Nature. 504 (7478), 107-112 (2013).
- Bai, X. C., Fernandez, I. S., McMullan, G., Scheres, S. H. Ribosome structures to near-atomic resolution from thirty thousand cryo-EM particles. Elife. 2, e00461(2013).
- Grigorieff, N., Harrison, S. C. Near-atomic resolution reconstructions of icosahedral viruses from electron cryo-microscopy. Curr Opin Struct Biol. 21, 265-273 (2011).
- Lerch, T. F., et al. Structure of AAV-DJ, a retargeted gene therapy vector: cryo-electron microscopy at 4.5 A resolution. Structure. 20 (8), 1310-1320 (2012).
- Govindasamy, L., et al. Structural insights into adeno-associated virus serotype 5. J Virol. 87 (20), 11187-11199 (2013).
- Egelman, E. H. A robust algorithm for the reconstruction of helical filaments using single-particle methods. Ultramicroscopy. 85 (4), 225-234 (2000).
- Ge, P., Zhou, Z. H. Hydrogen-bonding networks and RNA bases revealed by cryo electron microscopy suggest a triggering mechanism for calcium switches. Proc Natl Acad Sci U S A. 108 (23), 9637-9642 (2011).
- Clare, D. K., et al. ATP-triggered conformational changes delineate substrate-binding and -folding mechanics of the GroEL chaperonin. Cell. 149 (1), 113-123 (2012).
- Fonseca, P. C., He, J., Morris, E. P. Molecular model of the human 26S proteasome. Mol Cell. 46 (1), 54-66 (2012).
- Gatsogiannis, C., Markl, J. Keyhole limpet hemocyanin: 9-A CryoEM structure and molecular model of the KLH1 didecamer reveal the interfaces and intricate topology of the 160 functional units. J Mol Biol. 385 (3), 963-983 (2009).
- Torres, J., Stevens, T. J., Samso, M. Membrane proteins: the 'Wild West' of structural biology. Trends Biochem Sci. 28 (3), 137-144 (2003).
- Samso, M., Feng, W., Pessah, I. N., Allen, P. D. Coordinated Movement of Cytoplasmic and Transmembrane Domains of RyR1 upon Gating. PLoS Biology. 7 (4), 980-995 (2009).
- DiMattia, M., et al. purification, crystallization and preliminary X-ray structural studies of adeno-associated virus serotype 5. Acta Crystallogr Sect F Struct Biol Cryst Commun. 61 (Pt 10), 917-921 (2005).
- Samso, M., Shen, X., Allen, P. D. Structural characterization of the RyR1-FKBP12 interaction. J Mol Biol. 356 (4), 917-927 (2006).
- Lobo, P. A., Van Petegem, F. Crystal structures of the N-terminal domains of cardiac and skeletal muscle ryanodine receptors: insights into disease mutations. Structure. 17 (11), 1505-1514 (2009).
- De Carlo, S., Harris, J. R. Negative staining and cryo-negative staining of macromolecules and viruses for TEM. Micron. 42 (2), 117-131 (2011).
- Kuhlbrandt, W. Introduction to electron crystallography. Methods Mol Biol. 955, 1-16 (2013).
- Yahav, T., Maimon, T., Grossman, E., Dahan, I., Medalia, O. Cryo-electron tomography: gaining insight into cellular processes by structural approaches. Curr Opin Struct Biol. 21 (5), 670-677 (2011).
- Briggs, J. A. Structural biology in situ--the potential of subtomogram averaging. Curr Opin Struct Biol. 23 (2), 261-267 (2013).
- Harapin, J., Eibauer, M., Medalia, O. Structural analysis of supramolecular assemblies by cryo-electron tomography. Structure. 21 (9), 1522-1530 (2013).
- Samso, M., Wagenknecht, T., Allen, P. D. Internal structure and visualization of transmembrane domains of the RyR1 calcium release channel by cryo-EM. Nat Struct Mol Biol. 12 (6), 539-544 (2005).
- Sharma, M. R., et al. Cryoelectron microscopy and image analysis of the cardiac ryanodine receptor. J Biol Chem. 273 (29), 18429-18434 (1998).
- Denisov, I. G., Grinkova, Y. V., Lazarides, A. A., Sligar, S. G. Directed self-assembly of monodisperse phospholipid bilayer Nanodiscs with controlled size. J Am Chem Soc. 126 (11), 3477-3487 (2004).
- Zhu, J., Penczek, P. A., Schroder, R., Frank, J. Three-dimensional reconstruction with contrast transfer function correction from energy-filtered cryoelectron micrographs: procedure and application to the 70S Escherichia coli ribosome. J Struct Biol. 118 (3), 197-219 (1997).
- Thon, F. Phase contrast electron microscopy. , Academic Press. New York. (1971).
Reprints and Permissions
