Disruption of bile flow results in severe inflammatory cholestatic liver injury with a characteristic time-dependent sequence of morphological alterations. Here we present a protocol for the surgical ligation of the common bile duct in mice that allows to induce a strong fibrotic response after 21 to 28 days.
Method Article
Bile Duct Ligation in Mice: Induction of Inflammatory Liver Injury and Fibrosis by Obstructive Cholestasis
In This Article
Summary
Abstract
In most vertebrates, the liver produces bile that is necessary to emulsify absorbed fats and enable the digestion of lipids in the small intestine as well as to excrete bilirubin and other metabolic products. In the liver, the experimental obstruction of the extrahepatic biliary system initiates a complex cascade of pathological events that leads to cholestasis and inflammation resulting in a strong fibrotic reaction originating from the periportal fields. Therefore, surgical ligation of the common bile duct has become the most commonly used model to induce obstructive cholestatic injury in rodents and to study the molecular and cellular events that underlie these pathophysiological mechanisms induced by inappropriate bile flow. In recent years, different surgical techniques have been described that either allow reconnection or reanastomosis after bile duct ligation (BDL), e.g., partial BDL, or other microsurgical methods for specific research questions. However, the most frequently used model is the complete obstruction of the common bile duct that induces a strong fibrotic response after 21 to 28 days. The mortality rate can be high due to infectious complications or technical inaccuracies. Here we provide a detailed surgical procedure for the BDL model in mice that induce a highly reproducible fibrotic response in accordance to the 3R rule for animal welfare postulated by Russel and Burch in 1959.
Introduction
Liver fibrosis is defined as the excessive production and accumulation of extracellular matrix (ECM) that originates from a complex network of interactions of matrix-producing hepatic stellate cells and a wide variety of liver-resident and infiltrating cells blood cells1,2. Although hepatic fibrosis can be caused by a multitude of different stimuli the molecular mechanisms underlying fibrosis are generally very similar. Following hepatic damage, a highly orchestrated program of molecular and cellular changes is initiated. In this program a close interaction between inflammatory signals, monocytes/macrophages and hepatic stellate cells occurs that at the end results in stellate cell activation and transdifferentiation to myofibroblasts, ECM deposition and consecutive anatomical and functional alterations of liver tissue integrity3. Activation of hepatic stellate cells is particularly driven by inflammatory signals and interactions with liver residental macrophages (i.e. the Kupffer cells). Pathogen associated molecular patterns are recognized by specialized pattern recognition receptors such as the Toll-like receptors that when activated signal through a complex network of different pathways that trigger the expression and secretion of a multitude of inflammatory cytokines and chemokines that drive the inflammatory process3. The inflammatory response and the formed hepatic insult is only temporary when the disease-producing factor is removed. In contrast, if the injury persists, chronic inflammation evolves within the liver and the expression and accumulation of ECM crowds in the foreground resulting in progressive substitution of normal liver parenchyma by scar tissue formation.
Since hepatic fibrogenesis in humans is a worldwide clinical problem, several experimental rodent models of acute and chronic hepatic failure have been established during the last decades. In the murine system for example, common models are the administration of a variety of different hepatotoxins, the ligation of the common bile duct, induction of immune-mediated liver injury, and the targeted introduction of gene defects or vice versa the overexpression of transgenes that affect critical signaling pathways involved in the pathogenesis of liver fibrosis4.
Ligation of the common bile duct in rodents has been carried out as an experimental procedure in research for many years5-8. A first highly reproducible protocol for prolonged bile duct ligation (BDL) in rodents was already presented now more than three decades ago9. In this protocol both cannulation/obstruction and ligation induced a high yield of cirrhosis in rats with morphological changes that were comparable to those observed in human biliary cirrhosis9. The respective protocol is simple, the surgical procedure is relatively rapidly applicable, and the survival rates of the animals are high with over 95%. In the classical rat cannulation/obstruction protocol, a short incision of 2 cm is made just below the xiphoid process. Thereafter, a cannula is inserted into the proximal portion of the bile duct and fixed in its position with silk sutures. In a next step, the distal portion of the cannula is obstructed with 3 knots, put through the lower end of the midline incision and buried subcutaneously in the right lower quadrant9. At the end, the abdomen is closed and animals are allowed to recover. In the ligation protocol, the rats are subjected to double ligation of the common bile duct either with or without dissection of the bile duct between the ligatures9.
This experimental model is well accepted and used worldwide in hundreds of laboratories to induce liver cholestasis and fibrosis. It induces intrahepatic biliary epithelial cell proliferation, myofibroblastic differentiation of portal fibroblasts around proliferating biliary epithelial cells, resulting in a highly reproducible, massive expression and deposition of ECM10,11. Therefore, the application of this model in rats and mice is being popular among scientists that aim to understand the pathogenesis of hepatic inflammation and fibrosis.
In our laboratory, we have extensively used this protocol in the past in rats in several experimental studies aiming to investigate special molecular and cellular aspects of hepatic fibrogenesis and to test novel antifibrotic concepts and drugs12-15.
Recently, we adapted this methodology to the murine system and found that the bile duct ligation surgery is also an attractive mean to establish time-dependent fibrosis with low variation and mortality in mice16-18. Due to the smaller size of the animals, however, some important modifications with regard to anesthesia, surgical intervention and post-treatment observation are necessary to obtain reliable and reproducible outcome in this model. The complete adaptation is summarized in the following protocol and in the accompanying video documentation.
Protocol
NOTE: All experiments were approved by the official State animal care and use committee (LANUV, Recklinghausen, Germany). The mice are housed under specific-pathogen-free conditions according to the guidelines of the Federation for Laboratory Animal Science Associations (FELASA). All experiments were conducted in accordance with the German federal law regarding the protection of animals and 'Guide for the Care and Use of Laboratory Animals' (National Institutes of Health publication 8th Edition, 2011).
1. Presurgical Preparation
NOTE: Carry out all procedures under clean but non-sterile conditions. All instruments and other reusable equipment such as surgical forceps, scissors, and Colibri retractor that are used to perform surgery must be sterilized prior to use according to protocols that are in strict compliance with the institutional guidelines for performing surgeries in animals. For a detailed list of necessary reagents, materials and equipment, please refer to the list of Specific Materials/Equipment.
- During the complete experimentation, keep the animal on a warming plate at a temperature of 37 °C, permanently connected to an anesthesia system, and the cover the operational area overall with fluid-impermeable, self-adhesive drapes. Properly arrange all instrumentations and solutions that are used during the experimentation prior to surgery (Figure 1).
- Anesthetize the mouse with inhalation of 4 vol% isoflurane in 100% oxygen at a flow rate of 4 L/min for the induction of the anesthesia. The depth of anesthetization is sufficient when the following vital criteria are reached: regular spontaneous breathing, no reflex after setting of pain stimuli between toes, and no response to pain.
- Shave the abdominal fur of the mouse with an electric fur shaver and protect the eyes from drying out by usage of eye and nose ointment.
- Place the mouse on a 37 °C heated hot plate, insert the mouse snout in the Fluovac mask of the Fluovac anesthesia system, and fix the legs of the animal with stripes of silk tape.
- Maintain anesthesia of the mouse by inhalation of 1.5-3 vol% isoflurane in 100% oxygen at a flow rate of 1 L/min and induct perioperative analgesia via intraperitoneal injection of buprenorphine solution (0.1 mg/kg BW dissolved in 0.9% NaCl solution).
- Sterilize the shaved abdominal skin with a gauze swab that is moistened with a standard antiseptic, ready to use alcoholic solution for pre-operative treatment of the skin. Note: In our protocols we use a poly-alcohol skin antisepticum. This is in full accordance with the German federal law regarding the protection of animals and the guidelines of the Federation for Laboratory Animal Science Associations. This antiseptic contains 70% (v/v) 2-propanol, butan-1,3.diol and traces of quinoline yellow, and perfume.
2. Surgical Procedures
- Open the abdomen with a midline laparotomy of a length of approximately 2 cm by cutting the cutis plus fascia at the same time with an 11.5 cm surgical scissor.
- Dissect the connective tissue on top of the peritoneum by using the scissor as a spreader.
- Cut the peritoneum along the linea alba to open the peritoneal cavity.
- Enlarge the cavity by inserting a holding suture in the sternum, raising the filament of the suture, and fixing it on top of the Fluovac mask.
- Spread the operation area by inserting a Colibri retractor in the peritoneal cavity (Figure 2).
- Lift the liver with a moisturized (0.9% NaCl solution) cotton swab so that the ventral side of it sticks to the diaphragm and the hilum is clearly visible.
- Expose the bile duct by caudal movement of the gut (Figure 3).
- Separate carefully the bile duct from the flanking portal vein and hepatic artery using a micro-serrations forceps (Figure 4A).
- Place the 5-0 suture around the bile duct and secure it with two surgical knots. When tying the knots increase the tractive force continuously to ensure effective obstruction without severing the bile duct (Figure 4B).
- Add a second cranial ligation in the same manner but do not dissect the bile duct in between (Figure 4C). Otherwise there is a considerable risk that bile leaks if one knot is not secure, and the animals experience no cholestasis but develop severe peritonitis.
- Cut the ends of the sutures (Figure 4D), lower the sternum, and remove the retractor.
- Rinse the peritoneal cavity with 0.9% NaCl solution and replace the abdominal organs to the physiological positions.
- Close both abdominal layers (peritoneum and cutis plus facia) with separate running sutures with 6-0 Mersilk.
- Cut the ends of the sutures and sterilize the operation area with a gauze swab moistened with antiseptic solution.
NOTE: When performing the surgery for the first time, perform all procedures under a surgical microscope at a magnification of 16X-20X. This allows better recognition of the bile duct and clearly distinguishes it from the portal vein and hepatic artery (Figures 5 and 6). Some laboratories recommend the dissection of the bile duct in between the two ligatures. Leave the bile duct intact because potential leaks in one of the knots will result in severe acute peritonitis, ascites, and systemic endotoxemia when the bile duct is dissected.
3. Postoperative Treatment and Follow-up
- Allow the mouse to recover in a cage warmed up by an infrared lamp until the mouse is fully awake and active.
- Afterwards, move the mouse to a normal cage and provide ad libitum access to water and food.
- After the surgery, monitor the animals at regular intervals and carry out follow-up postoperative treatment with suitable analgesia (e.g., buprenorphine solution) following the local recommendation of the internal animal care and use committees.
NOTE: Perform analgesic therapy for 3 days. Any abnormal behavior may indicate rare complications such as peritonitis, sepsis or internal bleeding and should be handled as human endpoint to terminate the experiment. - Animals are kept with free access to food and water ad libitum until the end of the experiment. There is no need for blood drawing since ongoing fibrogenesis is indicated by jaundice.
- When animals are sacrificed, blood is collected for measurement of clinical chemistry parameters (AST, ALT, bilirubin etc.) and the liver is retrieved for histochemical and biochemical analysis.
Results
In a typical experimentation BDL was performed in 40 male C57BL/6 wild-type mice weighting about 18-20 gram. This experiment was done to investigate hepatic fibrogenesis in the initiation phase (3 and 7 days), during progression (10, 14, and 20 days), and during long-term (30 and 60 days)16. In this model, persinusoidal fibrosis has already developed on day 10 after the surgery, while periportal fibrosis that permanently increased up to the end of the experiment was fully developed after 20 days. In the mentioned experiment, all animals that received a simple sham-operation survived, and only two of the 40 mice (5%) that received BDL developed a poor general condition and were therefore prematurely sacrificed before the planned end point of the experiment. The activity of sham-operated animals was without exception already normal one day after laparotomy, while most of the animals subjected to BDL showed reduced activity during the first three days. Jaundiced skin had been already apparent in all BDL animals one or two days after setting of the BDL16.
The values of both alanine aminotransferase (ALT) and aspartate transaminase (AST) that represent well-established serum markers of hepatic injury rapidly increased and peaked during day 7 and day 20 after BDL (Table 1). Thereafter, ALT and AST decreased steadily until day 30 and remained stable until 60 days after surgery. In line with the cholestatic injury, serum concentrations of total bilirubin were steadily elevated and reached a plateau after 7 days16. Similar time course of ALT and AST serum activities were also reported for rats that underwent BDL. In a recent study it was demonstrating that serum AST and ALT levels increased up to 5 or 10 fold of normal at the first week after the BDL surgery and decreased after two weeks19.
Typically, the livers of sham-operated animals still look smooth at the end of the experiment, while the livers of animals that received BDL show architectural alterations that are mainly characterized by the formation of edema and fibrotic nodules on the surface of corresponding livers and hydrops of the gall bladder that is filled with large quantities of bile (Figure 7). The characteristic morphological alterations of the liver that are induced by the BDL surgery are also demonstrable in standard histological analysis (Figure 8).
In the same set of experiments, development of liver fibrosis was semi-quantitatively assessed based on liver histology evaluated by a blinded pathologist using a scoring system in which periportal fibrosis was staged from 0-4 and perisinusoidal fibrosis from 0-2, giving a maximum value that was equivalent to cirrhosis of 6. As expected, the mean fibrosis score in the group of sham-operated animals was 0.00 ± 0.00. In contrast, in the group of animals that received BDL, the score increased steadily until day 60 to a value of 4.83 ± 0.17. The maximum of 3 for periportal fibrosis was reached at day 20. In all animals analyzed, perisinusoidal fibrosis was absent during the first 10 days of the experiment and was firstly noticeable after two weeks. Thereafter, it increased steadily up to the end of the experiment to values of 1.8 ± 0.17 (Table 1).
Also in several other independent animal experiments that were performed, it was observed that the formation of fibrosis was highly reproducible showing time-dependent increase of intrahepatic collagen expression and deposition as a consequence of ongoing fibrogenesis (Figure 9). Similarly, the process of ongoing fibrogenesis is noticeable in elevated expression of α-smooth muscle actin (α-SMA) that represents a marker of fibroblastic cells, i.e. activated hepatic stellate cells and portal myofibroblasts, and hepatic hydroxyproline, an amino acid abundantly found in collagen matrices18 (Figure 9). In addition, the expression of vimentin that indicates increasing amounts of myofibroblasts or fibroblasts is increased after setting of the BDL surgery20. The concomitance of inflammation in injured livers are further reflected by increased expression of Lipocalin 2 (LCN2) that is strongly induced during acute and chronic liver injury and evolves hepato-protective effects during acute liver injury21,22.
Inflammatory cells that infiltrate the livers of animals that received BDL can be detected by specific staining with an antibody that is specific for CD45 (Figure 10). This cellular surface marker that is also known as PTPRC (protein tyrosine phosphatase, receptor type) is specifically expressed in all differentiated hematopoietic cells except erythrocytes and plasma cells.
| Time after bile duct ligation (days) | Total bilirubin | AST (U/L) | ALT (U/L) | Portal fibrosis | Perisinusoidal fibrosis | Total score |
| (mg/dL) | ||||||
| 0 (n = 3) | 0.17 ± 0.06 | 192.67 ± 30.50 | 50.33 ± 6.03 | 0.0 ± 0.0 | 0.0 ± 0.0 | 0.0 ± 0.0 |
| 3 (n = 5) | 6.85 ± 2.21 | 1159.25 ± 319.27 | 566.50 ± 335.25 | 0.0 ± 0.0 | 0.0 ± 0.0 | 0.0 ± 0.0 |
| 7 (n = 5) | 14.38 ± 2.14± | 976.60 ± 477.16 | 448.20 ± 259.47 | 0.60 ± 0.25 | 0.0 ± 0.0 | 0.60 ± 0.25 |
| 10 (n = 5) | 15.92 ± 2.60 | 1916.60 ± 868.25 | 560.40 ± 80.88 | 1.40 ± 0.25 | 0.25 ± 0.25 | 1.67 ± 0.25 |
| 14 (n = 5) | 17.90 ± 3.84 | 1088.60 ± 276.32 | 505.00 ± 96.15± | 2.4 ± 0.25 | 1.0 ± 0.0 | 3.40 ± 0.24 |
| 20 (n = 4) | 18.00 ± 2.12 | 1072.67 ± 364.27 | 404.00 ± 195.48 | 3.0 ± 0.0 | 1.0 ± 0.0 | 4.0 ± 0.0 |
| 30 (n = 5) | 16.04 ± 4.79 | 446.40 ± 169.75 | 260.20 ± 126.97 | 2.8 ± 0.2 | 1.4 ± 0.25 | 4.20 ± 0.20 |
| 60 (n = 6) | 16.02 ± 1.19 | 484.67 ± 117.79 | 257.17 ± 50.97 | 3.0 ± 0.0 | 1.8 ± 0.17 | 4.83 ± 0.17 |
Abbreviations used are: ALT, alanine aminotransferase; AST, aspartate aminotransferase.
Table 1: Fibrosis scoring in a representative experiment. The data of this table was reproduced from a study in which liver fibrosis was induced by bile duct ligation in C57BL/6 mice16. In this study, the mortality rate after the BDL surgery was 5% (2 of 40 animals were prematurely sacrificed because poor animal conditions developed).
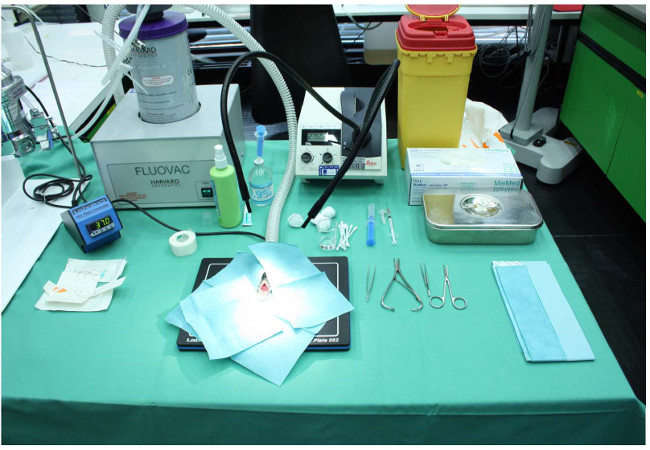
Figure 1: Experimental setup for performing a bile duct ligation. The animal is kept on a warming plate at a temperature of 37 oC and the operational area is covered overall with fluid-impermeable, self-adhesive drapes. During the complete surgery, the animal is permanently connected to an anesthesia system. All instrumentations and solutions (analgesics, anesthetics, antiseptic solution, 0.9% NaCl) are arranged clearly.
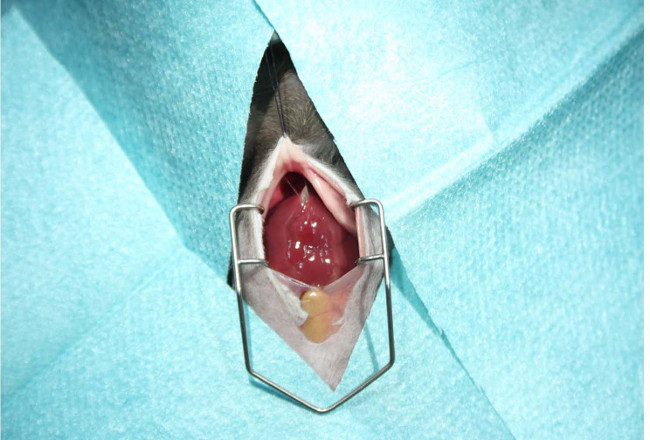
Figure 2: Preparation of the surgery area. Prior opening of the peritoneal cavity, the abdominal skin should be shaved with an electric fur shaver and disinfected with an antiseptic gauze swab. The surgery area is then covered with fluid-impermeable, self-adhesive drapes. The abdomen is opened with a midline laparotomy (~ 2 cm in length). The cavity is enlarged by inserting a holding suture in the sternum and the operation area spread by inserting a Colibri retractor allowing unhindered experimentation during the surgery.
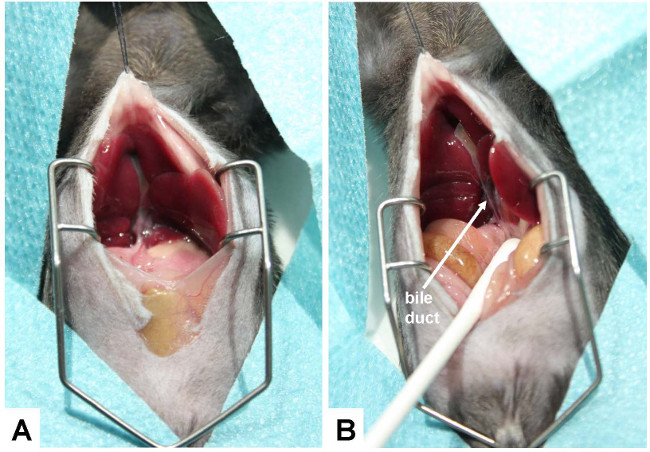
Figure 3: Exposure of the bile duct. (A) For conducting the bile duct ligation, the ventral side of the liver is lifted so that it can stick to the diaphragm and the hepatic hilus becomes clearly visible. (B) To better expose the bile duct, the gut is caudally moved with a humidified cotton swab. The bile duct is marked with an arrow.
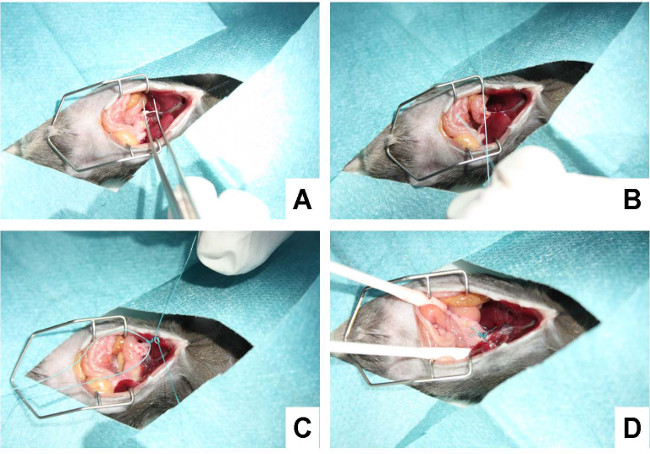
Figure 4: Ligating the bile duct. (A) In a first step, the bile duct is separated carefully from the flanking portal vein and hepatic artery using a micro-serration forceps. (B) Subsequently, a suture is placed around the bile duct and secured with a surgical knot. (C) Thereafter, a second suture is placed in close proximity to the first suture and knotted around the bile duct. (D) The suture is shortened, the cavity rinsed with 0.9% NaCl solution, and all organs replaced to their physiological position.
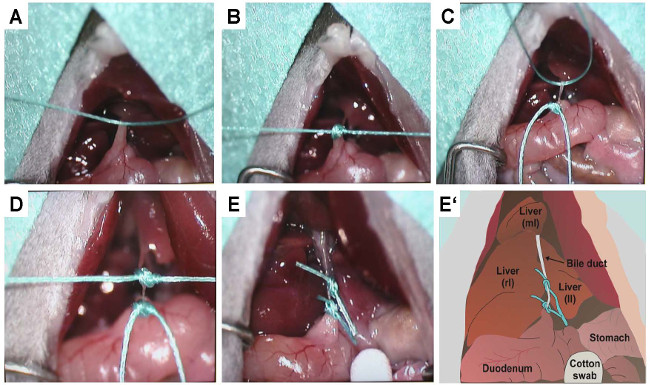
Figure 5: Precise representation of knotting. To document the placement of the sutures and the setting of the two knots that prevent bile flow, the same procedure outlined in Figure 4 was documented under a binocular. (A) Confinement of the bile duct with the first suture. (B) Knotting of the first suture. (C) Confinement of the bile duct with the second suture. (D) Knotting of the second suture. (E) Double-ligated bile duct after shortening of excess sutures. (E') This panel depicts a sketch of (E). The positions of the right (rl), left (ll) and median (ml) lobes of the liver as well as the bile duct, stomach, and duodenum are lettered. In the sketch the bile duct is double ligated by two sutures.
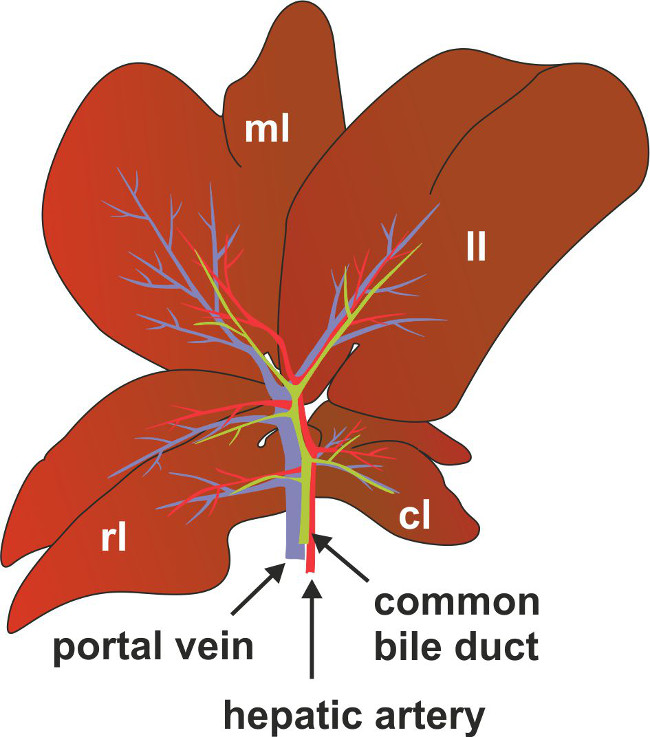
Figure 6: Anatomy of bile duct, portal vein and hepatic artery in mice. For better anatomic location of the common bile duct, portal vein and hepatic artery are depicted as a scheme. Marked are also the positions of the right (rl), left (ll) median (ml) and the caudate (cl) lobes of the liver.
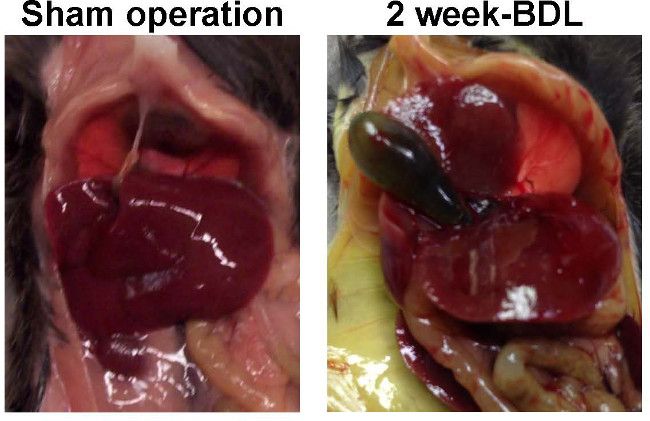
Figure 7: Representative appearance of livers 2 weeks after sham operation and BDL. C57BL/6 mice were subjected to sham operation or BDL surgery. After two weeks the visceral cavity was opened. While the livers of sham-operated animals showed no sign of fibrosis, the livers of animals receiving ligation of the biliary duct had an irregular surface structure with formation of edema and fibrotic nodules on the surface of corresponding livers.

Figure 8: Hematoxylin and eosin stain. Liver sections were prepared from C57BL/6 wild type animals that were sham-operated (A) or received BDL for three weeks (B). The sections were stained with hematoxylin and eosin following standard procedures. Please note the typical alterations within the BDL liver that include signs of inflammation (infiltrating cells), parenchymal (hepatocyte) necrosis, and proliferation of bile ducts. The scale bar in each figure panel represents 50 µm. Please click here to view a larger version of this figure.
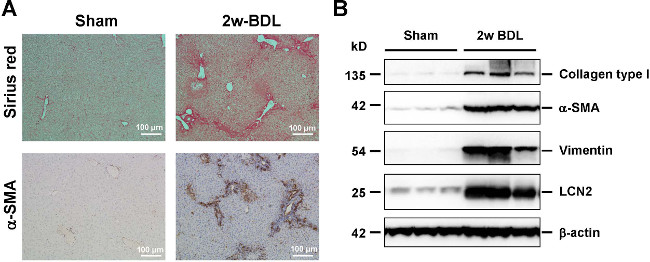
Figure 9: Histological and biochemical readouts for hepatic fibrogenesis. (A) Liver sections were prepared from animals that received sham operation or BDL for 2 weeks and stained with Sirius Red (upper panel, collagen fibers in red) or analyzed for expression of α-smooth muscle actin (α-SMA) (lower panel, α-SMA positive cells in brown) by immunohistochemistry. The scale bar in each figure panel represents 100 µm. (B) Protein extracts from livers were subjected to Western blot and analyzed for expression of collagen type I, α-SMA, and Vimentin that are well established markers of hepatic fibrogenesis. The expression of Lipocalin-2 (LCN2) indicates the inflammatory response that is associated with ongoing fibrogenesis. In this analysis, equal protein loading was demonstrated by probing the blots with an antibody specific for β-actin. Please click here to view a larger version of this figure.
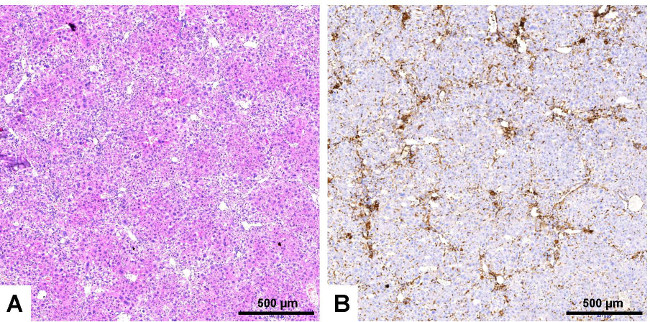
Figure 10: Immunological staining of infiltrating inflammatory cells. Serial liver sections were prepared from a liver of an animal that received bile duct ligation for 3 weeks. The sections were stained with hematoxylin and eosin (A) or with an antibody that is specific for CD45 (B). Please note, the high number of CD45 positive cells surrounding the bile ducts. These massive infiltrates that indicate inflammation are not visible in liver sections derived from sham-operated animals (not shown). The scale bar in each figure panel represents 500 µm. Please click here to view a larger version of this figure.
Discussion
Cholestatic liver injury is one of the major causative factors for the development of liver fibrosis and cirrhosis in patients with chronic liver disease. Based on the fact that these diseases produce imponderable health care costs, it is comprehensible that many researchers are trying to understand the pathogenic mechanisms of ongoing hepatic fibrosis. Therefore, experimental models have been generated that mimic various aspects of the complex mechanisms that lead to hepatic inflammation, fibrosis and cirrhosis1.
Surgical BDL is one of the most widespread experimental models that is used to induce obstructive cholestatic injury in mice and rats4,23,24. In most of the protocols, animals are anesthetized and a midsection laparotomy is performed. Subsequently, the bile duct is uncovered from the abdominal cavity and ligated twice using surgical twine. As a consequence, the mice and rats that received this surgery develop a strong fibrotic reaction that at first originate from the periportal fields25. During the years several different surgical techniques and modifications have been described. Special procedures even allow reconnection or reanastomosis after BDL23. Other techniques are based on partial BDL resulting in significantly less necrosis formation and consequently hepatocyte proliferation24. Partial BDL in combination with subsequent removal of the gallbladder (cholecystectomy) that prevents formation of cholecystitis also represents an excellent experimental model for acute cholestasis. It was proposed to be a model that is closer to the human situation24. And indeed, during the establishment of this model, it was already demonstrated that it reproducibly causes cholestasis with only minimal histological tissue injury and does not proceed to chronic cholestasis25. Therefore, it was suggested that this model is ideal for studying late effects of reversed cholestasis24. Even more sophisticated methods are based on microsurgery and allow a fast and reproducible way to inflict cholestatic liver injury only in selected parts of the liver26.
Although these sophisticated modifications from the original BDL protocol have been proven very helpful in investigating specific research questions, many laboratories worldwide basically aim at employing the BDL model as a highly reproducible and reliable model for cholestatic liver fibrosis. However, many complications can occur that could substantially alter the reproducibility and reliability of the results obtained by this model, if technical inaccuracies are not avoided. For instance, bleeding complications related to injury of the blood vessels accompanying the bile duct (see Figures 3-4) may occur during or rapidly after surgery. Overdosing of anesthesia with subsequent cardiodepression or respiratory failure are also avoidable complications of the procedure. Severe infections, ranging from peritonitis to sepsis, may occur during the whole period of the experiment, if the sutures are not accurately performed and bile leaks into the peritoneal cavity. Accidental injuries to the intestine during surgery could also lead to peritonitis. Therefore, it is obvious that standardized protocols which are in compliance with strict handling guidelines are strongly required. This stipulation was also recently demanded within the countries of the European Union, which implemented new animal welfare rules in 20131. The respective requirements that are associated with this regulation are not new and were already proposed in 1959, when Russell and Burch suggested an ethical framework for conducting scientific experiments with animals that is mainly based on a replacement, refinement and reduction (3R) principle27.
When following the outlined protocol there are only a few complications that may arise from technical inaccuracies. Three specific issues might occur in rather low frequency.
As with all surgical procedures, the overdose of anesthetic is a potential source of danger to the animals especially in combination with hypothermia. If during the surgery cardiovascular complications occur, the supply of anesthetics should be stopped immediately and the operator should try to provide much as possible oxygen to the mouse. This can be done by means of a small plastic syringe that is filled with air and pumped into the mouth of the impaired animal. Alternatively, the use of a small Peleusball for ventilation of the affected animal is often helpful for the revitalization process.
Problems in wound healing
After the BDL surgery, mice may bite their own sore seams or those of other animals. If this occurs, respective mice should be separately caged. Animals with open wounds should be anesthetized, the region around the wound gently sterilized with a standard antiseptic, and the wound should be sewn up again. During the next 3 days, the wound of these animals should be regularly inspected (two to three times a day).
Distensions of the abdomen or formation of ascites are indicative for bacterial infections. These might occur due to non-sterile working during the surgery. All kind of infections should be handled without exception as a humane endpoint and the affected animals should be sacrificed.
We provided an easy to follow protocol that allows the performance of BDL in mice that is simple to implement and evokes only low animal mortality combined with a high reproducibility. All of the surgical protocols can be quickly apprehended by skilled scientists. During the complete experimentation, the animals are kept on a warming plate at 37 °C and permanently connected to an anesthesia system minimizing pain and distress. For surgery, the abdomen is opened with a midline laparotomy and the bile duct double-ligated without dissecting it. The representative results that were discussed here demonstrate that the phenotypic alterations in regard to liver morphology (inflammation, fibrosis, cirrhosis) are highly reproducible and allow to study different aspects of fibrogenesis (e.g., initiation, inflammation, progression, end-stage disease) at defined time-points.
We hope that the summary of our protocol will help to shorten the learning curve that is necessary to successfully establish this fibrosis model in other laboratories and to guarantee reliable and reproducible results at different locations. Thereby we think that the presented protocol supports the 3R principle that was supposed by Russell and Burch in 1959 and represents the basis of new animal welfare rules that are presently implemented in many countries within the European Framework.
Disclosures
The authors have nothing to disclose.
Acknowledgements
The authors would like to acknowledge the financial support of the German Research Foundation (SFB/TRR57, Q3 and Q2). The authors thank Mareike Schulz, Pascal Paschenda, and Klaudia Warzecha for their help in preparing the photographs.
Materials
| Name | Company | Catalog Number | Comments |
|---|---|---|---|
| Isoflurane | Forene Abbott | B 506 | |
| Shaver Favorita II | Aeskulap | GT104 | |
| Cutter head | Aeskulap | GT730 | |
| Bepanthen eye and nose ointment | Bayer Vital GmbH | 6029009.00.00 | |
| Warming plate and controller | Labotect | HP 062 | |
| Fluovac anesthesia system | Harvard Apparatus | 34-1030 | |
| ISOFLO (Isoflurane Vapor) vaporiser | Eickemeyer | 4802885 | |
| Scotch Tape | commercially available | ||
| Tissue paper | commercially available | ||
| Durapore silk tape | 3M | 1538-1 | |
| Cotton Gauze swabs | Fuhrmann GmbH | 32014 | |
| Poly-Alcohol Haut…farblos Antisepticum | Antiseptica GmbH | 72PAH200 | |
| Raucodrape OR adhesive drapes | Lohmann & Rauscher GmbH | 33013 | |
| Scissor | Fine Science Tools Inc. | 14074-11 | |
| Graefe forceps straight | Fine Science Tools Inc. | 11050-10 | |
| 6-0 Mersilk suture | Ethicon | K889H | Silk, non-absorbable/Abdominal closure |
| Needle holder Mathieu | Fine Science Tools Inc. | 12010-14 | |
| Colibri retractor | Fine Science Tools Inc. | 17000-03 | |
| Cotton swabs | Noba Verbandmittel | 974202 | |
| Cotton swabs | Heinz Herenz Medizinalbedarf GmbH | 1032238 | |
| 25mL beaker | Schott Duran | 50-1150 | |
| Isotonic (0.9%) NaCl solution | DeltaSelect GmbH | PZN 00765145 | |
| Micro-serrations forceps Moria MC31 | Fine Science Tools Inc. | 11370-31 | Bile duct separation |
| 5-0 Mersilene suture | Ethicon | EH6731H | Polyester, non-absorbable/Bile duct ligation |
| 5mL syringe | BD Discardit II | 300296 | |
| 1mL syringe | BD Plastipak | 300013 | |
| Sterican needle 26 G x 1 | B. Braun | 4657683 | |
| Buprenorphine | Essex Pharma | 997.00.00 | Analgeticum, 0.1 mg/kg |
| Infrared lamp | Petra Electric | IR 11 |
References
- Liedtke, C., et al. Experimental liver fibrosis research: update on animal models, legal issues and translational aspects. Fibrogenesis Tissue Repair. 6 (1), 19(2013).
- Aller, M. A., Arias, J. L., García-Domínguez, J., Arias, J. I., Durán, M., Arias, J. Experimental obstructive cholestasis: the wound-like inflammatory liver response. Fibrogenesis Tissue Repair. 1 (1), 6(2008).
- Tacke, F., Weiskirchen, R. Update on hepatic stellate cells: pathogenic role in liver fibrosis and novel isolation techniques. Expert Rev Gastroenterol Hepatol. 6 (1), 67-80 (2012).
- Weiler-Normann, C., Herkel, J., Lohse, A. W. Mouse models of liver fibrosis. Z. Gastroenterol. 45 (1), 43-50 (2007).
- Cameron, G. R., Oakley, C. L. Ligation of the common bile duct. J. Pathol. 35 (5), 769-798 (1932).
- Cameron, G. R., Hasan, S. M. Disturbances of structure and function in the liver as the result of biliary obstruction. J. Pathol. 75 (2), 333-349 (1958).
- Accatino, L., Contreras, A., Fernańdez, S., Quintana, C. The effect of complete biliary obstruction on bile flow and bile acid excretion: postcholestatic choleresis in the rat. J Lab Clin Med. 93 (5), 706-717 (1979).
- Accatino, L., Contreras, A., Berdichevsky, E., Quintana, C. The effect of complete biliary obstruction on bile secretion. Studies on the mechanisms of postcholestatic choleresis in the rat. J Lab Clin Med. 97 (4), 525-534 (1981).
- Kountouras, J., Billing, B. H., Scheuer, P. J. Prolonged bile duct obstruction: a new experimental model for cirrhosis in the rat. Br J Exp Pathol. 65 (3), 305-311 (1984).
- Tuchweber, B., Desmoulière, A., Bochaton-Piallat, M. L., Rubbia-Brandt, L., Gabbiani, G. Proliferation and phenotypic modulation of portal fibroblasts in the early stages of cholestatic fibrosis in the rat. Lab Invest. 74 (1), 265-278 (1996).
- Desmoulière, A., et al. Extracellular matrix deposition, lysyl oxidase expression, and myofibroblastic differentiation during the initial stages of cholestatic fibrosis in the rat. Lab Invest. 76 (6), 765-778 (1997).
- Arias, M., et al. Adenoviral expression of a transforming growth factor-β1 antisense mRNA is effective in preventing liver fibrosis in bile-duct ligated rats. BMC Gastroenterol. 3 (29), (2003).
- Borkham-Kamphorst, E., et al. Dominant-negative soluble PDGF-β receptor inhibits hepatic stellate cell activation and attenuates liver fibrosis. Lab. Invest. 84 (6), 766-777 (2004).
- Borkham-Kamphorst, E., Huss, S., Van de Leur, E., Haas, U., Weiskirchen, R. Adenoviral CCN3/NOV gene transfer fails to mitigate liver fibrosis in an experimental bile duct ligation model because of hepatocyte apoptosis. Liver Int. 32 (9), 1342-1353 (2012).
- Borkham-Kamphorst, E., et al. The anti-fibrotic effects of CCN1/CYR61 in primary portal myofibroblasts are mediated through induction of reactive oxygen species resulting in cellular senescence, apoptosis and attenuated TGF-β signaling. Biochim. Biophys. Acta. 1843 (5), 902-914 (2014).
- Huss, S., et al. Development and evaluation of an open source Delphi-based software for morphometric quantification of liver fibrosis. Fibrogenesis Tissue Repair. 3 (1), 10(2010).
- Borkham-Kamphorst, E., Drews, F., Weiskirchen, R. Induction of lipocalin-2 expression in acute and chronic experimental liver injury moderated by pro-inflammatory cytokines interleukin-1β through nuclear factor-κB activation. Liver Int. 31 (5), 656-665 (2011).
- Karlmark, K. R., et al. The fractalkine receptor CX3CR1 protects against liver fibrosis by controlling differentiation and survival of infiltrating hepatic monocytes. Hepatology. 52 (5), 1769-1782 (2010).
- Tarcin, O., et al. Time course of collagen peak in bile duct-ligated rats. BMC Gastroenterol. 11, 45(2011).
- Takase, S., Leo, M. A., Nouchi, T., Lieber, C. S. Desmin distinguishes cultured fat-storing cells from myofibroblasts, smooth muscle cells and fibroblasts in the rat. J. Hepatol. 6 (3), 267-276 (1988).
- Borkham-Kamphorst, E., et al. Protective effects of lipocalin-2 (LCN2) in acute liver injury suggest a novel function in liver homeostasis. Biochim. Biophys. Acta. 1832 (5), 660-673 (2013).
- Labbus, K., et al. Proteomic profiling in Lipocalin 2 deficient mice under normal and inflammatory conditions. J Proteomics. 78, 188-196 (2013).
- Kirkland, J. G., et al. Reversible surgical model of biliary inflammation and obstructive jaundice in mice. J. Surg. Res. 164 (2), 221-227 (2010).
- Heinrich, S., et al. Partial bile duct ligation in mice: a novel model of acute cholestasis. Surgery. 149 (3), 445-451 (2011).
- Scholten, D., et al. Genetic labeling does not detect epithelial-to-mesenchymal transition of cholangiocytes in liver fibrosis in mice. Gastroenterology. 139 (3), 987-998 (2010).
- Aller, M. A., et al. A half century (1961-2011) of applying microsurgery to experimental liver research. World J Hepatol. 4 (7), 199-208 (2012).
- Russell, W. M. S., Burch, R. The Principles of Humane Experimental Technique. , London, Methuen. (1959).
Reprints and Permissions
