Circulating microRNAs have recently emerged as promising and novel biomarkers for various cancers and other diseases. The goal of this article is to discuss three different probe-based real-time PCR platforms and methods that are available to quantify and determine the abundance of circulating microRNAs.
Method Article
Probe-based Real-time PCR Approaches for Quantitative Measurement of microRNAs
In This Article
Summary
Abstract
Probe-based quantitative PCR (qPCR) is a favoured method for measuring transcript abundance, since it is one of the most sensitive detection methods that provides an accurate and reproducible analysis. Probe-based chemistry offers the least background fluorescence as compared to other (dye-based) chemistries. Presently, there are several platforms available that use probe-based chemistry to quantitate transcript abundance. qPCR in a 96 well plate is the most routinely used method, however only a maximum of 96 samples or miRNAs can be tested in a single run. This is time-consuming and tedious if a large number of samples/miRNAs are to be analyzed. High-throughput probe-based platforms such as microfluidics (e.g. TaqMan Array Card) and nanofluidics arrays (e.g. OpenArray) offer ease to reproducibly and efficiently detect the abundance of multiple microRNAs in a large number of samples in a short time. Here, we demonstrate the experimental setup and protocol for miRNA quantitation from serum or plasma-EDTA samples, using probe-based chemistry and three different platforms (96 well plate, microfluidics and nanofluidics arrays) offering increasing levels of throughput.
Introduction
MicroRNAs (miRNAs) are ~22 nucleotide non-coding(nc)RNAs, functioning as regulators of gene expression1-3. Most miRNAs in animals function through sequence-specific base pairing with an mRNA, targeting the 3’ UTR, which leads to negative regulation of the gene expression2-4. This usually occurs via inhibition of mRNA translation or by ribosomal drop-off. miRNAs in circulation have been shown to be novel biomarkers in research and clinical fields for a variety of diseases, such as diabetes5-7, ovarian8, prostate9 and breast cancer10,11, hepatitis B12 and other autoimmune diseases13. Research has been conducted to identify abundant miRNAs in different cells or tissues, as well as in circulation from human plasma and serum samples, which is more accessible and less invasive9,11-15.
Different methods of miRNA quantification have been established using multiple platforms, such as the standard 96-well plate platform 4,12,16-18, the microfluidics card platform12,18-23 and the nanofluidics array platform17,24. Quantitative real-time PCR (qPCR) offers the ability to measure relative or absolute numbers of transcripts using multiple (dye- or probe-based) chemistries. Probe-based real-time PCR chemistry offers the benefit of low background fluorescence and high sensitivity to detect a single transcript copy. It is relatively cost effective, simple to use and highly reproducible, making it a favoured method for quantifying and determining miRNA expression25. Probe-based qPCR method generally involves two steps: reverse transcription (RT) and qPCR4,26,27. RT is where the stem-loop RT primer is hybridized to a mature or primary miRNA molecule and converted to complementary (c)DNA. Quantification of the cDNA product is then carried out using miRNA-specific PCR primers26-28. The principle of probe-based qPCR is based on the detection of complementary strand extension in real time, which involves hydrolysis of the fluorescently-tagged probe. These probes are designed to contain a fluorescent reporter and a quencher that are just apart to allow FRET (Fluorescence Resonance Energy Transfer). Detection of the emission from the fluorescence reporter (emitter) is masked by the close proximity of the quencher molecule. When Taq polymerase (pol) extends from the upstream primer and reaches a fork (the 5’ end of the probe), the Taq pol exonuclease activity hydrolyses the probe, leading to a physical dissociation/separation of the fluorescent emitter from the quencher. This release of a single molecule of fluorescence emitter is recorded by the detector and presented as an incremental increase in fluorescence signal from that well/reaction. The increase in fluorescence is proportional to the amount of PCR product generated, allowing an accurate quantification of the amplified target26,28.
With increasing demand in miRNA quantification, medium to high-throughput technologies have been developed to allow a larger number of samples to be processed in a short amount of time. TaqMan Low Density Array (TLDA) is a medium-throughput innovative microfluidic design based on probe-based qPCR chemistry offering an increase in the number of miRNAs analysed on one plate. TLDA involve the use of a predefined pool of RT-primers that are used to synthesize the cDNA. These cDNAs are then spun into a customized 384 well micro-fluidic card to determine the expression of multiple miRNAs using qPCR22,26,29. Each well of the card contains dried primers and probes to amplify specific miRNA(s), therefore up to 384 reactions can be processed in single TLDA card26.
The nanofluidics array is a high-throughput platform that is used for detection of gene transcripts24 using the same probe-based chemistry. It utilizes a proprietary matrix offering hydrophobic-hydrophilic interactions to facilitate easy loading of the 33 nanoliter reaction mixture into an array of 3072 through-holes on a stainless steel slide24. This article focuses on demonstrating how these methods for quantifying miRNAs in serum/plasma are performed and the critical factors that must be considered when performing and interpreting such data. Taken to account, their individual benefits and limitations will be discussed in this article.
Protocol
Total RNA can be isolated from serum using a protocol established in our laboratory 30 or using other commercially available kits.
NOTE: Supplementary interactive spreadsheets for calculating the reaction volumes in each experiment (with the 5% excess volume accounted for pipetting included) are provided.
1. Probe-based Real-time qPCR Using a Standard 96-well Plate Platform
- cDNA synthesis (reverse transcription) on serum/plasma RNA samples for miRNA
- Calculate and take out 10 ng of RNA for each cDNA synthesis reaction. Add nuclease-free water to bring the final volume of 10 ng RNA to 1.67 µl (for a 5 µl reaction). Keep samples on ice.
- Select the miRNA and thaw their RT primers.
- Thaw the RT reagent mix components: RT Buffer (10X), dNTPs (100 mM), RNase Inhibitor (20 U/µl). Never keep place enzyme (recombinant moloney murine leukemia virus (rMoMuLV))(recombinanat moloney murine leukemia virus (rMoMuLV) reverse transcriptase (50 U/µl) on ice. Store it at -20 °C until needed or in a freezer block.
- Prepare RT reagent mix on ice as described in Table 1A. It is recommended to prepare at least 5% excess volume to compensate for pipetting error.
- Add 2.33 µl of the RT reagent mix each into a 0.2 ml PCR tube/plate.
- Vortex the RT primer tubes to mix, then centrifuge briefly at 10,000 x g for 10 sec. Add 1 µl of the miRNA specific RT primer to their respective PCR tubes or plate. Add 1.67 µl of the diluted RNA to their respective PCR tubes or wells in the plate. Perform all additions on ice.
- Centrifuge the reaction tube or plate at 1,950 x g for 5 min at 4 °C.
- Set up the miRNA cDNA synthesis programme on the thermal cycler with the following setting conditions: 16 °C for 30 min, 42 °C for 30 min, 85 °C for 5 min and 4 °C on hold.
- Set reaction volume to 10 µl. Load the reaction tubes or plate into thermal cycler. Start the RT run. Store the cDNA (RT) reactions at -20 °C, if real time PCR amplification is not immediately proceeded.
- Probe-based Real time qPCR for detection of mature miRNAs
- Thaw the selected probe-based qPCR assays (20X) for the respective RT product.
- Mix the propriety sole solution of real-time PCR (qPCR reagent mix) by swirling the bottle.
- Prepare the qPCR reagent mix for each miRNA to be analyzed. To prepare the qPCR obtain a sterile 1.5 ml microcentrifuge tube for each miRNA sample and add the components into each tube as described in Table 1B. It is recommended to prepare at least 5% excess volume to compensate for pipetting error.
- Add 4.2 µl of the respective qPCR reagent mix to each well of an optical 96-well plate (or tubes). Add 0.8 µl of respective cDNA reaction (synthesized in step 1.1 for each miRNAs) to respective well.
- Seal the plate with appropriate optical cover. Centrifuge the plate (or tubes) at 1,950 x g for 5 min at 4 °C
- Turn on the computer, 96-well plate/microfluidics array reader and finally launch the software. Ensure that the machines are correctly connected and correct block and heated lid (for fast 96 well plate) are in place.
- Select experiment as 96-well fast block (0.1 ml), standard curve, TaqMan reagents and fast mode. Set up qPCR on the Real Time PCR system using the following program cycling conditions: 95 °C for 20 sec, 50 cycles (95 °C for 1 sec, 60 °C for 30 sec).
- Set reaction volume to 10 µl. Load the reaction tube or plate into the instrument. Press “Start run”. The program will take approximately 1 hr to complete.
2. Probe-based Microfluidics Array Card (Card A and B)
NOTE: Probe-based miRNA panel comes as a set of two 384-well microfluidic cards (Array card A and Array card B). Each card contains dried Primers and probes for up to 380 miRNAs and controls. cDNA product (with or without pre-amplification) specific to card A or card B is loaded onto the respective array for real time PCR.
- Reverse Transcription (RT)
- Use this protocol for a total RNA input of 1-1,000 ng. If the input is between 1-350 ng, perform a pre-amplification (pre-amp) step. For inputs above 350 ng, load cDNA directly on the array cards without pre-amp.
NOTE: For serum miRNA profiling, start with 100 ng of total RNA. For a complete miRNA profile, run two predefined pools of RT-primer sets of RT reactions (Pool A and Pool B) per sample. - Thaw the following reagents on ice. RT Primers (10x): Pool A and Pool B, dNTPs with dTTP (100 mM), RT Buffer (10x), MgCl2 (25 mM),RNase Inhibitor (20 U/µl). Do not keep the enzyme (recombinant moloney murine leukemia virus (rMoMuLV)) reverse transcriptase (50 U/µl) on ice. Store it at -20 °C until needed.
- Gently vortex all reagents, except the enzyme, and then briefly centrifuge the tubes at 10,000 x g for 10 sec.
- Combine reagents, as described in Table 2A, into two tubes; one tube for Pool A, the other for Pool B. Each tube will contain only one predefined pool of RT primer set, either from Pool A or from Pool B. It is recommended to prepare at least 5% excess volume to compensate for pipetting error.
- Invert to mix, and then centrifuge briefly at 10,000 x g for 10 sec. Aliquot 100 ng of each RNA sample into a new tube, then add an appropriate volume of nuclease-free water to make a total of 3 µl.
- Aliquot 4.5 µl of the appropriate RT reagent mix into respective tubes. Invert to mix, and then briefly centrifuge at 10,000 x g for 10 sec. Incubate on ice for 5 min.
- Place samples into a thermocycler and start the RT using the following conditions: 40 cycles (16 °C for 2 min, 42 °C for 1 min, 50 °C for 1 sec), 85 °C for 5 min, hold at 4 °C. Store cDNA generated by using these predefined pool of RT-primers at -15 to -25 °C or used immediately.
- Use this protocol for a total RNA input of 1-1,000 ng. If the input is between 1-350 ng, perform a pre-amplification (pre-amp) step. For inputs above 350 ng, load cDNA directly on the array cards without pre-amp.
- Pre-amplification
- Thaw the predefined pool of pre-amp primers on ice. Gently vortex primers, and then briefly centrifuge them at 10,000 x g for 10 sec. Swirl TaqMan PreAmp reagent mix(2X) by gentle tapping, to mix.
- Combine reagents, as described in Table 2B, into two tubes; one tube for Pool A, the other for Pool B.
NOTE: As described above, Pool A pre-amp primers will go to tube A and Pool B primers should go to tube B. It is recommended to prepare at least 5% excess volume to compensate for pipetting error. - Invert to mix, and then briefly centrifuge at 10,000 x g for 10 sec. Aliquot 22.5 µl of the appropriate PreAmp reagent mix into new tubes. Aliquot 2.5 µl of the cDNA sample (prepared in the RT step) into the respective tube.
- Invert to mix, and then briefly centrifuge at 10,000 x g for 10 sec. Incubate on ice for 5 mins. Place samples into a thermocycler and start the pre-amp cycle. Cycling conditions: 95 °C for 10 min, 55 °C for 2 min, 72 °C for 2 min, 12 cycles (95 °C for 15 sec, 60 °C for 4 min), 99.9 °C for 10 min, hold at 4 °C.
- Invert pre-amplified cDNA to mix, and then briefly centrifuge at 10,000 x g for 10 sec. Add 75 µl of 0.1x TE Buffer (pH 8.0) to pre-amplified cDNA (1:4 dilution). Invert diluted pre-amp samples to mix, and then briefly centrifuge at 10,000 x g for 10 sec. Store diluted pre-amplified cDNA at -15 to -25 °C for up to one week, or used immediately.
- Loading microfluidics cards and performing qPCR
- Keep the microfluidics miRNA cards outside for at least half an hour to reach room temperature. Thaw diluted pre-amplified cDNA on ice and mix by inverting the tubes followed by brief spin. Mix qPCR reagent mix by swirling the bottle.
- In new tube add 450 µl of qPCR reagent mix to 9 µl of diluted pre-amplified cDNA. For card A, use pre-amplified product prepared using primer Pool A. Add 441 µl of nuclease free water to make up the final volume to 900 µl. Invert the tube to mix, and then briefly centrifuge at 10,000 x g for 10 sec.
- Remove the TLDA card from its packaging (once it reaches room temperature) and place it on a clean area with foil side down. Add 100 µl of PCR reaction mix into each of the 8 fill ports on the card. There are 2 ports on each of the reservoir (8 reservoirs in total on each card).
NOTE: The fill port is the larger hole where the reaction mix is added, whereas the vent port is the smaller hole. Each miRNA TLDA card has 8 reservoirs, each leading to 48 wells (24 wells in one column x 2 columns), thus loading all 384 wells in the card with the same PCR reaction mix. Ensure that Pool A and Pool B of each sample are loaded on respective TLDA cards. Place the array card in the specialized microfluidics array card holder buckets in the centrifuge. - For the microfluidics array cards, use a suitable centrifuge (such as Heraeus Multifuge 3SR, 230V centrifuge) and specific buckets (such as “TaqMan Array Card” holders). Each bucket can hold up to 3 cards (loaded / empty). Always ensure that all 3 slots of a bucket are occupied and the bucket is balanced by placing similar bucket (this bucket should also contain 3 cards, either empty or full) in the opposite slot of the centrifuge. While placing the card in the bucket holder, make sure that the 8 reservoirs project upwards and reaction wells face the outer wall of centrifuge.
- Spin the cards at 331 x g for 1 min at room temperature. After first spin, open the centrifuge and visually ensure the reaction mix has been dispensed through the 384 wells. Repeat the spin at same settings for 1 more time. Remove the card from bucket and ensure that the level of reaction mix in each of the 8 reservoirs is uniform. Any inconsistencies in the liquid volumes left in the reservoirs make the card inappropriate to use further.
- Microfluidics array cards need a specialized sealer that has a precision stylus assembly (carriage) to seal the fluid distribution channels of the array and equally distribute the reaction mix in all wells (total reaction volume 1 µl/well).
- Bring the carriage to the starting position and insert the loaded card into the sealer with foil side up and lined up to the stylus pins on the sealer. In a slow, steady and single uniform stroke, push the carriage across the card till it reaches the end point of the sealer. Remove the sealed array card and then cut off the reservoirs from the card using scissors.
- Ensure that the correct block, heated lid and sample carrier is installed in the microfluidics array real time PCR system/machine.
- Turn on the computer, then the microfluidics array system and finally launch the software. Ensure that the machines are correctly connected. Select experiment as array card, standard curve, TaqMan reagents and standard mode. Import the setup files for either of the card A and card B. Save the file.
- Place the sealed card in the instrument tray with well A1 at the top left corner and barcode towards the front of the instrument. Press “Start Run”. The program will take approximately 2 hr to complete.
3. Probe-based Nanofluidics Human miRNA Panel
- Reverse Transcription (RT)
- Use this protocol for a total RNA input of 50-200 ng, however 100 ng is optimal for most samples. For a complete miRNA profile, run two predefined pools of RT-primer sets of RT reactions (Pool A and Pool B) per sample.
- Thaw the reagents on ice: predefined pool of RT primer sets (10X), dNTPs with dTTP (100 mM), RT Buffer (10x), MgCl2, (25 mM), RNase Inhibitor (20 U/µl). Do not keep the enzyme (recombinant moloney murine leukemia virus (rMoMuLV) reverse transcriptase (50 U/µl) on ice. Store it at -20 °C until needed. Gently vortex all reagents, except the enzyme, and briefly centrifuge them at 10,000 x g for 10 sec.
- Combine reagents, as described in Table 3A, into two tubes; one tube for Pool A, the other for Pool B. Each tube will contain only one predefined pool of RT-primer set, either from Pool A or from Pool B. It is recommended to prepare at least 5% excess volume to compensate for pipetting error.
- Pipette to mix and then centrifuge briefly at 10,000 x g for 10 sec. Aliquot 100 ng of each RNA sample into a new tube, then add an appropriate volume of nuclease-free water to make a total of 3 µl. Aliquot 4.5 µl of the appropriate RT reagent mix into the respective tube.
- Invert to mix, and then briefly centrifuge at 10,000 x g for 10 sec. Incubate on ice for 5 min. Place samples into a thermocycler and start the RT program. Cycling conditions: 40 cycles (16 °C for 2 min, 42 °C for 1 min, 50 °C for 1 sec), 85 °C for 5 min, hold at 4 °C. Store cDNA generated using these predefined pool of RT-primer set at -15 to -25 °C or use immediately.
- Pre-amplification (pre-amp)
- Thaw the predefined pool of pre-amp primer set on ice. Gently vortex primers, then briefly centrifuge them at 10,000 x g for 10 sec. Swirl TaqMan PreAmp reagent mix(2X) to mix.
- Combine reagents, as described in Table 3B, into two tubes; one tube for Pool A, the other for Pool B. Each tube will contain only one predefined pool of RT-primer sets, either from Pool A or from Pool B. It is recommended to prepare at least 5% excess volume to compensate for pipetting error.
- Pipette to mix, and then briefly centrifuge them at 10,000 x g for 10 sec. Aliquot 22.5 µl of the appropriate PreAmp reagent mix into new tubes. Aliquot 2.5 µl of the cDNA sample into the respective tube. Invert to mix, and then briefly centrifuge the tubes at 10,000 x g for 10 sec. Incubate on ice for 5 min.
- Place samples into a thermocycler and run the pre-amp. Set reaction volume to 25 µl. Cycling conditions: 95 °C for 10 min, 55 °C for 2 min, 72 °C for 2 min, 12 cycles (95 °C for 15 sec, 60 °C for 4 min), 99.9 °C for 10 min, hold at 4 °C.
- Invert pre-amplified cDNA to mix, and then briefly centrifuge at 10,000 x g for 10 sec. In new tubes add 4 µl of pre-amplified cDNA to 156 µl of 0.1x TE Buffer pH 8.0 (1:40 dilution). Invert diluted pre-amp samples to mix, and then briefly centrifuge at 10,000 x g for 10 sec. Store diluted and undiluted pre-amplified cDNA at -15 to -25 °C for up to one week, or use immediately.
- Loading Nanofluidics Arrays and Performing qPCR
- Download the relevant plate file (.tpf) from the website31 using the nanofluidics array slide serial number. This contains the run information for the specific nanofluidics array slide.
- Thaw diluted pre-amplified cDNA and TaqMan Real-Time qPCR reagent mix (if using for the first time) on ice. Mix qPCR reagent mix by swirling the bottle. In new tubes add 22.5 µl of qPCR reagent mix to 22.5 µl of diluted pre-amplified cDNA. Gently vortex to mix, and then briefly centrifuge at 10,000 x g for 10 sec.
- Aliquot 5 µl of each sample into 8 wells (2 columns, 4 rows) of the nanofluidics array workflow 384-well sample plate. Ensure that Pool A and Pool B of each sample are in adjacent 8-well blocks (see Figure 1 or Supplementary excel sheet for layout).
- Each sample plate can contain up to eight slides worth of samples. However, the system for nanofluidics array can only process 4 nanofluidics arrays in a single run. If more than four slides worth of samples are to be loaded on one sample plate, please ensure the remaining sections are sealed. Seal with OpenArray sample plate sealer.
NOTE: It is advisable to pre-cut the sealer into the required sections, so the sections may be sealed/unsealed individually to reduce evaporation. Alternatively, the plate may be sealed with an intact sealer, and then sections can be individually cut out when loading.
- Each sample plate can contain up to eight slides worth of samples. However, the system for nanofluidics array can only process 4 nanofluidics arrays in a single run. If more than four slides worth of samples are to be loaded on one sample plate, please ensure the remaining sections are sealed. Seal with OpenArray sample plate sealer.
- Centrifuge plate at 490 x g for 1 min at 4 °C. Load the nanofluidics array slides within 1 hr. Due to the limited time allowed to seal the slides, please only load one slide at a time. Remove the nanofluidics array slide from the freezer and allow it to come to room temperature (~15 min).
- Ensure that the correct block, heated lid and sample carrier is installed in the nanofluidics array system. Turn on the computer, and real-time PCR system and the loading system. Access the respective software and ensure that the machines are connected. Remove the loading system consumables (Array slide lid, plug and immersion fluid) from packaging.
- Gently pull on the plunger of the immersion fluid syringe to loosen. Remove cap, place tip on and flush air from the tip. Place the loading system tips within the machine and remove lid. Place sample plate within PCR system.
- Put gloves on. Ensure they are tightly fitting to minimize the risk of accidentally marking the slide lid. Carefully open slide packaging. Slowly tip slide into hand. Do not touch the top of the slide.
- Place slide into the PCR system, with the barcode on the left. Remove sealer from the portion of the sample plate intended for loading. Use the loading system software to enter the slide barcode, slide position, sample position and tip configuration.
- When all relevant checks are completed, press load slide. While the PCR system is loading the slide, remove the clear and red plastic from the bottom of the slide lid. When finished loading, carefully remove and seal the slide within 90 sec.
- Place the slide within the plate clamp. Place the slide lid onto the slide. Clamp for 30 sec. Ensure the lid is positioned so that barcode is correctly displayed. Remove the assembly from the plate clamp.
- Position immersion fluid syringe within the slide so that the tip is pressing against the lid. Slowly fill slide with immersion fluid, ensuring the fluid runs along the lid. Once full, seal the slide with the plug, turning the screw until the handle breaks off.
- Remove the plastic cover on the top of the slide lid, and then carefully place into the slide carrier of the real-time PCR system. Ensure there is support on the bottom of the slide as it is being lowered, so it does not drop suddenly, and do not touch the top of the slide. It is OK to touch the sides of the slide/cassette.Initialize the PCR system and start the program for qPCR within 1 hr.
- Select “OpenArray” within the PCR-system software. Press “Find Slide IDs”. This will take a few mins. If the software cannot find the plate ID, it will ask for it to be entered manually.
- Press “Confirm Plate Centres”. Again, this will take a few mins. Check that the red dot is within the centre and that there are no fingerprints/marks on the top of the slide. Load the respective .tpf file for each slide and specify a result file name and location. Press “Start Run”. The program will take approximately 2 hr to complete.
Results
The recommended volume for a miRNA probe-based assay qPCR reaction is 20 µl. NOTE: We have confirmed that a reaction volume of 5 µl is able to produce results similar to those achieved using 20 µl volume4,7,30. Lowering the reaction volume to 5 µl allows for a 75% decrease in reagent costs without appreciable loss in sensitivity. As presented in Figure 2, reaction volumes of 20 µl and 5 µl show a strong co-relation up until 39 cycles (with r2 of 0.92, p = 0.0002).
Microfluidics array provides a tool for obtaining data on 754 miRNAs expressed in a sample in around 5 hrs (for Card A and Card B), which is a more efficient way of analyzing multiple samples as compared to conventional 96 well plate PCRs. We compared miRNA microfluidics array cards for the same sample (Sample A and Sample A repeat). Figure 3A-B shows a Bland-Altman plot (3A) and Correlation plot (3B) for all 754 miRNAs tested for these samples. There are 3 different control miRNAs (U6, RNU44 and RNU48) placed randomly on both the cards (Card A and B) in multiple locations. When U6 cycle threshold (Ct) values are compared between the 2 runs, we did not observe significant differences between the values (Table 4). It is also important to note here that U6 is expressed at greater abundance (lower Ct value) in the sample assessed. We then compared all miRNAs that have Ct values between 0-19.99 in both the runs (n = 150), which had similar expression of miRNAs overall with a co-efficient of determination of 98% (Figure 3C-D). Of all the 277 miRNAs that have Ct values between 20 and 29.99 in both the runs, 16 miRs differed significantly between the original and repeat runs (Figure 3E-F). The number of miRNAs with significant difference between the runs increased (89 of 327) when the Ct values were selected between 30-40 for both runs (Figure 3G-H).
The nanofluidics array platform provides data for 754 miRNAs from each serum/plasma sample tested, as represented in Figure 4A. It is important to examine these amplification curves – as it is with all qPCR – to ensure that the result is indicative of true amplification. Each of the 48 subarrays (Figure 1) also contains an assay for the three most popular “housekeeping” ncRNAs: U6, RNU44 and RNU48. Figure 4B illustrates a typical clustering of U6 replicates from a single sample. These replicates display low standard deviation (SD <0.5) and so are an indicator of reliability. Alternatively, Figure 4C demonstrates the increased variability of U6 replicates (SD >0.5) in a second sample. This does not negate the validity of the remaining assays, although it does necessitate a more thorough critique. U6, as with most “housekeeping” miRNAs in biological fluids, can have a variable expression. It should be noted that one of the samples, outlined in Figure 4C, displays 4-fold less U6 content than that presented in Figure 4B. Since the level of U6 in sample presented in 4C is 75% less to begin with than the one presented in panel 4B, greater technical variability is expected due to the Poisson distribution of transcripts, which is exacerbated by the small reaction volume17.
Another useful tool is the Quality control (QC) images, available for export once the run has completed. A selection of these uses the fluorescence of ROX, the passive dye found in the qPCR reagent mix, to confirm that each through-hole has been correctly loaded (Figure 5). A through-hole, or indeed an entire subarray, may not load due to insufficient sample volume, evaporation, bubbles present in the wells of the 384-well sample plate, failure to completely remove the sample plate seal, or defects within the Accufill system or its tips. Any unloaded through-holes must be identified to avoid labelling miRNAs as “undetectable”, when in reality the assay was never loaded. If this problem is encountered, confirm that at least 5 µl of sample/mastermix is loaded into each well of the 384-well sample plate, the sample plate is properly centrifuged prior to loading, the foil seal is completely removed, and the loaded OpenArray slide is sealed and run within the allotted time for all successive runs. If loading issues still persist, these may be more likely pertaining to specific batch or lot of the arrays or related consumables and further assistance should be sought through the manufacturer.

Figure 1: Layout of samples for the Nanofluidics Array workflow: (A) Each 384-well sample plate can hold samples for up to 8 nanofluidics arrays. (B) Diluted, pre-amplified cDNA is placed into 8 wells (2 columns by 4 rows), with Pool A and Pool B in adjacent 8-well groups. Each circle represents one well. (C) Each well of the sample plate will be loaded into one subarray of the nanofluidics array. Each small square represents one subarray.
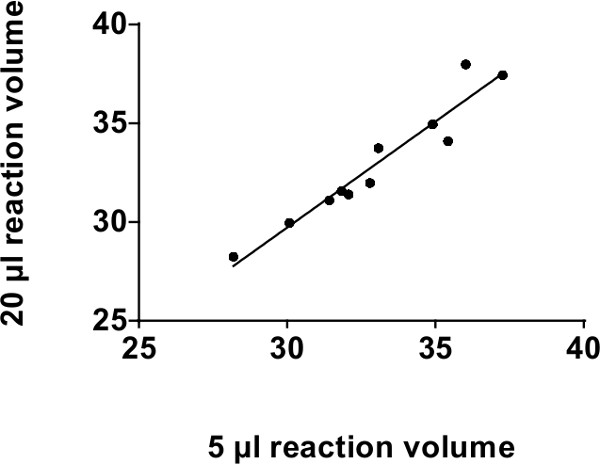
Figure 2: Co-relation analysis for conventional 96-well PCR platforms: Co-relation between 20 µl and 5 µl reaction volumes on TaqMan Real-time qPCR using a standard 96-well plate platform in CT values (39 cycles). We compared 4 different microRNAs (miR-375, miR-30c, miR-30d and miR-7) in 4 different human serum and plasma samples. Only 11 data points are plotted since the others were undetectable. R2 = 0.92, p = 0.0002.
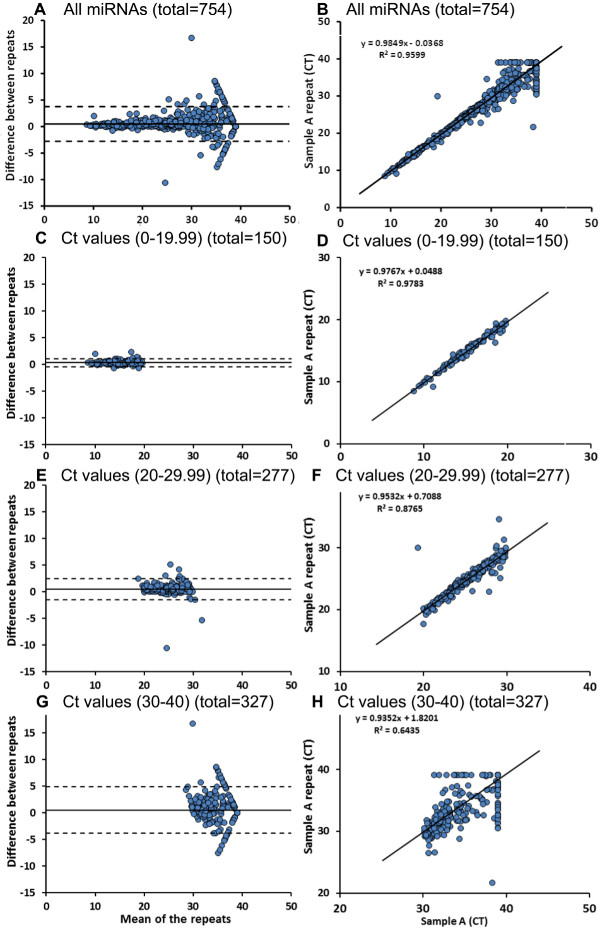
Figure 3: Circulating miRNA profiling using microfluidics array cards. Using 2 microfluidics cards (card-A and card-B), a profile of 754 miRNAs is generated (A-B). As shown here, we used same sample for 2 microfluidics array runs to check reproducibility of the microfluidics card results. We observed a similar expression of miRNAs overall, with Ct values between 0-19.99 (C-D). There are few miRNAs (16 of 277) with Ct values between 20-29.99 and significant differences between repeat runs (E-F). Eighty nine of 327 microRNAs with higher Ct values (30-40) exhibited significant differences between both runs (G-H). Data are analysed using paired T test. Please click here to view a larger version of this figure.
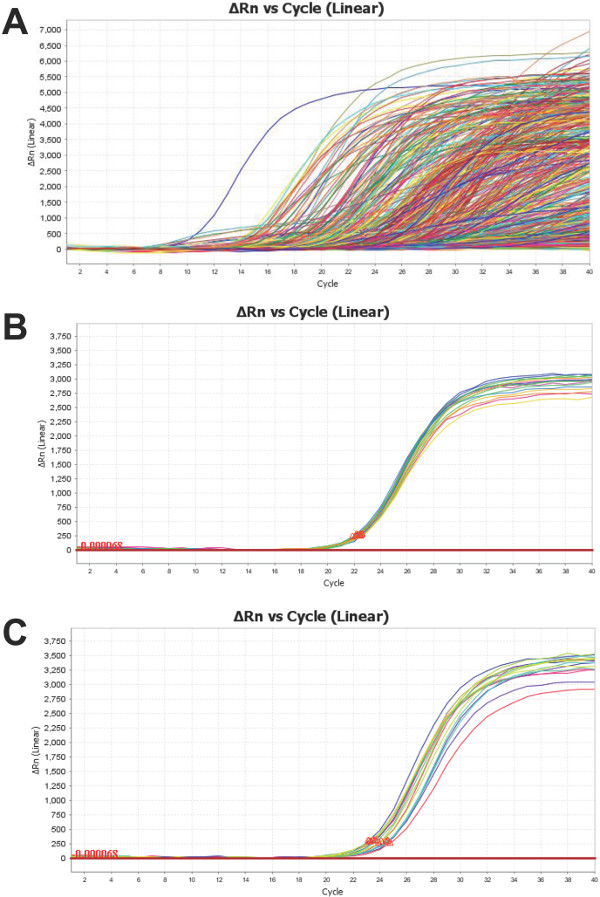
Figure 4: Representative Profile of PCR ProductAmplification Curves: Is a representative figure of the combined (A) amplification curves of all miRNA targets for a human plasma sample. An assay for U6 (a common control ncRNA) is placed in every subarray. The sample in (B) demonstrates low variability (SD <0.5) while (C) shows high standard deviation (SD >0.5) within U6 replicates. Both samples are total RNA isolated from human plasma. Please click here to view a larger version of this figure.
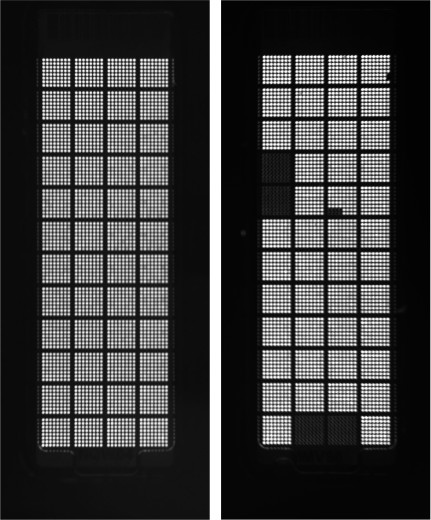
Figure 5: QC Analysis of Nanofluidics Arrays: Quality control (QC) images of a correctly loaded nanofluidics array (left) and an incorrectly loaded nanofluidics array (right). The passive dye, ROX (present in the qPCR reagent mix), fluoresces to indicate a correctly loaded through-hole. The array on the right has several subarrays/through-holes that are not loaded with the qPCR reagent mix and these should be identified as false-negative PCR reactions.
| Components | Volume per 5 µl reaction (µl) |
| RT buffer (10x) | 0.5 |
| dNTPs (100 mM) | 0.05 |
| RNase inhibitor | 0.6 |
| Nuclease-free water | 1.39 |
| Reverse Transcriptase | 0.33 |
| Total volume | 2.33 |
Table 1A: RT reagent mix components in a 5 µl RT reaction preparation for TaqMan Real-time qPCR using a standard 96-well plate platform.
| Components | Volume per 5 µl reaction (µl) | Volume per 20 µl reaction (µl) |
| Fast PCR mastermix (2x) | 2.5 | 10 |
| TaqMan qPCR assay (20x) * | 0.25 | 1 |
| Nuclease-free water | 1.45 | 5.8 |
| Total Volume: | 4.2 | 16.8 |
*assay component based on the selected miRNA tested.
Table 1B: qPCR reagent mix components in a 5 or 20 µl qPCR reaction preparation for TaqMan Real-time qPCR using a standard 96-well plate platform.
| Components | Volume per reaction (µl) |
| Megaplex RT Primers (10x) | 0.8 |
| dNTPs with dTTp (100 mM) | 0.2 |
| Multiscribe Reverse Transcriptase (50 U/µl) | 1.5 |
| 10X RT Buffer | 0.8 |
| MgCl2 (25 mM) | 0.9 |
| RNase Inhibitor (20 U/µl) | 0.1 |
| Nuclease-free Water | 0.2 |
| Total | 4.5 |
Table 2A: RT reagent mix components in a 5 µl RT reaction preparation for TLDA miRNA panel.
| Components | Volume per reaction (µl) |
| TaqMan PreAmp Mastermix (2x) | 12.5 |
| Megaplex PreAmp Primers (10x) | 2.5 |
| Nuclease-free water | 7.5 |
| Total | 22.5 |
Table 2B: PreAmp reagent mix components in a 25 µl pre-amplication reaction preparation for TLDA miRNA panel.
| Components | Volume per reaction (µl) |
| Megaplex RT Primers (10x) | 0.75 |
| dNTPs with dTTp (100 mM) | 0.15 |
| Multiscribe Reverse Transcriptase (50 U/µl) | 1.5 |
| 10X RT Buffer | 0.75 |
| MgCl2 (25 mM) | 0.9 |
| RNase Inhibitor (20 U/µl) | 0.09 |
| Nuclease-free Water | 0.35 |
| Total | 4.5 |
Table 3A: RT reagent mix components in a 5 µl RT reaction preparation for probe-based nanofluidics miRNA panel.
| Components | Volume per reaction (µl) |
| TaqMan PreAmp Mastermix (2x) | 12.5 |
| Megaplex PreAmp Primers (10x) | 2.5 |
| Nuclease-free water | 7.5 |
| Total | 22.5 |
Table 3B: PreAmp reagent mix components in a 25 µl pre-amplication reaction preparation for probe-based nanofluidics miRNA panel. NOTE: The interactive supplementary excel spreadsheets provided for the three platforms, already accounts for the 5% addition to compensate for pipetting error.
| Sample A | Sample A repeat |
| 15.535 | 16.156 |
| 15.471 | 15.652 |
| 15.623 | 16.063 |
| 15.963 | 15.889 |
| 14.006 | 13.993 |
| 14.502 | 14.623 |
| 14.907 | 14.384 |
| 13.732 | 14.946 |
Table 4: Circulating miRNA U6 profiling using microfluidics array card. Using two microfluidics array cards (A and B). Ct-values of U6 control miRNA from Sample A (total = 8). Consistent U6 control miRNA abundance observed between the runs.
Discussion
The critical steps within the probe-based qPCR protocols to obtain accurate and reproducible results are to make sure 1) the same volume and concentration of RT-product is loaded in each qPCR reaction, 2) the correct ratios and volumes of the components needed for qPCR reaction are prepared and mixed well, 3) the correct and consistent volumes are added to each qPCR reaction, and 4) the preparation and loading of each sample and reaction mix is completed in the shortest amount of time as possible, while still mindful of the above critical steps mentioned earlier.
The microfluidics array cards need suitable centrifuge and specific buckets. Each bucket can hold up to 3 cards (loaded / empty). Always ensure that all 3 slots of a bucket are occupied and the bucket is balanced by placing similar bucket (this bucket should also contain 3 cards, either empty or full) in the opposite slot of the centrifuge. While placing the card in the bucket holder, make sure that the 8 reservoirs project upwards and reaction wells face the outer wall of centrifuge. Spin the cards at 331 x g for 1 min at room temperature. After first spin, open the centrifuge and visually ensure the reaction mix has been dispensed through the 384 wells. Repeat the spin at same settings for 1 more time. Remove the card from bucket and ensure that the level of reaction mix in each of the 8 reservoirs is uniform. Any inconsistencies in the liquid volumes left in the reservoirs make the card inappropriate to use further.
To have the same concentration of the RT-product, same input concentration of RNA is added into each RT reaction. The total RNA concentration is measured using a micro-volumespectrophotometer. The observed 260/280 ratio can be as low as 1.3 for the RNA isolated from plasma/serum; this does not appear to have an effect on downstream qPCR-related process or data generated30. Likewise, the 260/280 ratio of the RNA samples tested herein were between 1.3-1.7 with no abnormal effects in the qPCR observed.
When using low RNA content samples, such as those from biofluids, it may be difficult to quantify RNA prior to processing. We recommend the use of synthetic spike-in at the RNA isolation as well as the reverse transcription stages. In our experience, Arabidopsis thaliana miRNA candidates (ath-miR-159a and ath-miR-172a) are preferred over Caenorhabditis elegans miRNAs (such as cel-miR-39 or cel-miR-54), which in our experience may have higher homology than those from A. thaliana. The use of such stage-specific spike-in can account for the normalization of miRNA data across multiple samples assayed at different times. Using a fixed input volume of RNA for cDNA synthesis reaction is also recommended32,33.
The three probe-based protocols for miRNA quantification described here require varying amounts of total RNA input, different workflows and costs. Each of the workflows are designed to cater for different throughputs based on the number of miRNA targets and the number of samples to be analyzed. With increasing throughput (96 rxn 384 rxn 3072 rxn), the cost per reaction decreases with an increase in the amount of data obtained over a unit of time. Since all of these platforms utilize TaqMan chemistry, the quality of data obtained can be expected to be similar. TaqMan qPCR is a well-established method for identifying the abundance of miRNAs in serum/plasma samples9,11,27. Although the three platforms discussed here share the same chemistry, a decrease in the reaction volume leads to a decrease in dynamic range of transcript detection (Farr RJ et al., unpublished data). The 96-well qPCR platform is a lower throughput, but high sensitivity platform and in our view, the “gold standard” for all probe-based (or dye based) PCR platforms. However, this may not be the most economical or efficient platform if several hundred or thousands of samples are being assayed and for multiple microRNAs. Microfluidics (TLDA) and nanofluidics (OA) platforms are high-throughput / content platforms designed to allow acquisition of larger data in a shorter time. Although batch differences have been observed in the TLDA cards, this can be minimized by requesting TLDA cards from the same batch. We observe that TLDA platform (Figure 3) showed significant variation in 17% of mid – low abundance miRNAs when tested using the same sample on different batches of TLDA cards. We therefore recommend using the same batch numbers for analysis using TLDA cards. This variation could also be due to the technical variability including any potential loading and pipetting errors. However, we recommend ordering/requesting the same batch of TLDA cards. No significant batch variation was observed on the OA platform. Despite this, TaqMan based experimental qPCR approaches offer ease to measure the abundance of miRNAs in plasma/serum samples. The low, medium and high throughput approaches discussed here offer the flexibility to analyse a range of samples and miRNAs using a highly efficient, reproducible and clean (low background noise) chemistry.
Disclosures
Article processing/publication costs were covered by Life Technologies, following acceptance of this manuscript for publication.
Acknowledgements
All authors acknowledge the infrastructure support from the NHMRC CTC, University of Sydney, the Juvenile Diabetes Research Foundation (JDRF), Australia and the Rebecca Cooper Foundation, Australia. This research was funded through grants from the Australian Research Council (FT110100254) and the JDRF, Australia (CRN201314) to AAH WW, RJF and MVJ carried out all wet lab experimentation, ASJ carried out data analysis. WW wrote the first draft. AAH planned the study and analysed the data. All authors read and agreed on the final version of the manuscript, figures and worksheets submitted for publication.
Materials
| Name | Company | Catalog Number | Comments |
|---|---|---|---|
| 96 well-platform | |||
| For Reverse transcription | |||
| TaqMan MicroRNA Assays INV SM | Applied Biosystems | 4427975 | https://www.lifetechnologies.com/au/en/home/life-science/pcr/real-time-pcr/real-time-pcr-assays/mirna-ncrna-taqman-assays/single-tube-mirna-taqman-assays.html?ICID=search-4427975 The assays comes as a pack of RT primers and PCR primer. |
| TaqMan MicroRNA Reverse Transcription Kit | Applied Biosystems | 4366597 or 4366596 | https://www.lifetechnologies.com/order/catalog/product/4366597?ICID=search-4366597 or http://www.lifetechnologies.com/order/catalog/product/4366596?ICID=search-4366596 The TaqMan MicroRNA Reverse Transcription Kit is the same kit used for reverse transcription in all the threeTaqMan platform- 96-well platform, TLDA and OpenArray. |
| For qPCR run on a 96-well platform | |||
| 2x TaqMan Fast Universal PCR Master Mix, no AmpErase UNG | Applied Biosystems | 4367846 | https://www.lifetechnologies.com/order/catalog/product/4367846?ICID=search-4367846 The 2X TaqMan Fast Universal PCR Master Mix is used for qPCR on the two TaqMan platforms-96-well platform and TLDA. |
| MicroAmp Optical Adhesive Film | Applied Biosystems | 4311971 | https://www.lifetechnologies.com/order/catalog/product/4311971?ICID=search-product |
| MicroAmp Fast Optical 96-Well Reaction Plate, 0.1 ml | Applied Biosystems | 4346907 | https://www.lifetechnologies.com/order/catalog/product/4346907?ICID=search-product |
| Microfluidics platform (TLDA) | |||
| For Reverse transcription | |||
| Refer to 96-well platform TaqMan MicroRNA Reverse Transcription Kit kit (4366597 or 4366596) (as shown above). | |||
| Megaplex RT Primers, Human Pool A v2.1 | Applied Biosystems | 4399966 | https://www.lifetechnologies.com/order/catalog/product/4399966?ICID=search-4399966 The Megaplex RT Primers, Human Pool A v2.1 is used for RT on the two TaqMan platforms- TLDA and OpenArray. |
| Megaplex RT Primers, Human Pool B v3.0 | Applied Biosystems | 4444281 | https://www.lifetechnologies.com/order/catalog/product/4444281?ICID=search-4444281 The Megaplex RT Primers, Human Pool B v3.0 is used for RT on the two TaqMan platforms- TLDA and OpenArray. |
| OR | OR | ||
| Megaplex Primer Pools, Human Pools Set v3.0 | Applied Biosystems | 4444750 | http://www.lifetechnologies.com/order/catalog/product/4444750?ICID=search-4444750 The Megaplex Primer Pools, Human Pools Set v3.0 is used for RT on the two TaqMan platforms- TLDA and OpenArray. |
| For Pre-amplification | |||
| TaqMan PreAmp Master Mix | Applied Biosystems | 4391128 or 4488593 | https://www.lifetechnologies.com/order/catalog/product/4391128?ICID=search-4391128 or http://www.lifetechnologies.com/order/catalog/product/4488593 The TaqMan PreAmp Master Mix is used for pre-amplification of qPCR on the two TaqMan platforms- TLDA and OpenArray. |
| Megaplex PreAmp Primers, Human Pool B v3.0 | Applied Biosystems | 4444303 | https://www.lifetechnologies.com/order/catalog/product/4444303?ICID=search-4444303 The Megaplex PreAmp Primers, Human Pool B v3.0 is used for pre-amplification of qPCR on the two TaqMan platforms- TLDA and OpenArray. |
| Megaplex PreAmp Primers, Human Pool A v2.1 | Applied Biosystems | 4399233 | https://www.lifetechnologies.com/order/catalog/product/4399233?ICID=search-4399233 The Megaplex PreAmp Primers, Human Pool A v2.1 is used for pre-amplification of qPCR on the two TaqMan platforms- TLDA and OpenArray. |
| 1x TE Buffer (100 ml) | Invitrogen | 12090-015 | https://www.lifetechnologies.com/order/catalog/product/12090015?ICID=search-product The 1x TE Buffer is used for pre-amplification of qPCR on the two TaqMan platforms- TLDA and OpenArray. |
| To load and run the 384 well microfluidics (TLDA) card | |||
| TaqMan Array Human MicroRNA A+B Cards Set v3.0 | Applied Biosystems | 4444913 | https://www.lifetechnologies.com/order/catalog/product/4444913 |
| Nanofluidics platform (OpenArray) | |||
| For Reverse transcription | |||
| Refer to 96-well platform TaqMan MicroRNA Reverse Transcription Kit kit (4366597 or 4366596) (as shown above). | |||
| For Pre-amplification | |||
| Refer to TLDA pre-amplification reagents (as shown above) | |||
| To load and run the slides | |||
| TaqMan OpenArray Human MicroRNA Panel, QuantStudio 12K Flex (1 panel) | Applied Biosystems | 4470187 | https://www.lifetechnologies.com/order/catalog/product/4470187?ICID=search-4470187 |
| QuantStudio 12K Flex OpenArray Accessories Kit | Applied Biosystems | 4469576 | https://www.lifetechnologies.com/order/catalog/product/4469576?ICID=search-4469576 |
| OpenArray 384-well Sample Plates | Applied Biosystems | 4406947 | https://www.lifetechnologies.com/order/catalog/product/4406947?ICID=search-4406947 |
| TaqMan OpenArray Real-Time PCR Master Mix | Applied Biosystems | 4462159 | https://www.lifetechnologies.com/order/catalog/product/4462159?ICID=search-4462159 |
| OpenArray AccuFill System Tips | Applied Biosystems | 4457246 | https://www.lifetechnologies.com/order/catalog/product/4457246?ICID=search-4457246 |
| Others | |||
| Nuclease-Free Water | Qiagen | 129117 | http://www.qiagen.com/products/catalog/lab-essentials-and-accessories/nuclease-free-water |
References
- Ambros, V. The functions of animal microRNAs. Nature. 431, 350-355 (2004).
- Alvarez-Garcia, I., Miska, E. A. MicroRNA functions in animal development and human disease. Development. 132, 4653-4662 (2005).
- Bartel, D. P. MicroRNAs: genomics, biogenesis, mechanism, and function. Cell. 116, 281-297 (2004).
- Joglekar, M. V., Wei, C., Hardikar, A. A. Quantitative estimation of multiple miRNAs and mRNAs from a single cell. Cold Spring Harb Protoc. 2010, pdb prot5478(2010).
- Joglekar, M. V., Parekh, V. S., Hardikar, A. A. Islet-specific microRNAs in pancreas development, regeneration and diabetes. Indian J Exp Biol. 49, 401-408 (2011).
- Farr, R. J., Joglekar, M. V., Taylor, C. J., Hardikar, A. A. Circulating non-coding RNAs as biomarkers of beta cell death in diabetes. Pediatr Endocrinol Rev. 11, 14-20 (2013).
- Joglekar, M. V., Joglekar, V. M., Hardikar, A. A. Expression of islet-specific microRNAs during human pancreatic development. Gene Expr Patterns. 9, 109-113 (2009).
- Iorio, M. V., Croce, C. M. MicroRNA profiling in ovarian cancer. Methods Mol Biol. 1049, 187-197 (2013).
- Mitchell, P. S., et al. Circulating microRNAs as stable blood-based markers for cancer detection. P Natl Acad Sci USA. 105, 10513-10518 (2008).
- Mattie, M. D., et al. Optimized high-throughput microRNA expression profiling provides novel biomarker assessment of clinical prostate and breast cancer biopsies. Mol Cancer. 5, 24(2006).
- Zhu, W., Qin, W., Atasoy, U., Sauter, E. R. Circulating microRNAs in breast cancer and healthy subjects. BMC Res Notes. 2, 89(2009).
- Zhu, H. T., et al. Identification of suitable reference genes for qRT-PCR analysis of circulating microRNAs in hepatitis B virus-infected patients. Mol Biotechnol. 50, 49-56 (2012).
- Yamada, H., Itoh, M., Hiratsuka, I., Hashimoto, S. Circulating microRNAs in autoimmune thyroid diseases. Clin Endocrinol (Oxf). , (2014).
- Liu, R., et al. Serum MicroRNA Expression Profile as a Biomarker in the Diagnosis and Prognosis of Pancreatic Cancer. Clinical Chemistry. 58, 610-618 (2012).
- Gilad, S., et al. Serum microRNAs are promising novel biomarkers. PLoS One. 3, e3148(2008).
- Joglekar, M. V., Parekh, V. S., Mehta, S., Bhonde, R. R., Hardikar, A. A. MicroRNA profiling of developing and regenerating pancreas reveal post-transcriptional regulation of neurogenin3. Dev Biol. 311, 603-612 (2007).
- Hardikar, A. A., Farr, R. J., Joglekar, M. V. Circulating microRNAs: understanding the limits for quantitative measurement by real-time PCR. J Am Heart Assoc. 3, e000792(2014).
- Wu, C., et al. Diagnostic and Prognostic Implications of a Serum miRNA Panel in Oesophageal Squamous Cell Carcinoma. PLoS One. 9, e92292(2014).
- McDonald, M. K., Capasso, K. E., Ajit, S. K. Purification and microRNA profiling of exosomes derived from blood and culture media. J Vis Exp. , e50294(2013).
- Joglekar, M. V., et al. The miR-30 family microRNAs confer epithelial phenotype to human pancreatic cells. Islets. 1, 137-147 (2009).
- Genda, Y., et al. microRNA changes in the dorsal horn of the spinal cord of rats with chronic constriction injury: A TaqMan(R) Low Density Array study. Int J Mol Med. 31, 129-137 (2013).
- Wang, B., et al. Systematic evaluation of three microRNA profiling platforms: microarray, beads array, and quantitative real-time PCR array. PLoS One. 6, e17167(2011).
- Cuk, K., et al. Circulating microRNAs in plasma as early detection markers for breast cancer. Int J Cancer. 132, 1602-1612 (2013).
- Morrison, T., et al. Nanoliter high throughput quantitative PCR. Nucleic Acids Res. 34, e123(2006).
- Git, A., et al. Systematic comparison of microarray profiling, real-time PCR, and next-generation sequencing technologies for measuring differential microRNA expression. RNA. 16, 991-1006 (2010).
- Benes, V., Castoldi, M. Expression profiling of microRNA using real-time quantitative PCR, how to use it and what is available. Methods. 50, 244-249 (2010).
- Chen, C., et al. Real-time quantification of microRNAs by stem-loop RT-PCR. Nucleic Acids Res. 33, e179(2005).
- Schmittgen, T. D., et al. Real-time PCR quantification of precursor and mature microRNA. Methods. 44, 31-38 (2008).
- Kodani, M., et al. Application of TaqMan low-density arrays for simultaneous detection of multiple respiratory pathogens. J Clin Microbiol. 49, 2175-2182 (2011).
- Taylor, C. J., Satoor, S. N., Ranjan, A. K., Pereirae Cotta,, V, M., Joglekar, M. V. A protocol for measurement of noncoding RNA in human serum. Exp Diabetes Res. 2012, 168368(2012).
- TPF & SPF File Download Options [Internet]. , Available from: http://www.appliedbiosystems.com/absite/us/en/home/products/tpf-spf-download.html (2014).
- Turchinovich, A., Weiz, L., Langheinz, A., Burwinkel, B. Characterization of extracellular circulating microRNA. Nucleic Acids Res. 39, 7223-7233 (2011).
- Li, Y., Kowdley, K. V. Method for microRNA isolation from clinical serum samples. Anal Biochem. 431, 69-75 (2012).
Reprints and Permissions
