During postnatal cerebellum development, immature granule cells originating from the germinal zone exhibit distinct modalities of migration to reach their final destination and to establish neuronal networks. This protocol describes the preparation of cerebellar slices and the confocal macroscopic approach used to investigate the factors that regulate neuronal migration.
Method Article
Ex Vivo Imaging of Postnatal Cerebellar Granule Cell Migration Using Confocal Macroscopy
In This Article
Summary
Abstract
During postnatal development, immature granule cells (excitatory interneurons) exhibit tangential migration in the external granular layer, and then radial migration in the molecular layer and the Purkinje cell layer to reach the internal granular layer of the cerebellar cortex. Default in migratory processes induces either cell death or misplacement of the neurons, leading to deficits in diverse cerebellar functions. Centripetal granule cell migration involves several mechanisms, such as chemotaxis and extracellular matrix degradation, to guide the cells towards their final position, but the factors that regulate cell migration in each cortical layer are only partially known. In our method, acute cerebellar slices are prepared from P10 rats, granule cells are labeled with a fluorescent cytoplasmic marker and tissues are cultured on membrane inserts from 4 to 10 hr before starting real-time monitoring of cell migration by confocal macroscopy at 37 °C in the presence of CO2. During their migration in the different cortical layers of the cerebellum, granule cells can be exposed to neuropeptide agonists or antagonists, protease inhibitors, blockers of intracellular effectors or even toxic substances such as alcohol or methylmercury to investigate their possible role in the regulation of neuronal migration.
Introduction
In the developing cerebellum, eight different types of neurons are produced sequentially between the second embryonic week and the second postnatal week in rodents1. Originating initially from, a primary germinal zone, immature granule cells (GC) are the last neurons to be produced from the external granular layer (EGL), a secondary germinal zone2. During the first three postnatal weeks, the cerebellar cortex is a foliated structure organized in four layers including the EGL, the molecular layer (ML), the Purkinje cell layer (PCL) and the internal granular layer (IGL) (Figure 1). Through centripetal migration, immature GCs, glutamatergic interneurons, reach the IGL within approximately 2 days. By the third postnatal week, the EGL disappears and the IGL constitutes what is called the granular layer (GL) in the adult cerebellum. In the GL, GCs receive excitatory synaptic inputs from mossy fibers and unipolar brush cells, and inhibitory synaptic inputs from Golgi cell axons. In the ML, GC axons make excitatory synapses with GABAergic neurons including Purkinje cells, basket cells, stellate cells, and Golgi cells2.
Real-time observation of cell movement in acute cerebellar slices obtained from early postnatal rodents demonstrates that GCs modify their shape concomitantly with changes in the modality and speed of migration during their route in the cerebellar cortex3. During first two postnatal weeks, GC precursors actively proliferate at the top of the EGL. In the middle part of the EGL, postmitotic GCs migrate tangentially in the direction of their larger process. At the EGL-ML border, GCs slow their movement, the cells begin to enter a short vertical descending process into the ML. In the ML, GCs have a vertically elongated cell body, a thin trailing process and a more voluminous leading process, and migrate radially along the Bergmann glial fibers. In the PCL, GCs stop their movement but after a prolonged stationary phase (2 hr), they cross the PCL-IGL border. In the IGL, GCs migrate towards the bottom of the layer in the absence of glial fiber support. Once the tips of the leading process approach the IGL-white matter (WM) border, GCs slow and stop their movement. Transverse sections of the cerebellum are preferred for tangential migration studies in the EGL while sagittal slices are dedicated to radial migration in the ML, PCL and IGL. Some regulatory factors of GC movements including neuropeptides (e.g., somatostatin, PACAP) have been identified so far but the complete mechanisms involved in the spatio-temporal control of GC migration in each cortical layer are still largely unknown1,4,5,6.
GC migration has been studied during the last 20 years through video- and confocal microscopy using either transmitted light illumination for isolated cultured cells or fluorescence detection for acute cerebellar slices. Initially lipophilic DiI, and more recently “Cell Tracker” dyes and cell-expressed fluorescent proteins were used for confocal or two-photon microscopy7,8. Successful experiments depend on a number of specific procedures that make the protocol simple but not easy. In particular, acute slices have to be stabilized during observations generally with a home-made nylon mesh network9. The intensity of light illumination has to be as low as possible to avoid phototoxicity and photobleaching as proposed by multipoint scanning confocal microscope approach. In addition, temperature and CO2 are key environmental parameters since instability may affect neuronal migration. To facilitate and refine the experimental procedures, we have developed a confocal macroscopy protocol that limits slice movements, ensures constant environmental parameters, reduces photobleaching, increases field of view (on the order of milimeters) and consequently the number of cells (dozens) that can be tracked through image analysis. Thus, 180 µm thick slices are cultured on membrane inserts, and 6-well plates are directly transferred under a 2X motorized objective of a commercial confocal macroscope equipped with a large incubation chamber, temperature and CO2 controllers and a vibration control system. Time-lapses and z-stacks are then performed over several hours and pharmacological tools or bioactive molecules can be added or delivered in the incubation medium. This method could also be adapted to study the migration of the other types of neurons in the cerebellum or cerebrum at different developmental stages.
Protocol
Animals (male or female Wistar rats) were born and bred in an accredited animal facility (approval B.76-451-04), according to the French guide for the care and use of laboratory animals. Experiments were conducted under the supervision of authorized investigators (M.B, D.V. and L.G.) in accordance with the European Community Council Directive (2010/63/UE of September 22, 2010) and the French Ministry of Agriculture.
1. Preparation of Media and Tools
- In a biological safety cabinet, prepare 1x Hank’s BSS (HBSS) in sterile water from 10x stock solution containing CaCl2 (1.85 g/l) /MgSO4 (0.9767 g/l) without MgCl2. Add NaHCO3 (350 µg/ml) to 1x solution of HBSS.
- In a biological safety cabinet, add N2 supplement (from a 100x stock solution) and penicillin (100 units/ml) -streptomycin (0.1 mg/ml) solution to Dulbecco’s modified eagle medium (DMEM) nutrient mixture F-12 (1 : 1).
- In sterile conditions, prepare an aliquot (25 µl, 2 mM) of the cytoplasmic fluorescent dye called Cell Tracker Green in DMSO (1.075 ml for 1 mg). Dilute one aliquot in 5 ml of DMEM in a 15 ml conical tube.
- Prepare filled ice-bucket to keep media at 4 °C.
- Decontaminate laboratory bench tops and tools with 70% ethanol.
2. Dissection of Cerebellum from P10 Rats
- Rapidly decapitate rat pups (P10) with curved operating scissors behind ears in order to get the beginning of the spinal cord.
- At the back-side of the decapitated head, make midline incision of the skin from the neck to the nose with fine iris scissors and separate the skin from the skull with fine iris scissors and Dumont #3 forceps.
- Use fine iris scissors to delicately make two lateral incisions from the base to the rostral region of the skull. Remove the dissected skull with two #3 forceps. Detach the brain from any adherence with the skull using the same forceps.
- Transfer the brain with the spoon end of a spatula to Petri dish (Ø 35 mm) containing 2 ml of ice-cold HBSS medium.
- Put the Petri dish containing the brain in a larger Petri dish (Ø 100 mm) full of ice and transfer to the stage of the stereomicroscope.
- Under a stereomicroscope, isolate the cerebellum from the brain by dilaceration using two #3 forceps. Similarly, remove the residual spinal cord and the pial-membrane.
- Transfer the cerebellum in a new HBSS-filled Petri dish (Ø 35 mm, 2 ml) with the spoon end of a spatula and keep on ice.
3. Preparation of Acute Cerebellar Slices
- Under the stereomicroscope, cut the cerebellum between the vermis and the right hemisphere as indicated by the two heads arrow in Figure 2A with a standard scalpel handle #3 solid and a #15 surgical blade.
- Put one drop of cyanoacrylate glue on the vibratome specimen disc and wait 15-25 sec to eliminate toxic solvent vapors.
- Collect the cut cerebellum with the spoon end of a spatula and remove excess HBSS with clean paper towels.
- Bring the cerebellum close to the specimen disc. Fix the cut edge to the specimen disc and wait 10 sec.
- Insert the specimen disc into the buffer tray with the manipulator, and rotate it so the transverse axis of the cerebellum is perpendicular to the knife holder. Fix the specimen disc with an Allen key and fill gently the buffer tray with HBSS medium until the cerebellum is covered.
- Load crushed ice into the cooling bath.
- Clean the blade three times with 70% ethanol to eliminate any oil.
- Insert the blade into the knife holder and secure with clamping screw.
- Place the blade edge right behind the rear edge (from user's view) of the specimen and define it as a starting point. Use forward command to define the ending point after the front edge of the specimen.
- Select sectioning speed at 2.5 and sectioning frequency at 8. Select trimming thickness at 180 µm. Start tissue sectioning.
- Pick up each section using a wide-bore glass truncated Pasteur pipette and transfer to HBSS-containing Petri dish (Ø 35 mm) kept on ice.
- Using two #5 forceps, remove the meninges carefully from the cerebellum when interfering with the blade. Collect a maximum of 5 slices per cerebellum (Figure 2B, C).
- Remove the meninges from the cerebellar slices carefully with two #5 forceps under the stereomicroscope and separate the lobules gently for better probe loading.
4. Fluorescent Staining of Living Interneurons
- Transfer cerebellar slices with a wide-bore glass truncated Pasteur pipette to a 6-well plate (max 3 slices/per well). Aspirate the HBSS medium.
- Incubate slices (3 max) in 5 ml of loading solution of the fluorescent dye (10 µM).
- To protect from light, cover the microplate with aluminum foil. Put it on a gyro-moving table at 35 rpm for 10 min at RT to facilitate cell labeling.
- Transfer slices on the membrane of a Transwell insert (3.0 µm pore size; Figure 2D) with a wide-bore glass truncated Pasteur pipette. Aspirate the loading medium with pipette.
- Remove the insert and fill the well with 1.9 ml of DMEM. Replace the insert and add 100 µl of DMEM on top of the slice to cover the tissue.
- Place the plate containing the culture inserts in the incubator chamber (37 °C, 5% CO2) for 2 hrs which is sufficient to observe GCs in the ML. Lie tissues flat to allow attachment on the insert membrane (Figure 2E). Ensure that slices are not drying.
5. Ex vivo Imaging Through Confocal Macroscopy
- Transfer the plate without the plastic lid into an incubator attached to the stand of a confocal macroscope. Place a glass cover on the plate insert of the macroscope. Keep the temperature of the chamber at 37.0 °C ± 0.5 °C, and supply the slices with constant gas flow (95% O2, 5% CO2) through the plate insert to maintain the pH constant. Wait for 2 additional hr before time-lapse experiment.
- To visualize GC migration in the tissue slices, illuminate the preparation with a 488 nm wavelength light by means of a laser diode through a confocal laser scanning macroscope equipped with a X2 dry objective (working distance: 39 mm, diameter: 58 mm, NA = 0.234), and detect fluorescence emission from 500 to 530 nm.
- To finely resolve the movement of GCs, acquire images with an additional optical zoom factor of 1.5 to 2.0. Collect images of GNs in a single focal plane or up to 10 different focal planes along the z-axis every 30 min for up to 12 hr.
- When necessary, remove the glass cover and add small volumes (1-10 µl) of biological activators or inhibitors in DMEM with a 10 µl pipette to study their effect on GC migration.
6. Cell Tracking
- For each time of the movie, perform z-stack projection through the ecart-type mode in ImageJ. Modulate the contrast and the brightness levels of the successive images to facilitate the identification and the tracking of labeled GCs. Map manually each position on the reference snapshot (at t = 0).
- Use the “Manual tracking” plugin in the Analyse Particle Menu and determine by clicking the gravity point of each cell body during time-lapse. Export the raw tracking data in a spreadsheet.
- Reorganize the exported raw tracking data from ImageJ with a smart home-made program (http://primacen.fr, written in PHP code) that identify each cell and associated positions. Using the program, calculate the total traveled distance and the average speed of migration for each cell. Classify and compare characteristics of cell migration in control and treatment conditions under appropriate filters using the same program.
Results
In the early postnatal cerebellum, GCs exhibit significant changes in their mode and speed of migration as they cross different cortical layers1 (Figure 1). This section illustrates examples of results that can be obtained by studying GC migration in their natural cellular milieu. P10 rat cerebellar tissue slices labeled with a green fluorescent dye are examined under a confocal macroscope (Figure 3A) and we show that GCs migrate radially in the ML with an average speed of 18 µm/hr (Figure 3B, C). To date, the role of interactions/communications between neuronal and glial cells including the regulatory factors and molecular mechanisms involved in the control of cell migration in each cortical layer are largely unknown. Consequently, the main issue is to identify neuropeptides, neurotransmitters, neurotrophins and extracellular matrix components that could play a role in these cortical layer-specific changes of the speed during their migration process. Pituitary adenylate cyclase-activating polypeptide (PACAP) is detected mainly in the PCL, but also in the ML and the IGL during the first two postnatal weeks in rodents7,10,11. Application of PACAP38 (10-6 M) to the culture medium resulted in a 79% speed decrease of the GC in the ML. For example, the migration velocity of GCs in the ML dropped from 11.9 µm/hr in control conditions to 2.5 µm/hr after administration of PACAP38 (Figure 4A). Tissue-type plasminogen activator (tPA) is a member of the proteolytic cascade that leads to the degradation of the extracellular matrix (EM) components such as cell adhesion molecules or laminin12,13. tPA and plasminogen, a substrate of tPA, are detected in cortical layers during development of the postnatal cerebellum14,15,16. Administration of PAI-1 (10-7 M), an inhibitor of endogenous tPA, reduced by 78% the GC migration in the ML. For example, GCs reduced migration speed in the ML from 19.2 µm/hr in control conditions to 4.2 µm/hr after addition of PAI-1 (Figure 4B). These results indicate that PACAP exerts a direct inhibitory effect on GC movements and that the serine protease tPA facilitates the migration of GCs in the ML of the developing rat cerebellum.
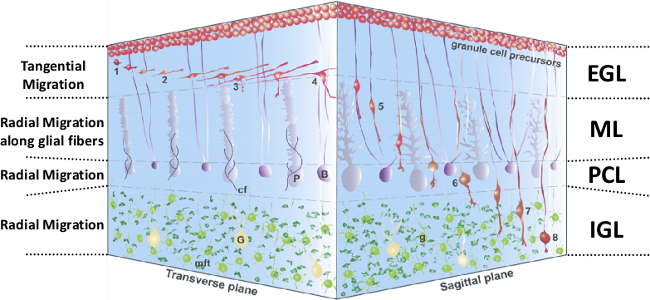
Figure 1: 3D representation of GC migration in the postnatal cerebellar cortex. 1-4, Extension of GC processes and tangential migration in the EGL. 5, Radial migration in the ML along Bergmann glial fibers. 6, Transient stationary phase in the PCL. 7, Glial-independent radial migration in the IGL. 8, Completion of GC migration in the IGL. GC, granule cell, in red; EGL, external granular layer; B, Bergmann glia, in dark purple; G, Golgi cell, in yellow; cf, climbing fibers, in blue; g, postmigratory granule cells, in light green; IGL, internal granular layer; mft, mossy fiber terminal, in dark green; ML, molecular layer; P, Purkinje cell, in light purple; PCL, Purkinje cell layer. This figure has been modified from 5.
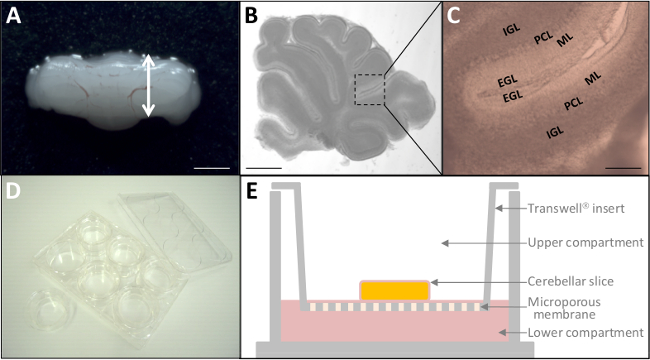
Figure 2: Ex vivo culture of P10 cerebellar slices. (A) Dissected cerebellum from P10 rat. Scale bar = 6 mm. (B) Micrograph of living 180 µm-thick cerebellar slice through stereomicroscopy. Scale bar = 3 mm. (C) At a higher magnification, the four cortical layers (EGL, ML, PCL, IGL) of the cerebellum are already distinguishable. Scale bar = 1 mm. (D) After fluorescent labeling, tissue slices are placed on culture inserts (24 mm diameter) into a 6-well plate. (E) Schematic representation of a culture insert with tissue culture treated polyester membrane. Please click here to view a larger version of this figure.
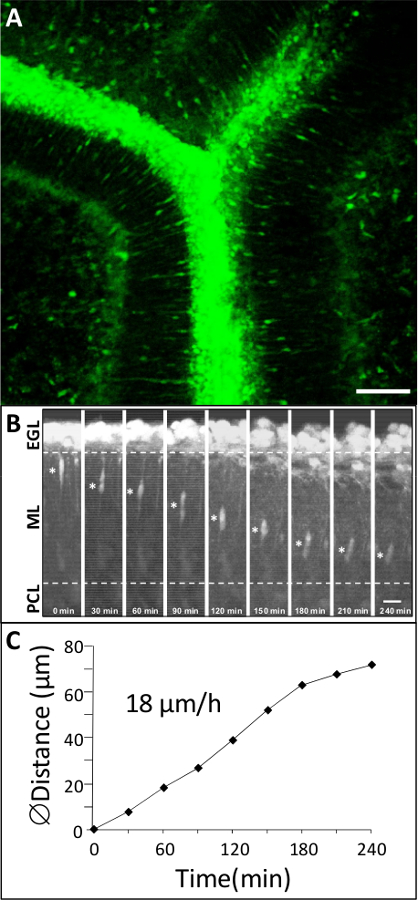
Figure 3: Dynamic migration of GCs in the cortical layers of rat P10 cerebellum. (A) Macroconfocal view (xyz, 2D projection) of a P10 rat cerebellar slice in which GCs are labeled with a green cytoplasmic fluorescent dye. Scale bar = 75 µm. (B) Time-lapse imaging showing GC movements in the ML by confocal macroscopy for 4 hr in control conditions. Asterisk (*) symbol marks the GC soma. Elapsed time (in min) is indicated on the bottom of each photomicrograph. Scale bar = 10 µm. (C) Sequential changes in the distance traveled by GC soma.
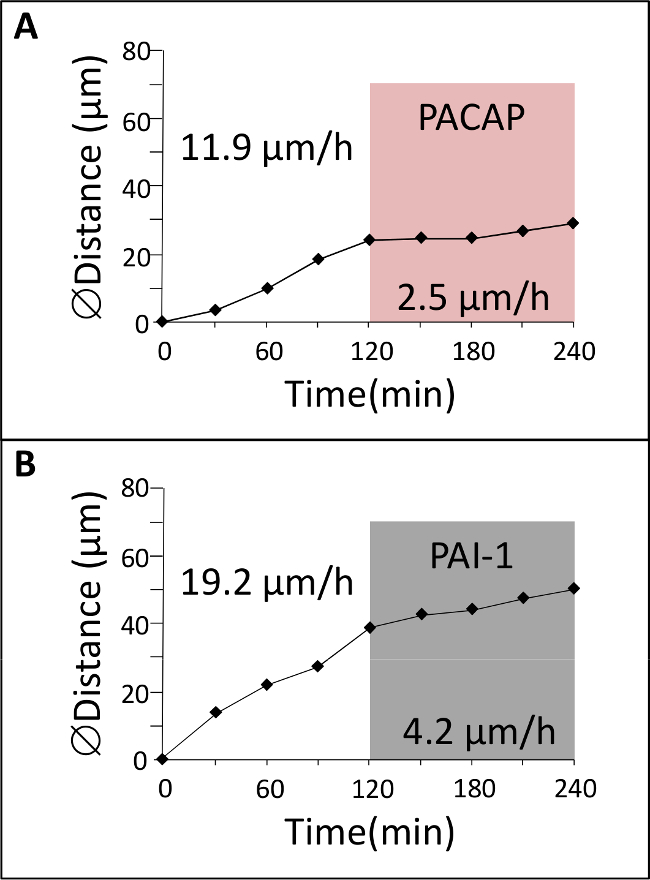
Figure 4: Effect of neuropeptide and protease inhibitor of GC migration. (A) GC was tracked in the ML by confocal macroscopy for 2 hr in control conditions and then for 2 hr in the presence of Pituitary adenylate cyclase-activating polypeptide (PACAP). (B) GC was tracked in the ML by confocal macroscopy for 2 hr in control conditions and then for 2 hr in the presence of plasminogen activator inhibitor-1 (PAI-1).
Discussion
This protocol describes the culture of acute P10 rat cerebellar slices in the Transwell system and the fluorescent labeling of GC with a green fluorescent dye to study cell migration during postnatal development through confocal macroscopy. This protocol allows observations of cell migration for a period up to 12 hr and testing of the possible roles of regulating factors in migration including agonists or antagonists of neuropeptides, enzyme inhibitors, cell signaling modulators or toxic substances during the experiment. A small hole in the membrane insert with a pipette tip is necessary to facilitate administration of compounds in the incubation medium. A home-made curved tip pipette can be used to facilitate the delivery of solution.
One issue of cell migration studies on living tissue slices is that the movements of the tissue itself can make cell tracking difficult. Whereas previous approaches have proposed to gently stabilize slices with a nylon mesh or a thin layer of rat tail collagen7,17, a major advantage of this technology is the simple and direct transfer of a 6-well culture plate containing cerebellar slices on membrane inserts from the CO2 incubator under the objective of a confocal macroscope. Integrated temperature and CO2 controllers also provide appropriate and constant environmental parameters essential for cell migration9. Therefore, culture conditions are kept during observations and tissue movements are minimized since slices are well attached to the membrane insert. Stabilization of the tissue is verified by following the position of slice edges or Purkinje cells that should be fixed references during acquisition. In addition, cerebellar slices (between 12 and 18) distributed in the 6 wells of the plate can be quickly observed in detail with a motorized stage and an optical zoom. Due to the large working distance (X2, 39 mm) of the dry objective, epi-observation is free of immersion and administration of compounds in the culture medium is much easier. Therefore, environmental parameters and culture support similarities in CO2 incubator and confocal macroscopy lead to maximum conservation of the biological sample.
Another advantage of the protocol is the large field of view and consequently the large number of cells that can be observed simultaneously. For example, we have previously determined that the density of fluorescent GCs with radial migration in the ML was 1124 ± 138 cell/mm2 18. Confocal macroscopy (X2, NA = 0.234) has a lower lateral resolution compared to confocal microscopy (40X, NA = 1.25) but cell bodies of GCs can be easily tracked and the average speed of migration is comparable between the two technological approaches7,18.
Besides technical improvement for image acquisitions, the quality of tissue slices and the quality of labeling are key points for successful experiments. Always keep media and tissues on ice during dissection processes, eliminate oil on vibratome blades and do not utilize slices of tissue in contact with glue. Sagittal and transverse sections are adapted to radial and tangential migration respectively. Use different lengths of incubation for appropriate detection in the different cortical layers of the cerebellum. Long incubation times (up to 8 hr) are necessary to detect the migration of numerous GCs in the PCL and the IGL. Since GC migration is a physiological process during specific spatio-temporal windows, the positive control is that the cells have to migrate properly. In particular, numerous spindle GC in the ML is one of the main health indicator for sagittal cerebellar slices. For starting experiments, observation of GC movements in the ML is suggested. Indeed, the shape of GC with vertically elongated cell body should be considered as a reference point to start acquisition with successive control (2 hr) and treatment (2 hr) periods that can be easily performed in the ML.
Fluorescent dyes like the Cell Tracker family or fluorescent proteins expressed through genetic constructs can be used as tracers for cell migration studies. Due to the slow kinetics of GC migration (1 stack every 30 min), multicolor experiments can also be performed in sequential mode since 4 lasers beams (405, 488, 532 and 633 nm) are available on the system. Considering centripetal and centrifugal radial migration, tracking of other interneurons can also be realized18. In particular, less numerous cell types can be more easily localized with a large field of view. Finally, this protocol can be used to study cell migration at other stages of cerebellar development but also other brain areas.
Disclosures
The authors have nothing to disclose.
Acknowledgements
This work was supported by the Institute for Research and Innovation in Biomedicine (IRIB), the Cell Imaging Platform of Normandy (PRIMACEN), Inserm, IBiSA, the University of Rouen, the European Regional Development Fund (ERDF – PeReNE, Interreg 4A), the LARC-Neurosciences Network and the Région Haute-Normandie.
Materials
| Name | Company | Catalog Number | Comments |
|---|---|---|---|
| Dulbecco’s modified eagle medium (DMEM) nutrient mixture F-12 | Sigma-Aldrich | D8437 | |
| Hank's balanced salt solution 10x | Sigma-Aldrich | H1641 | |
| PACAP38 | INRS, Canada | Bourgault et al., 200919 | |
| PAI-1 | Calbiochem | 528208 | |
| N-2 supplement | Fisher Scientific / Gibco/ invitrogen | O973 | |
| Cyanoacrylate glue | Loctite | ||
| Cell Tracker Green CMFDA | Invitrogen | C2925 | |
| Polyester Transwell-Clear inserts | Corning | 3452 | |
| Penicillin-Streptomycin | Sigma-Aldrich | P0781 | |
| 6-well cell culture cluster | Corning | 3516 | |
| DMSO | Fisher Scientific | BP231-100 | |
| Tissue culture dish 35 mm diameter | BD Falcon | 353004 | |
| Tissue culture dish 100 mm diameter | Thermo SCIENTIFIC | 130182 | |
| Polypropylen tube (15 ml) | BD Falcon | 352096 | |
| Ethanol 70% | Fisher Chemical | E/0800DF/21 | |
| Biological safety cabinet fume hood | Thermo Scientific | MSC9 Class II A2 | |
| Adjustable-volume pipette (0.5-10 µL) | Eppendorf | 4910 000.018 | |
| Gyro-rocker, SSL3 | Stuart | ||
| CO2 incubator, Hera Cell 150 | Thermo Scientific | ||
| Vibrating blade microtome, VT1000S | Leica Microsystems | ||
| Confocal macroscope, TCS LSI | Leica Microsystems | ||
| Temperature controller | PeCon | ||
| CO2-controller | PeCon | ||
| Stereomicroscope, M205 C | Leica Microsystems | ||
| Operating scissors, curved, blunt/blunt | Medicon | 03.03.17 | |
| Hardened fine iris scissors, straight, sharp/sharp | FST | 149090-11 | |
| Dumont #3 and #5 forceps | FST | 11293-00 and 11252-20 | |
| Vibratome injector blades/single edge | Leica Microsystems | 39053250 | |
| Standard scalpel handle #3 solid | FST | 10003-12 | |
| Surgical blade #15 | Swann-Morton | 205 |
References
- Komuro, Y., Kumada, T., Ohno, N., Foote, K. D., Komuro, H. Migration in the Cerebellum. Cellular Migration and Formation of Neuronal Connections: Comprehensive Developmental Neuroscience. 2, 281-297 (2013).
- Altman, J., Bayer, S. A. Development of the cerebellar system in relation to its evolution, structure, and functions. , CRC Press. Boca Raton, FL. (1997).
- Komuro, H., Rakic, P. Distinct modes of neuronal migration in different domains of developing cerebellar cortex. Journal of Neuroscience. 18 (4), 1478-1490 (1998).
- Komuro, H., Yacubova, E. Recent advances in cerebellar granule cell migration. Cellular and Molecular Life Sciences. 60 (6), 1084-1098 (2003).
- Fahrion, J. K., et al. Rescue of neuronal migration deficits in a mouse model of fetal Minamata disease by increasing neuronal Ca2+ spike frequency. Proceedings of National Academy of Sciences USA. 109 (13), 5057-5062 (2012).
- Raoult, E., et al. Pituitary adenylate cyclase-activating polypeptide (PACAP) stimulates the expression and the release of tissue plasminogen activator (tPA) in neuronal cells: involvement of tPA in the neuroprotective effect of PACAP. Journal of Neurochemistry. 119 (5), 10-1111 (2011).
- Cameron, D. B., et al. Cerebellar cortical-layer-specific control of neuronal migration by pituitary adenylate cyclase-activating polypeptide. Neuroscience. 146 (2), 697-712 (2007).
- Renaud, J., et al. Plexin-A2 and its ligand, Sema6A, control nucleus-centrosome coupling in migrating granule cells. Nature Neuroscience. 4, 440-449 (2008).
- Komuro, H., Rakic, P. Dynamics of granule cell migration: a confocal microscopic study in acute cerebellar slice preparations. Journal of Neuroscience. 15 (2), 1110-1120 (1995).
- Nielsen, H. S., Hannibal, J., Fahrenkrug, J. Expression of pituitary adenylate cyclase activating polypeptide (PACAP) in the postnatal and adult rat cerebellar cortex. Neuroreport. 9 (11), 2639-2642 (1998).
- Hannibal, J. Pituitary adenylate cyclase-activating peptide in the rat central nervous system: an immunohistochemical and in situ hybridization study. Journal of Comparative Neurology. 453 (4), 389-417 (2002).
- Garcia-Rocha, M., Avila, J., Armas-Portela, R. Tissue-type plasminogen activator (tPA) is the main plasminogen activator associated with isolated rat nerve growth cones. Neuroscience Letters. 180 (2), 123-126 (1994).
- Ware, J. H., DiBenedetto, A. J., Pittman, R. N. Localization of tissue plasminogen activator mRNA in the developing rat cerebellum and effects of inhibiting tissue plasminogen activator on granule cell migration. Journal of Neurobiology. 28 (1), 9-22 (1995).
- Friedman, G. C., Seeds, N. W. Tissue plasminogen activator mRNA expression in granule neurons coincides with their migration in the developing cerebellum. Journal of Comparative Neurology. 360 (4), 658-670 (1995).
- Seeds, N. W., Siconolfi, L. B., Haffke, S. P. Neuronal extracellular proteases facilitate cell migration, axonal growth, and pathfinding. Cell and Tissue Research. 290 (2), 367-370 (1997).
- Basham, M. E., Seeds, N. W. Plasminogen expression in the neonatal and adult mouse brain. Journal of Neurochemistry. 77 (1), 318-325 (2001).
- Bourgault, S., et al. Molecular and conformational determinants of pituitary adenylate cyclase-activating polypeptide (PACAP) for activation of the PAC1 receptor. Journal of Medical Chemistry. 52 (10), 3308-3316 (2009).
Reprints and Permissions
