Using high-resolution differential interference contrast (DIC) microscopy, an ex vivo observation of the beating of motile ependymal cilia located within the mouse brain ventricles is demonstrated by live-imaging. The technique allows a recording of the unique ciliary beating frequency and beating angle as well as their intracellular calcium oscillation pacing properties.
Method Article
Live Imaging of the Ependymal Cilia in the Lateral Ventricles of the Mouse Brain
1Department of Pharmacology and Experimental Therapeutics, University of Toledo, College of Pharmacy and Pharmaceutical Sciences, 2Life Sciences Institute, University of Michigan, 3Department of Biomedical & Pharmaceutical Sciences, Chapman University, School of Pharmacy, Rinker Health Science campus
Opens in a new tab
In This Article
Summary
Loading...
$$\rightleftharpoonup{xx}$$
$$\longleftharp{xx}$$,
$$\longrightharp{xx}$$,
Abstract
Loading...
$$\rightleftharpoonup{xx}$$
$$\longleftharp{xx}$$,
$$\longrightharp{xx}$$,
Multiciliated ependymal cells line the ventricles in the adult brain. Abnormal function or structure of ependymal cilia is associated with various neurological deficits. The current ex vivo live imaging of motile ependymal cilia technique allows for a detailed study of ciliary dynamics following several steps. These steps include: mice euthanasia with carbon dioxide according to protocols of The University of Toledo’s Institutional Animal Care and Use Committee (IACUC); craniectomy followed by brain removal and sagittal brain dissection with a vibratome or sharp blade to obtain very thin sections through the brain lateral ventricles, where the ependymal cilia can be visualized. Incubation of the brain’s slices in a customized glass-bottom plate containing Dulbecco’s Modified Eagle’s Medium (DMEM)/High-Glucose at 37 °C in the presence of 95%/5% O2/CO2 mixture is essential to keep the tissue alive during the experiment. A video of the cilia beating is then recorded using a high-resolution differential interference contrast microscope. The video is then analyzed frame by frame to calculate the ciliary beating frequency. This allows distinct classification of the ependymal cells into three categories or types based on their ciliary beating frequency and angle. Furthermore, this technique allows the use of high-speed fluorescence imaging analysis to characterize the unique intracellular calcium oscillation properties of ependymal cells as well as the effect of pharmacological agents on the calcium oscillations and the ciliary beating frequency. In addition, this technique is suitable for immunofluorescence imaging for ciliary structure and ciliary protein localization studies. This is particularly important in disease diagnosis and phenotype studies. The main limitation of the technique is attributed to the decrease in live motile cilia movement as the brain tissue starts to die.
Introduction
Loading...
$$\rightleftharpoonup{xx}$$
$$\longleftharp{xx}$$,
$$\longrightharp{xx}$$,
Cilia are sensory microtubule-based organelles that extend from the cell surface to the extracellular environment. Depending on their microtubule organization, cilia can be categorized into two types - “9+0” or “9+2”. Functionally, based on their motility, these can be classed as motile or non-motile cilia 1. Primary cilia is a term commonly used to denote “9+0” non-motile cilia. These have nine parallel doublet microtubules (denoted by ‘9’) and a central pair of microtubules is absent within the central sheath (denoted by ‘0’). However, some “9+0” cilia, such as nodal cilia, which regulate embryo laterality are motile 2. On the other hand, motile cilia are characterized, in addition to the nine parallel microtubule doublets, by an additional central pair of microtubule doublets and associated with dynein motor proteins to facilitate motility. In addition, some “9+2” cilia such as olfactory cilia are non-motile 3. Ependymal cells lining the brain ventricles and the central canal of the spinal cord are characterized by motile cilia that propel the cerebrospinal fluid (CSF) along the brain ventricles 4.
The overall goal of this method is to facilitate studying the motile cilia dynamics and structural abnormalities. The brain’s health and development heavily depend on efficient circulation of CSF within the brain ventricles. For instance, normal CSF flow and fluid balance require normal beating and functional ependymal cilia 5,6, which in turn play critical roles in regulating the directional movement of neuronal cells and stem cell migration 7. As such, abnormal ependymal cilia function or structure can lead to abnormal CSF flow, which is associated with hydrocephalus, a medical condition in which there is an abnormal accumulation of CSF in the ventricles of the brain. This may consequently cause increased intracranial pressure and progressive enlargement of the head, convulsion, tunnel vision, and mental disability 8.
The advantages of this technique over existing methods is that it allowed for the first time to report three distinct ependymal cell types: I, II, and III, based on their unique ciliary beating frequency and beating angle. These ependymal cells are localized within certain regions in the brain ventricles. Furthermore, the effects of age and pharmacological agents such as alcohol and cilostazol on altering the ependymal cell types or their localizations can be demonstrated, which was not possible before this classification of ependymal cells. Cilostazol is an inhibitor of phosphodiesterase-3, an enzyme that metabolizes cAMP to AMP and it also regulates intracellular calcium 9. Using high-speed fluorescence imaging analysis allows imaging and quantifying of the unique intracellular calcium oscillation properties of the ependymal cells. For instance, both alcohol and cilostazol significantly altered the ependymal ciliary beating frequency as well as the intracellular calcium oscillations properties, which in turn, could lead to a change in the cerebrospinal fluid volume replacement by ependymal cilia 10. In summary, this technique was key to provide the first evidence of three distinct types of ependymal cells with different calcium oscillation properties.
In the following section, a detailed step-by-step overview of the procedure is provided, paying close attention to tissue preparation and handling.
Protocol
Loading...
$$\rightleftharpoonup{xx}$$
$$\longleftharp{xx}$$,
$$\longrightharp{xx}$$,
The procedures for animal use were approved by the Institutional Animal Care and Use Committee (IACUC) of The University of Toledo in accordance with the guidelines of the Institutional Animal Care and Use Committee at the National Institutes of Health and the Guide for the Care and Use of Laboratory Animals.
1. Brain Extraction, Sectioning and Tissue Preparation
- Sacrifice wild-type mouse strain C57BL/6 by deeply euthanizing with CO2 asphyxiation for 5 min. Assure death by cervical dislocation.
- Clean the mouse head with 70% ethanol.
- Perform craniectomy using sterile scissors and forceps by first pulling the skin off, starting with the top of the head to expose the skull.
- Then, when the skull is exposed, remove the skull by peeling the bone piece-by-piece, starting from the posterior side and moving toward the anterior side. Be cautious not to destroy the brain ventricles.
- Collect the whole brain.
- Place the brain in a 100 mm Petri dish containing DMEM/High-Glucose supplemented with 10% fetal bovine serum (FBS) and 1% penicillin/streptomycin solution containing 10,000 units/ml of penicillin and 10,000 µg/ml of streptomycin and pre-warmed to 37 °C.
- Slice the brain on the median sagittal plane by hand with a sharp blade, and obtain the first 100-200 mm section from each half using a vibratome.
- Rinse the brain tissue with pre-warmed 37 °C phosphate buffered saline (1x PBS) solution.
- Immediately place the brain section in DMEM/High-Glucose media pre-warmed to 37 °C.
2. Live Imaging Configuration and Setup
- Place the brain tissue sections in 30 mm glass-bottom culture dishes containing 1 ml of DMEM/High-Glucose media. Adjust the microscope’s enclosed chamber environment to 37 °C, 95%/5% O2/CO2 content (Figure 1).
- Using a 60X objective oil immersion lens, collect the ependymal cells/cilia images by first placing an oil drop on the 60X objective lens and focusing on the cells with regular DIC transmitted light.
- Then, follow the direction of the DMEM bubble movement as a guide to the location of the motile ependymal cilia as ciliary beatings create a kind of bubble movement in the area. Choose an area containing healthy cells with motile cilia in the brain’s lateral ventricle using the DIC filter. Once the ependymal cilia are found, adjust the light and focus to obtain a satisfactory image.
- Set the live imaging parameters according to a specific purpose using Metamorph imaging software. In the present demonstration, acquire twenty four-bit images with the camera binning set to 1 x 1 combined with 60X objective and 5-10 msec exposure time.
- Collect the DIC images by opening the microscope aperture to an optimal level in order to have a minimum exposure time. Observe live images stream to the camera to provide fast and immediate image acquisition without delay. Calculate the speed of cilia beating based on the requirement of the minimal exposure times to obtain sufficient image contrast.
3. Data Visualization and Analysis
- Calculate the number of cilia beatings by counting the number of beatings in 1 min. Do this by decreasing the speed of the video and counting the number of beats using a cell counter or similar tool.
- To calculate the frequency of beatings, multiply the exposure time at which the video is recorded by the number of the frames or time-lapse images acquired to get the number of sec. (Example: exposure time 5 msec 200 frames = 1,000 msec or 1 sec).
- Calculate the number of beatings in one second to obtain the frequency which is expressed as the number of beating per one sec. Do this by dividing the number of cilia beatings over a one-second time interval (Example: cilia beats 50 times in a 200 frames video recorded at exposure time of 5 msec i.e. 5 msec x 200 frames = 1 sec; now divide 50 beats by 1 sec = 50 Hz).
- Calculate the ciliary beating angle by evaluating the path taken by the ependymal cilia during both the power and recovery strokes. Perform this according to a previously described method, with minor modifications 11. The precise movement of individual cilia is observed during the complete beat cycle.
- On an acetate sheet placed over the monitor, draw a horizontal line along the ependymal edge and a vertical line through the midline position of the cilia at the start of the power stroke.
- Plot the precise position of the cilium frame by frame as it moves forward during the power stroke. In a similar manner, plot the movement of the cilia during the recovery stroke.
- Calculate the ciliary beating angle from the maximum deviation of the cilium from the midline during the power stroke as well as the recovery stroke.
4. Calcium Signal Recording
- After slicing the brain, briefly rinse the brain slice with 1x PBS or Dulbecco’s PBS (pH 7.0). Prepare fresh Fluo-2 to avoid fluorescence quenching and to obtain good signal-to-noise ratio.
- Prepare 1 mM stock solution of Fluo-2 solution in dimethylsulfoxide (DMSO), mix and vortex the solution for at least 5 min to ensure that Fluo-2 is homogenously dissolved in DMSO.
- Dilute the Fluo-2 stock solution in 500 ml of DMEM/High-Glucose supplemented with 2% B27 pre-warmed to 37 °C to a final concentration of 20 mg/ml.
NOTE: B-27 is an optimized serum-free supplement containing vitamin A, antioxidant cocktail and insulin used to support short- or long-term viability of hippocampal and other CNS neurons. - Immediately incubate the brain slice with 20 mg/ml Fluo-2 for 30 min at 37 °C in a glass-bottom plate.
- To determine the optimal loading concentration of calcium fluorophore Fluo-2 and to avoid calcium dye cell toxicity, challenge cells with ATP, and check the cell viability by determining the time course and peak magnitude of calcium signals in response to ATP.
- Record the video for calcium oscillation at a capture rate of 5 msec for a minimum of 1 sec (200 frames per sec), with excitation and emission wavelengths of 488 nm and 515 nm, respectively (Movie 2).
- To distinguish the Fluo-2 calcium signal from autofluorescence or movement artifacts, ensure that the intensities emitted at 515 nm is monitored separately.
NOTE: Fluo-2 is not the calcium fluoremetric suitable to quantify intracellular calcium. However, it is an excellent dynamic calcium dye to detect fast calcium changes, such as calcium oscillations. For more accurate calcium quantification, Fura-2 is recommended. However, the dynamic changes of Fura-2 are limited by its ratiometric nature of the dye. - Follow the formulas provided by the manufacturer to calculate the exact free intracellular calcium values. Example [Ca2+] = Kd × (R–Rmin)/(Rmax – R). Where Kd is the dissociation constant of the dye from the released calcium, R is the measured fluorescence at 488, and Rmin and Rmax are the fluorescence ratios at minimum and maximum ion concentration 12.
5. Immunofluorescence Microscopy
- Fix the brain sections with phosphate buffered saline solution containing 4% paraformaldehyde (PFA) and 2% sucrose for 10 min. Alternatively, fix the whole brain with 4% PFA and then section into 50 mm sections using a cryostat.
- Wash the tissue three times with 1x PBS for 5 min each time.
- Incubate the brain slice with a solution of 0.1% Triton-X in 1x PBS for 5 min, then rinse three times with 1x PBS for 5 min each time.
- Incubate the brain slice with mouse primary antibody, antiacetylated a-tubulin, used at a dilution of 1:5,000 in 10% FBS in 1x PBS for one hour at room temperature (RT) or overnight at 4 °C.
- Wash the tissue three times with 1x PBS for 5 min each time.
- Incubate the brain slice in secondary antibody, fluorescein anti-mouse IgG at a dilution of 1:500 in 10% FBS in 1x PBS solution for 1 hr at RT.
- Before observation under a fluorescent microscope, counterstain the section with 4',6-diamidino-2-phenylindole (DAPI) for 5 min to stain the nucleus (or DNA) 13. To minimize photobleaching, image the sections immediately with minimum exposure time possible.
Results
Loading...
$$\rightleftharpoonup{xx}$$
$$\longleftharp{xx}$$,
$$\longrightharp{xx}$$,
Measuring ependymal cilia function in live mouse brain
The method described in this protocol is used to monitor ependymal cilia function and structure in the fresh tissue dissected from the mouse brain as well as to monitor and study cilia beating frequency. The steps followed to accomplish a complete experiment are depicted in a schematic flowchart (Figure 1). It is highly recommended that the experiment is conducted within a short time frame in order to keep the motile cilia as active as possible. A representative time-lapse movie and images of the ependymal cells and their motile cilia are also shown (Movie 1 and Figure 2a). Data analysis in the obtained stream is accomplished by counting the beating and angle pattern of the moving cilia. The criteria for dividing the cilia into three types are presented in Table 1. The presence of ependymal cilia is confirmed with a ciliary marker, acetylated-a-tubulin, and the ependymal cells are counterstained with DAPI (DNA marker) to show the nucleus (Figure 2b). Based on our observations of ependymal cells in the brain lateral ventricle from at least 22 independent experiments, we were able to classify ependymal cells into three types based on their ciliary beating frequency. Moreover, we demonstrated that Ethanol at 0.25% concentration significantly repressed cilia beating frequency irrespective of their type (Figure 3). More importantly, these data are in consistence with our previous findings 10.
Measuring calcium signaling by ependymal cilia
It has been previously shown that bending of cilia can trigger a cilium-dependent intracellular calcium signaling 14-16. This technique allows researchers to examine and measure the intracellular calcium signal within the brain ventricles (Movie 2).One can apply a similar methodology to record cytosolic calcium oscillations in response to ependymal cilia activation or in response to treatment with pharmacological agents. To examine cytosolic calcium, the tissue is incubated for 30 min at 37 °C with the calcium indicator, Fluo-2. Live images of cytosolic calcium oscillation/level are streamed at the excitation and emission wavelengths of 488 and 515 nm, respectively.
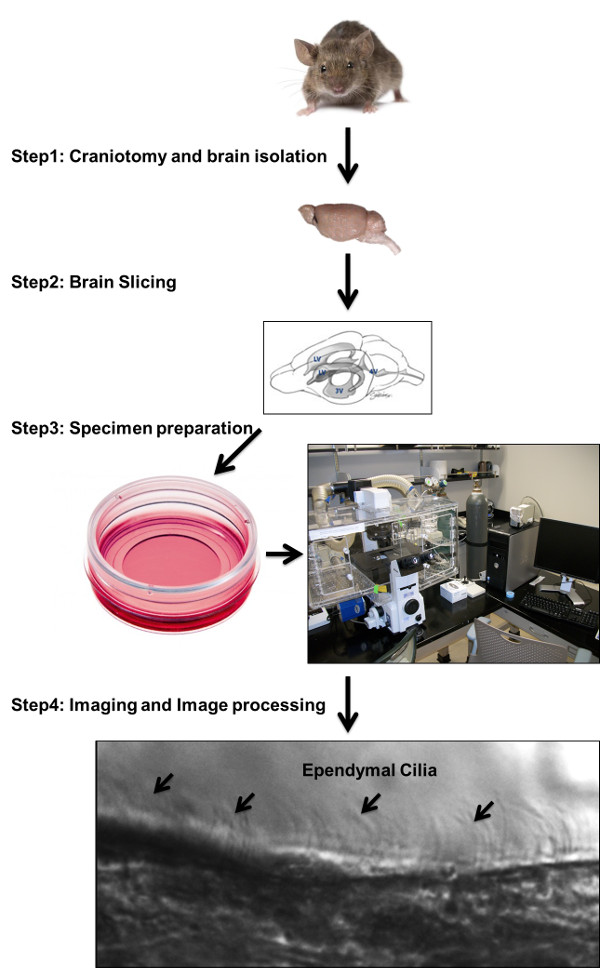
Figure 1: Ependymal cilia imaging protocol flowchart. Ependymal cilia imaging protocol illustrates steps to complete an experiment starting from mouse brainextraction, sectioning and tissue preparation to image acquisition and analysis. An approximate one hour timeline is presented with step-by-step procedure.

Figure 2: Ependymal cilia localization in the brain ventricles. Shown here are ependymal cells from the lateral ventricle of a mouse brain. (a) DIC images of individual ependymal cells (bottom arrows) and cilia (top arrows) are shown. (b) An overlay image of a brain section is stained with antibody against a ciliary marker, acetylated a-tubulin, shown in green (top arrows), and counterstained with a nuclear/DNA marker, DAPI, shown in blue (bottom arrows). Please note that panels a and b represent different brain sections.
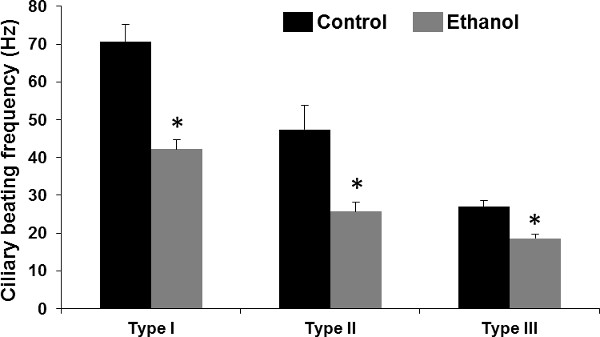
Figure 3: Alcohol and differences in cilia beating frequencies among types of ependymal cells of the mouse brain lateral ventricle. The ex vivo brain slice was incubated without (Control) or with (Ethanol) 0.25 % alcohol for 5 min. Compared to control, alcohol treatment significantly decreased cilia beating frequency, as indicated by an asterisk. At least 5-10 independent preparations were used for each ependymal cell type and treatment group.
Movie 1: Recording of ependymal cilia in type III ependymal cells. Shown here are recordings of ependymal cilia, characterized by beating frequency and angle unique to type III ependymal cells from the brain’s third ventricle. This figure has been previously reported 10 and was reused with permission.
Movie 2: Intracellular calcium oscillation in ependymal cells. Shown here are recordings of calcium oscillations of ependymal cells through a section of the brain’s lateral ventricle after incubating the brain slice with 20 mg/ml calcium indicator, Fluo-2, for 30 min at 37 °C. The brain section’s calcium level was studied and pseudo-colored. The color bar indicates the ependymal cells’ calcium level; where black-purple and red-yellow represent low and high calcium levels, respectively. For intracellular calcium quantification, ependymal cell calcium will be calculated from several individual ependymal cells, as mentioned in the protocol text and averaged between control and treatment groups. The video of calcium oscillation was recorded at 200 frames per sec with excitation and emission wavelengths of 488 nm and 515 nm, respectively. This figure has been previously reported 10 and was reused with permission.
| Ependymal cell type | Cilia beating frequency | Cilia beating angle |
| Type I | >60 Hz | < 90° |
| Type II | 30–60 Hz | 90-135° |
| Type III | <30 Hz | >135° |
Table 1: Types of ependymal cilia. The classification of ependymal cilia into type I, II or III was based primarily on the beating frequency and beating angle of ependymal cilia located within distinct regions of the brain’s third ventricle. Parts of this data have been previously reported and were reused here with permission.
Discussion
Loading...
$$\rightleftharpoonup{xx}$$
$$\longleftharp{xx}$$,
$$\longrightharp{xx}$$,
Described here is a protocol for the preparation of mouse brain tissue for both live-imaging and fluorescence microscopy that provides a rapid and sensitive close observation of the ependymal cilia within the brain ventricles. This technique is not restricted to the lateral ventricle only; it could be utilized to observe the cilia in other brain ventricles. This imaging technique provides a live stream that resembles the movement of the CSF by ciliary beating in an ex vivo setting. Moreover, it enables analysis of the directional movement of the cilia. This is mainly facilitated by the use of a high resolution DIC and fluorescence imaging system. An advantage of this system is that the microscope is enclosed in an environmental chamber, which allows for a fine regulation of temperature, humidity and CO2 levels. These are very critical parameters that should be considered for the survival of cells and tissues when performing live imaging experiments. The system is also equipped with automatic XY and Z modules as well as a digital camera and wavelength filter switcher, all of which are important features to facilitate imaging of dynamic cellular behaviors such as cilia movements. The microscope is connected to a computer and the acquisition of high quality images is facilitated by imaging software.
Using this technique to classify ependymal cells into distinct types offers a significant advancement over existing/previous methods used to study ependymal cilia. For example, the effect of certain pharmacological or toxic agents such as alcohol could be otherwise minimized or nullified if ependymal cells are considered as one population 17. It is important to keep in mind that, despite the fact that the characteristics of cilia beating frequencies and angles are very different among these three types of ependymal cilia, we have just started to understand the physiology of these cells. Hence, according to our previous work, our classification is robust enough if the procedure is carried properly as described in this protocol.
Identifying distinct ependymal cilia is fundamentally important to gain a basic understanding of ependymal physiology. This method makes it possible to distinguish between three distinct types of ependymal cells uniquely and specifically positioned within the third ventricle in regards to the beating frequency and angle, leading to the classification into three different types (Table 1). In order to confirm that the differences in cilia beating frequencies are not due to differences in viability of the ependymal cells or to differences in the animal age, it is recommended that only intact and undetached ependymal strips or slices that are attached to neuronal tissue and at least 100 mm thick are used. Moreover, ciliary beating frequency should be measured at different locations along each ependymal section. We have previously demonstrated that ciliary beat frequency data generated using this technique has been consistently reproducible among 87 experimental observations 10. Hence, ependymal cells are accurately classified depending on their ciliary beating. Moreover, when using pharmacological agents which are known to decrease the ciliary beating frequency, the cilia beating frequency should theoretically return to normal beating frequency following the removal of those pharmacological agents.
A critical step in this protocol is mainly related to handling the brain tissue and the time needed to complete the experiment. It is imperative to handle the brain tissue gently in order to preserve the structure and function of ependymal cilia as well as to reduce trauma to the fragile tissue. More important, and to avoid deterioration and death of the brain tissue, which could be a limiting factor for the success of this technique, it is highly recommended that the steps related to this technique are performed in as close to one hour as possible. However, this limitation could be overcome in the future with the advances in culturing and growing ependymal or similar cell types with motile cilia in vitro or with the use of alternative nutritive media. The use of alternative nutritive media such as aCSF and Earle’s salts for the incubation of the brain slices has been demonstrated in the literature 5. However, in our hands, the use of DMEM/High-Glucose was more beneficial than aCSF possibly due to the presence of high amount of glucose (4,500 mg/ml) in the medium as a potential energy source. Thus, the main criterion used to assess the viability of the tissue and hence the validity of the approach is assessing cilia beating, as this is a representative sign of live cells.
Live imaging of ependymal cilia offers a powerful tool to analyze downstream signaling pathways of cilia activation such as calcium signaling and oscillations. For example, using live fluorescence imaging, it has been demonstrated that irrespective of the ependymal cell/cilia type, ependymal cells are characterized by unique calcium oscillation properties 10. All in all, this protocol is relevant to both basic scientific knowledge and clinical practice. From the basic science perspective, this technique offers an assessment of the functional and physiological roles of ependymal cilia structure, function and downstream mechanistic signaling pathways. From the clinical practice perspective, this method is highly relevant to the search for drugs that target ependymal cilia as a new therapeutic target for neurological disorders such as hydrocephalus and alcohol abuse.
Disclosures
Loading...
$$\rightleftharpoonup{xx}$$
$$\longleftharp{xx}$$,
$$\longrightharp{xx}$$,
No conflicts of interest declared.
Acknowledgements
Loading...
$$\rightleftharpoonup{xx}$$
$$\longleftharp{xx}$$,
$$\longrightharp{xx}$$,
Authors would like to thank Charisse Montgomery for her editing service. A. Alomran’s work partially fulfills the requirements for a master’s degree in Pharmacology.This work is funded by The University of Toledo’s intramural startup fund for W.A.A and NIH grant (DK080640) for S.M.N.
Materials
| Name | Company | Catalog Number | Comments |
|---|---|---|---|
| DMEM/HIGH GLUCOSE | Cellgro Mediatech Inc. | 10-013-CV | |
| Fetal bovine serum (FBS) | Hyclone | SH30088-03 | |
| Penicillin/Streptomycin | Thermo Scientific | SV30010 | |
| Phosphate buffered saline | Thermo Scientific | SH30256-01 | |
| Paraformaldehyde | Electron Microscopy Sciences | 15710-SP | |
| Sucrose | Sigma-Aldrich | S-2395 | |
| Triton-X | Sigma-Aldrich | T9284 | |
| Fluo-2 | TEF Labs | #0200 | |
| DMSO | |||
| B27 | Gibco | 17504044 | |
| VECTASHIELD HardSet Mounting Medium with DAPI | Vector Labs | H-1500 | |
| Anti-acetylated a-tubulin antibody | Sigma-Aldrich | T7451 | clone 6-11B1 |
| FITC Anti-mouse antibody | Vector Labs | FI-2000 | |
| Cell Culture plate | VWR Vista Vision | 30-2041 | |
| Cover Slip (18 x 18) | VWR Vista Vision | 16004.326 | |
| Vibratome | Leica Biosystems | Leica VT1200S | |
| Cryostat | Leica Biosystems | Leica CM1860 | |
| Inverted Fluorescence Microscope | Nikon | Nikon TE2000 | 60X oil |
| Microscope cover glass 24 x 60 mm2 | VWR Vista Vision | 16004-312 | |
| Mounting Medium with DAPI | Vector Laboratories | H-1500 | |
| DAPI filter cube | Chroma Technology |
References
Loading...
$$\rightleftharpoonup{xx}$$
$$\longleftharp{xx}$$,
$$\longrightharp{xx}$$,
- Primary cilia: Highly sophisticated biological sensors. Sensors. 9 (9), 7003-7020 (2009).">AbouAlaiwi, W. A., Lo, S. T., Nauli, S. M. Primary cilia: Highly sophisticated biological sensors. Sensors. 9 (9), 7003-7020 (2009).
- Randomization of left-right asymmetry due to loss of nodal cilia generating leftward flow of extraembryonic fluid in mice lacking kif3b motor protein. Cell. 95 (6), 829-837 (1998).">Nonaka, S., et al. Randomization of left-right asymmetry due to loss of nodal cilia generating leftward flow of extraembryonic fluid in mice lacking kif3b motor protein. Cell. 95 (6), 829-837 (1998).
- Overview of structure and function of mammalian cilia. Annual review of physiology. 69, 377-400 (2007).">Satir, P., Christensen, S. T. Overview of structure and function of mammalian cilia. Annual review of physiology. 69, 377-400 (2007).
- The ependyma - a protective barrier between brain and cerebrospinal-fluid. Glia. 14 (1), 1-13 (1995).">Delbigio, M. R. The ependyma - a protective barrier between brain and cerebrospinal-fluid. Glia. 14 (1), 1-13 (1995).
- Bordey A. Ependymal cells along the lateral ventricle express functional p2x(7) receptors. Purinergic signalling. 5 (3), 299-307 (2009).">Genzen, J. R., Platel, J. C., Rubio, M. E. Bordey A. Ependymal cells along the lateral ventricle express functional p2x(7) receptors. Purinergic signalling. 5 (3), 299-307 (2009).
- Disruption of the mouse jhy gene causes abnormal ciliary microtubule patterning and juvenile hydrocephalus. Developmental biology. 382 (1), 172-185 (2013).">Appelbe, O. K., et al. Disruption of the mouse jhy gene causes abnormal ciliary microtubule patterning and juvenile hydrocephalus. Developmental biology. 382 (1), 172-185 (2013).
- New neurons follow the flow of cerebrospinal fluid in the adult brain (New York, N.Y.). Science. 311 (5761), 629-632 (2006).">Sawamoto, K., et al. New neurons follow the flow of cerebrospinal fluid in the adult brain (New York, N.Y.). Science. 311 (5761), 629-632 (2006).
- Dysfunctional cilia lead to altered ependyma and choroid plexus function, and result in the formation of hydrocephalus. Development. 132 (23), 5329-5339 (2005).">Banizs, B., et al. Dysfunctional cilia lead to altered ependyma and choroid plexus function, and result in the formation of hydrocephalus. Development. 132 (23), 5329-5339 (2005).
- Cilostazol prevents endothelin-induced smooth muscle constriction and proliferation. PloS one. 7 (9), e44476(2012).">Kawanabe, Y., et al. Cilostazol prevents endothelin-induced smooth muscle constriction and proliferation. PloS one. 7 (9), e44476(2012).
- Three types of ependymal cells with intracellular calcium oscillation are characterized by distinct cilia beating properties. J Neurosci Res. 92 (9), 1199-1204 (2014).">Liu, T., Jin, X., Prasad, R. M., Sari, Y., Nauli, S. M. Three types of ependymal cells with intracellular calcium oscillation are characterized by distinct cilia beating properties. J Neurosci Res. 92 (9), 1199-1204 (2014).
- Analysis of ciliary beat pattern and beat frequency using digital high speed imaging: Comparison with the photomultiplier and photodiode methods. Thorax. 55 (4), 314-317 (2000).">Chilvers, M. A., O'Callaghan, C. Analysis of ciliary beat pattern and beat frequency using digital high speed imaging: Comparison with the photomultiplier and photodiode methods. Thorax. 55 (4), 314-317 (2000).
- Non-motile primary cilia as fluid shear stress mechanosensors. Methods in enzymology. 525, 1-20 (2013).">Nauli, S. M., Jin, X., AbouAlaiwi, W. A., El-Jouni, W., Su, X., Zhou, J. Non-motile primary cilia as fluid shear stress mechanosensors. Methods in enzymology. 525, 1-20 (2013).
- Survivin-induced abnormal ploidy contributes to cystic kidney and aneurysm formation. Circulation. 129 (6), 660-672 (2014).">AbouAlaiwi, W. A., et al. Survivin-induced abnormal ploidy contributes to cystic kidney and aneurysm formation. Circulation. 129 (6), 660-672 (2014).
- Ciliary polycystin-2 is a mechanosensitive calcium channel involved in nitric oxide signaling cascades. Circulation research. 104 (7), 860-869 (2009).">AbouAlaiwi, W. A., et al. Ciliary polycystin-2 is a mechanosensitive calcium channel involved in nitric oxide signaling cascades. Circulation research. 104 (7), 860-869 (2009).
- Cilioplasm is a cellular compartment for calcium signaling in response to mechanical and chemical stimuli. Cell Mol Life Sci. 71 (11), 2165-2178 (2014).">Jin, X., et al. Cilioplasm is a cellular compartment for calcium signaling in response to mechanical and chemical stimuli. Cell Mol Life Sci. 71 (11), 2165-2178 (2014).
- Bending the mdck cell primary cilium increases intracellular calcium. The Journal of membrane biology. 184 (1), 71-79 (2001).">Praetorius, H. A., Spring, K. R. Bending the mdck cell primary cilium increases intracellular calcium. The Journal of membrane biology. 184 (1), 71-79 (2001).
- The effect of ethanol and acetaldehyde on brain ependymal and respiratory ciliary beat frequency. Cilia. 2 (1), 5(2013).">Smith, C. M., Radhakrishnan, P., Sikand, K., O'Callaghan, C. The effect of ethanol and acetaldehyde on brain ependymal and respiratory ciliary beat frequency. Cilia. 2 (1), 5(2013).
Reprints and Permissions
Request permission to reuse the text or figures of this JoVE article
Request Permission