Microglia can influence neurons and other glia in culture by various non-cell autonomous mechanisms. Here, we present a protocol to selectively deplete microglia from primary neuronal cultures. This method has the potential to elucidate the role of microglial-neuronal interactions, with implications for neurodegenerative conditions where neuroinflammation is a hallmark feature.
Method Article
Selective Depletion of Microglia from Cerebellar Granule Cell Cultures Using L-leucine Methyl Ester
* These authors contributed equally
In This Article
Summary
Abstract
Microglia, the resident immunocompetent cells of the CNS, play multifaceted roles in modulating and controlling neuronal function, as well as mediating innate immunity. Primary rodent cell culture models have greatly advanced our understanding of neuronal-glial interactions, but only recently have methods to specifically eliminate microglia from mixed cultures been utilized. One such technique – described here – is the use of L-leucine methyl ester, a lysomotropic agent that is internalized by macrophages and microglia, wherein it causes lysosomal disruption and subsequent apoptosis13,14. Experiments using L-leucine methyl ester have the power to identify the contribution of microglia to the surrounding cellular environment under diverse culture conditions. Using a protocol optimized in our laboratory, we describe how to eliminate microglia from P5 rodent cerebellar granule cell culture. This approach allows one to assess the relative impact of microglia on experimental data, as well as determine whether microglia are playing a neuroprotective or neurotoxic role in culture models of neurological conditions, such as stroke, Alzheimer’s or Parkinson’s disease.
Introduction
The human brain comprises an estimated 85 billion neurons and a further 85 billion non-neuronal cells including glia1. For the greater part of the past 100 years neuroscientists have focused predominantly on the neuronal cell population, believing glial cells to be little more than passive support cells that provided structural support for the neurons – hence the Greek etymology of ‘glia’ translated to English as ‘glue’. Recently, however, it has become increasingly evident that neuronal-glial interactions may be far more fundamental to basic aspects of neurobiology, neurophysiology, and the genesis and progression of many neurodegenerative diseases. Cerebellar granule cells (CGCs), the most abundant homogenous neuronal population in the human brain, dominate the cerebellum and make up more than 90% of its cellular constituents. Consequently, these cells have been used extensively in vitro as a model system for the study of neuronal development, function, and pathology2-6.
However, CGC cultures still contain microglia and other glia in arguably significant proportions. As a result, CGC data putatively displaying direct neuronal responses to different cell treatments may in fact arise – in part or in total – from the indirect secondary response of neighbouring glia in the culture. To assess this, we selectively eliminated microglial from CGC neuronal cultures with the aid of L-leucine methyl ester (LME). LME is a lysomotropic agent originally used to selectively destroy macrophages7, and has since been used to also selectively deplete microglia from neural, astrocyte, and mixed glial cultures8,9,10. LME is internalized by macrophages and microglia, wherein it causes lysosomal disruption and subsequent apoptosis13,14. Macrophages and microglia are characteristically rich in lysosomes, causing them to be particularly vulnerable upon exposure to LME treatment. This protocol provides a powerful, yet simple and easy way to ascertain the contribution of microglia in experiments utilizing CGC and other neuronal/glial culture systems.
Protocol
All experiments described herein were performed in accordance with the United Kingdom Animals (Scientific Procedures) Act of 1986.
1. Preparation of Instruments, Culture Media, and Dishes
- Prepare two stainless steel laboratory dissecting scissors and two stainless steel laboratory forceps. Autoclave all instruments and place in a culture hood O/N under ultraviolet light (UV) light for sterilization.
- Make 500 ml of minimum essential media (MEM) culture medium (10% Foetal Bovine Serum [FBS], 20 mM KCl, 25 mM NaHCO3, 30 mM D-glucose, 2 mM L-glutamine, 100 U/ml penicillin, 100 µg/ml streptomycin and 6 µg/ml ampicillin) and filter sterilize. Store at 4 °C for months.
- Prepare 24 well culture plates containing 14 mm, number 1 thickness coverslips. Autoclave the coverslips and coat in 100 mg/L poly-d-lysine (PDL) as previously described 3. UV light sterilize O/N.
2. Preparation of CGC Culture Solutions
- Prepare ‘solution A’ (100 ml) in autoclaved, UV light treated, sterile dH2O containing 250 mg of glucose, 300 mg of Bovine Serum Albumin [BSA], 955 mg of Phosphate Buffered Saline [PBS] (Ca2+ and Mg+ free), and 1 ml of 3.8% MgSO4·7H2O.
- Prepare ‘solution B’ (10 ml) containing 1 ml of 5 mg/ml trypsin diluted in 9 ml of solution A.
- Prepare ‘solution C’ (10 ml) containing 1,000 units DNase, 0.5 mg of soybean trypsin inhibitor, 100 µl of 3.8% MgSO4·7H2O, diluted to 10 ml with solution A.
- Prepare ‘solution D’ (20 ml) containing 3.2 ml of solution C, diluted to 20 ml with solution A.
- Prepare BSA/Earle’s Balanced Salt Solution (EBSS) solution containing EBSS, 25 mM NaHCO3, 3 mM MgSO4·7H2O, and 4% BSA, pH 7.4, as previously described3.
- Prepare LME by adding pure LME into 5 ml of MEM culture medium to give a final concentration of 150 mM LME, return the solution to pH 7.4 using a benchtop pH meter, and filter sterilize using a 28 mm polyether sulfone (PES) 0.2 µm syringe filter.
3. Culturing the CGCs
- Collect cerebella from 4-7 day old rat pups as previously described3. Place immediately in Petri dish containing 5 ml solution A on ice.
- Pour off excess solution from cerebella and place tissue in the Petri dish lid.
- Chop tissue finely with a well-flamed razor blade in at least three different directions.
- Add chopped tissue to solution B (rinse Petri dish with solution to ensure limited tissue is lost) and place in water bath at 37 °C for 5 min. Shake gently every couple of min.
- Add solution D (20 ml) to the tube to neutralize the trypsin, shake and centrifuge at 65 x g for 5 min.
- Pour off supernatant.
- Resuspend in 4 ml of solution C. Triturate well (approximately 10 times each) with three flamed glass pipettes of decreasing diameter, until the suspension is as homogenous as possible.
- Slowly and gently add a few drops of this homogenate on top of the BSA/EBSS. If it starts to sink through the BSA/EBSS, triturate more and/or add a little more solution C. The homogenate should sit in a layer on top of the BSA/EBSS. Do not shake. Spin at 100 x g for 5 min.
- Remove supernatant and resuspend pellet (soft) in 1 ml of MEM medium.
- Count cells using a haemocytometer and plate at 800,000 cells/coverslip in 500 µl of MEM medium. Place in an incubator at 37 °C with 6% CO2.
- Change the medium the following day (24-36 hr after the prep). Make a solution of MEM medium containing 10 µM of the cell cycle inhibitor arabinofuranosyl cytidine (AraC).
- For each coverslip, retain 250 µl of the old medium in a fresh 24 well plate, aspirate the rest, add 250 µl of normal MEM medium and aspirate this to wash the cells, then add the 250 µl of old medium back to the cells and top up with 250 µl of AraC-containing medium.
Note: Cells can be used from 6 days in vitro (DIV).
- For each coverslip, retain 250 µl of the old medium in a fresh 24 well plate, aspirate the rest, add 250 µl of normal MEM medium and aspirate this to wash the cells, then add the 250 µl of old medium back to the cells and top up with 250 µl of AraC-containing medium.
4. Selectively Depleting the Microglia (Performed at 6 DIV)
- Add pure LME to 5 ml of a separate aliquot of MEM medium to give a final concentration of 150 mM LME.
- Return the solution to pH 7.4 and filter sterilize using a 28 mm polyether sulfone (PES) 0.2 µm syringe filter.
- Dilute solution to a concentration of 50 mM (2 x LME) in MEM medium and place in a water bath at 37 oC for 10 min along with normal MEM medium for control cultures.
- Remove half (250 µl) the MEM medium from CGC cultures and retain at 37 °C.
- Treat cells with MEM medium containing 2 x LME (250 µl), i.e. diluted 1:1 giving a well concentration of 25 mM, or with pre-warmed MEM medium without LME (250 µl) for control cultures.
- Incubate cells at 37 °C in a humidified atmosphere with 6% CO2 for 1 hr.
- Wash cells twice in fresh pre-warmed MEM medium to remove LME-containing media, and then replace the retained culture medium and an equal volume of fresh pre-warmed MEM medium to the corresponding wells.
- Return cultures to the incubator (humidified with 6% CO2 at 37 °C) and leave to rest for 24 hr before any further treatment.
Results
The ability of this technique to selectively eliminate microglia from CGC and/or mixed cultures relies upon the subsequent ability of the investigator to accurately identify and differentiate microglia from their surrounding cells. This can be achieved using a microglial-specific cell maker, such as isolectin-B4, as illustrated in Figure 1. As demonstrated in Figure 2, no observable changes to astrocyte and neuronal density and morphology were recorded with respect to each main treatment group. Importantly, no significant change in neuronal or astrocytic morphology were observed when cultures were treated with LME alone, supporting a microglial-specific action of the compound. Figure 3A shows no observable changes in astrocyte density and morphology from primary rodent astrocyte culture12, but does display a loss of contaminating microglia. In Figure 3B, as in A, no changes in astrocyte density and morphology were seen; however, a loss in contaminating microglial number and reactivity was observed. For a brief description of the immunocytochemistry (ICC) protocol used in this manuscript, please see reference11.

Figure 1: Characterization of LME treatment of CGCs. (A) Representative images from immunocytochemistry (ICC) experiments performed on CGC cultures after treatment with 25-75 mM LME for 1 hr, followed by wash-off. ICC was performed with DAPI (blue) for quantification of total cell number and those displaying apoptotic morphology, and isolectin-B4 (IB4) (green) for microglial identification and quantification. Scale bar = 30 µm. (B) Quantification of cells displaying apoptotic morphology, defined as nuclear chromatin condensation (grey bars; % of total cell number in the field) and total microglial number, as a percentage of control levels (green bars). Unpaired Student’s t-tests were performed between the relevant controls and a specific treatment of LME; * p <0.05, ** p <0.01, *** p <0.001; n = 3. (i.e. 3 independent repeats).
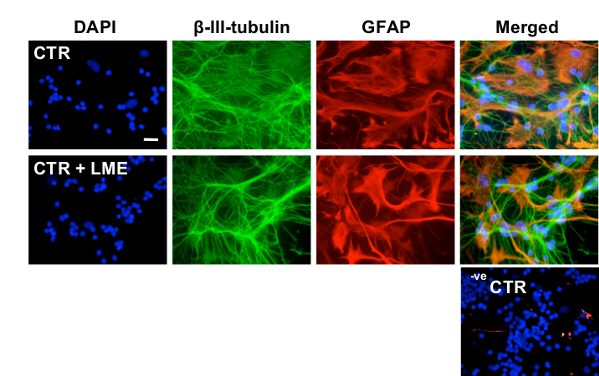
Figure 2: Characterization of the effects of 25 mM LME treatment on neurons and astrocytes in CGC cultures. Panel of representative images from ICC experiments performed on CGC cultures after treatment with 25 mM LME for 1 hr. ICC was performed with DAPI (blue), anti-β-III-tubulin (green) for identification of changes in neuronal density and anti-GFAP (red) for identification of changes in astrocytic density and morphology. Negative control (-ve CTR) images represent CGC cultures wherein the primary antibodies were omitted. Scale bar = 30 µm.
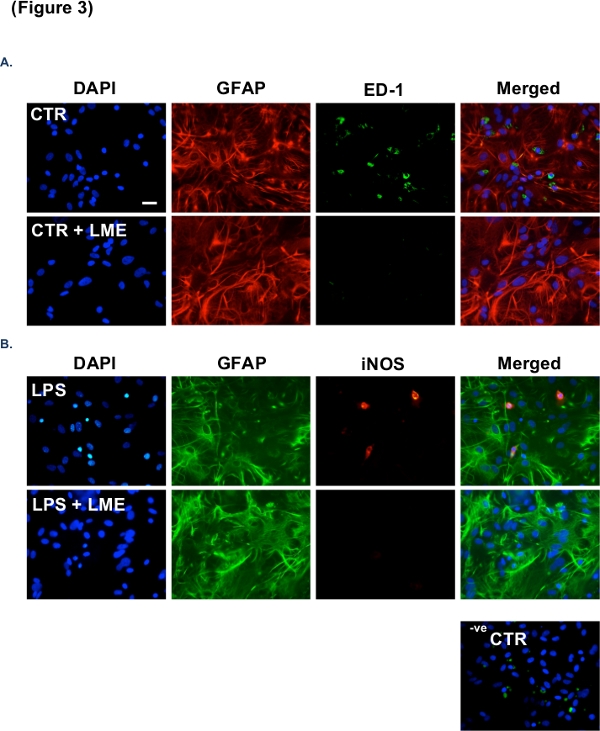
Figure 3: Further characterization of the effectiveness of 25 mM LME treatment in the removal of microglia from astrocytic cultures. (A) Panel of representative images from ICC experiments performed on primary astrocyte cultures after pre-treatment with 25 mM LME for 1 hr. ICC was performed with DAPI (blue), anti-GFAP (red) for identification of changes in astrocytic density and morphology, and anti-ED1 (green) for identification of microglial number. (B) Representative images from ICC experiments performed on primary astrocyte cultures after treatment with LPS (1 µg/ml) for 24 hr following pre-treatment with 25 mM LME for 1 hr. ICC was performed as described in A but with anti-GFAP (green) and anti-iNOS (red) to identify activated microglia. Negative control (-ve CTR) images represent CGC cultures wherein the primary antibodies were omitted. Scale bar = 30 µm.
Discussion
The most important steps to ensure the successful selective elimination of microglia from CGC and/or mixed cultures are: 1) maintaining a sterile and healthy CGC culture; 2) filter sterilizing the LME-containing medium and returning the solution to pH 7.4; 3) keeping the retained CGC media and LME-containing media at 37 °C to avoid heat shock; and 4) working quickly to reduce the time cells are kept outside the incubator.
We used 25 mM LME to deplete microglia from our CGC cultures – a concentration previously optimized in our laboratory. Nonetheless, some microglia still remain in culture following LME treatment, which some believe might reflect a population of differentiated, non-proliferating microglia. Indeed, Hamby et al. (2006) have found that 50-75 mM LME was required to eliminate microglia from high-density astrocyte monolayers13. We have also shown previously that in pure microglial cultures, 10 mM LME was sufficient to kill all the microglia, but only with a 24 hr incubation time14.
Alternative methods to rid cell culture models of contaminating microglia have recently come to light. Crocker et al. (2008) demonstrated a novel approach to eliminate microglia from astrocyte cultures by promoting neural stem cell (NSC) differentiation into astrocytes in postnatal (P0-P2) mice15. They found that this technique completely eliminated microglia from the cultures, although the mechanisms underlying the phenomena are unknown. In addition, Kumamaru et al. (2012) used liposomal clodronate – a biophosphonate known to induce apoptosis in macrophages – to eliminate microglia in primary astrocyte cultures from P3 mice16. This compound works in a similar fashion and at the same level of efficacy as LME; though the authors argue that as LME can be toxic to astrocytes under certain conditions due to its free diffusion into cells – disrupting astrocyte adhesion capacity13 – liposomal clodronate represents an improved method to deplete microglia from culture. We, however, found that 25 mM LME has no affect on astrocyte viability or proliferation.
The protocol described herein uses a specific concentration of LME to selectively eliminate microglia from neuron-enriched cultures of CGCs. This represents a powerful experimental approach to determine the influence of microglia on neurons under various conditions, and continues to provide important data to researchers investigating the role of neuroinflammation in neurological disorders.
Disclosures
The authors declare that they have no competing financial interests.
Acknowledgements
This research was support by an Aims2Cure, UK and a UCL Impact Award Ph.D. studentship to JMP and an MRC Capacity Building Ph.D. studentship in Dementia to JMP.
Materials
| Name | Company | Catalog Number | Comments |
|---|---|---|---|
| Forceps | Sigma-Aldrich | F4142 | The curved end facilitates removal of the cerebellum |
| Micro-dissecting scissors | Sigma-Aldrich | S3146 | Straight, sharp point facilitates rodent P4-7 dissection |
| L-leucine methyl ester hydrochloride | Sigma-Aldrich | 7517-19-3 | |
| EBSS solution | Sigma-Aldrich | E7510-500 ml | |
| Poly-D-lysine | Sigma-Aldrich | 27964-99-4 | Coat coverslips 1 day before use |
| Bovine serum albumin (BSA) | Sigma-Aldrich | A9418 | |
| Phosphate buffered saline (PBS) | Sigma-Aldrich | P4417 | |
| DNase | Sigma-Aldrich | D5025 | |
| Soybean trypsin inhibitor | Sigma-Aldrich | T6414 | |
| Mouse anti-ED1 antibody | Abcam | ab31630 |
References
- Herculano-Houzel, S. The remarkable, yet not extraordinary, human brain as a scaled-up primate brain and its associated cost. PNAS. 26 (109), 10661-10668 (2012).
- Evans, G. J., &Pocock, J. M. Modulation of neurotransmitter release by dihydropyridine-sensitive calcium channels involves tyrosine phosphorylation. Eur J Neuro. 11 (1), 279-292 (1999).
- Kingham, P. J., Cuzner, M. L., Pocock, J. M. Apoptotic pathways mobilized in microglia and neurones as a consequence of chromogranin A-induced microglial activation. J Neurochem. 73 (2), 538-547 (1999).
- Contestabile, A. Cerebellar granule cells as a model to study mechanisms of neuronal apoptosis or survival in vivo and in vitro. Cerebellum. 1 (1), 41-55 (2002).
- Kramer, D., Minichiello, L. Cell culture of primary cerebellar granule cells. Methods Mol Biol. 633, 233-239 (2010).
- Facci, L., Skaper, S. D. Culture of rat cerebellar granule neurons and application to identify neuroprotective agents. Methods Mol Biol. 846, 23-37 (2012).
- Thiele, D. L., Kurosaka, M., Lipsky, P. E. Phenotype of the accessory cell necessary for mitogen-stimulated T and B cell responses in human peripheral blood: delineation by its sensitivity to the lysosomotropic agent, L-leucine methyl ester. J Immunology. 131 (5), 2282-2290 (1983).
- Giulian, D., Vaca, K., Corpuz, M. Brain glia release factors with opposing actions upon neuronal survival. J Neurosci. 13 (1), 29-37 (1993).
- Guillemin, G., et al. Obtention and characterization of primary astrocyte and microglial cultures from adult monkey brains. J Neurosci Res. 49 (5), 576-591 (1997).
- Hewett, J. A., Hewett SJ,, Winkler, S., Pfeiffer SE, Inducible nitric oxide synthase expression in cultures enriched for mature oligodendrocytes is due to microglia. J Neurosci Res. 56 (2), 189-198 (1999).
- Jebelli, J., Hooper, C., &Pocock, J. M. Microglial p53 activation is detrimental to neuronal sysnapses during activaton-induced inflammation: implications for neurodegeneration. Neurosci Lett. 7 (583), 92-97 (2014).
- Frade, J., et al. Glutamate induces release of glutathione from cultured rats astrocytes – a possible neuroprotective mechanism. J Neurochem. 105 (4), 1144-1152 (2008).
- Hamby, M. E., Uliasz, T. F., Hewett, S. J., Hewett, J. A. Characterization of an improved procedure for the removal of microglia from confluent monolayers of primary astrocytes. J Neurosci Methods. 150 (1), 128-137 (2006).
- Morgan, S. C., Taylor, D. L., Pocock, J. M. Microglia release activators of neuronal proliferation mediated by activation of mitogen-activated protein kinase, phosphatidylinositol-3-kinase/Akt and delta-Notch signalling cascades. J Neurochem. 90 (1), 89-101 (2004).
- Crocker, S. J., Frausto, R. F., Whitton, J. L., Milner, R. A novel method to establish microglia-free astrocyte cultures: comparison of matrix metalloproteinase expression profiles in pure cultures of astrocytes and microglia. Glia. 56 (11), 1187-1198 (2008).
- Kumamaru, H., et al. Liposomal clodronate selectively eliminates microglia from primary astrocyte cultures. J Neuroinflamm. 9, 116(2012).
Reprints and Permissions
