Various methods exist for introducing ototoxic agents to the cochleae of animal models. Presented is a surgical protocol for delivery of ototoxic agents to the round window niche. The procedure is reliable, creates targeted intra-cochlear lesions, and avoids mechanical damage to the microarchitecture. Examination of cochlear self-repair/regeneration is possible.
Method Article
The Mouse Round-window Approach for Ototoxic Agent Delivery: A Rapid and Reliable Technique for Inducing Cochlear Cell Degeneration
In This Article
Summary
Abstract
Investigators have utilized a wide array of animal models and investigative techniques to study the mammalian auditory system. Much of the basic research involving the cochlea and its associated neural pathways entails exposure of model cochleae to a variety of ototoxic agents. This allows investigators to study the effects of targeted damage to cochlear structures, and in some cases, the self-repair or regeneration of those structures. Various techniques exist for delivery of ototoxic agents to the cochlea. When selecting a particular technique, investigators must consider a number of factors, including the induction of inadvertent systemic toxicity, the amount of cochlear damage produced by the surgical procedure itself, the type of lesion desired, animal survivability, and reproducibility/reliability of results. Currently established techniques include parenteral injection, intra-peritoneal injection, trans-tympanic injection, endolymphatic sac injection, and cochleostomy with perilymphatic perfusion. Each of these methods has been successfully utilized and is well described in the literature; yet, each has various shortcomings. Here, we present a technique for topical application of ototoxic agents directly to the round window niche. This technique is non-invasive to inner ear structures, produces rapid onset of reliably targeted lesions, avoids systemic toxicity, and allows for an intra-animal control (the contra-lateral ear). Results stemming from this approach have helped deeper understanding of auditory pathophysiology, cochlear cell degeneration, and regenerative capacity in response to an acute injury. Future investigations may use this method to conduct interventional studies involving gene therapy and stem cell transplantation to combat hearing loss.
Introduction
Investigators have used a wide array of animal models to study the normal function of the auditory system as well as the pathophysiology of hearing loss. These models are also highly useful for conducting intervention studies against various pathologic processes and serve as the foundation for translational applications in human subjects. For most research involving the cochlea and its associated auditory pathways, some degree of damage or disruption must be introduced to the system. Often, the damage is intentionally aimed to create a specific lesion, allowing investigators to study the effect of that lesion on normal function, as well as the cochlear ability to recover from it. When selecting a particular animal model and/or technique(s) for introducing damage, a number of factors must be considered to achieve the best possible outcomes. Various animal models may respond differently to interventions, while the direct and indirect effects of a technique may be entirely deleterious to the desired outcome. In most cases, the ideal inner ear damage protocol would avoid systemic toxicity, rapidly and reliably produce damage, create a precise and consistent lesion, and be survivable to allow further study of functional, cellular and molecular changes. Ideally, these methods would also preserve the delicate microarchitecture and electrochemical gradients of the cochlea to the greatest extent possible.
To date, investigators have succeeded in establishing a number of techniques to induce inner ear injury. Most of these entail exposing the cochlea to an ototoxic agent either systemically or via surgical approach. Techniques include parenteral injection, intra-peritoneal injection, trans-tympanic injection, endolymphatic sac injection, and cochleostomy with perilymphatic perfusion. These techniques have been used to introduce a variety of ototoxic agents, such as furosemide, gentamicin, ouabain, and heptanol.1-5 While successful at creating specific cochlear lesions, the above techniques also have acknowledged limitations. Systemic injections can be highly toxic to the animal and may be associated with unintended cochlear insults and inconsistent outcomes. The latter shortcoming has also been associated with trans-tympanic injections. Techniques such as cochleostomy and perilymphatic perfusion, while capable of inducing rapid and highly reliable lesions, are directly invasive to inner ear structure and function. Many of the surgical approaches are also associated with a high degree of technical difficulty and may require leaving foreign objects in the animal, such as a micropump infuser.2-4,6-8 No single technique is free of shortcomings, and investigators must choose methods carefully to fit their experimental needs. Here, we describe, in detail, the round window niche (RWN) application technique for topical delivery of ototoxic agents in adult mice.
First described by Husmann et al in 1998 while studying gentamicin’s effect on sensory hair cell degeneration in an avian model, this technique was found to be capable of producing significantly more reliable lesions than systemic gentamicin application, while avoiding associated toxicities.9 Since then, a number of other investigators, including our laboratory, have utilized this technique to great success. In 2004, Heydt et al. adapted it to a mouse model and described an enhanced ability to control lesion size by filling the RWN with absorbable gelatin sponge soaked in varying concentrations of gentamicin.10 Palmgren et al., in 2010, studied the ototoxic effects of beta-Bungarotoxin, a potent element in the venom of the Taiwanese banded crate, by applying an aqueous form of it to the RWN of adult rats.11 In addition, a number of previous studies from our laboratory have utilized the round window approach to study the ototoxic effects of furosemide, ouabain, and heptanol.5,6,12-15 Results of these studies have demonstrated the importance of cochlear fluid and ion homeostasis on normal hearing, discovered cell proliferative ability in the spiral ganglion and cochlear lateral wall, and furthered our understanding of age-related hearing loss.
The following approach involves surgically accessing the middle ear via a postauricular incision and partial unroofing of the bony tympanic bulla. This allows for excellent exposure of the RWN and membrane to which a selected ototoxic agent may be directly applied. The liquid agent then pools in the cup-like hollow of the RWN (or slowly drains from a saturated absorbable gelatin sponge carrier packed into the RWN) and diffuses through the round window membrane into the perilymphatic space of the cochlear vestibule. No direct cochleostomy is made in this approach. Advantages of this technique include preservation of inner ear microarchitecture, avoidance of systemic toxicity, allowance of an intra-animal control ear, speedy onset of effect, selective degeneration in certain cochlear cell types (e.g., type I spiral ganglion neurons with ouabain exposure and cochlear type II fibrocytes induced by the treatment of heptanol), and reproducible/reliable results. This technique can be applied with few alterations between other rodent species, including rats, guinea pigs, and gerbils. Drawbacks include a steep technical learning curve and the relative limitation of ototoxic insult that is constrained to a single point in time.
Protocol
All aspects of animal research were conducted in accordance with the guidelines of the appropriate Institutional Animal Care and Use Committee. All vertebrate animal experimental procedures described here were approved under the guidelines of the Medical University of South Carolina’s (MUSC) Institutional Animal Care and Use Committee (IACUC).
1. Model Selection
- Maintain the animal model in a low noise vivarium with routine caretaking per institutional protocols until ready for use. In animal research facilities (ARFs), maintain vibration stability, noise damping, diurnal lighting, prep space, surface finishes, sealing and caulking, and ventilation that meet NIH standards.
Note: National Institutes of Health (NIH) guidelines for ARFs and maintenance of a low noise vivarium may be reviewed at: http://www.orf.od.nih.gov/PoliciesAndGuidelines/BiomedicalandAnimalResearchFacilitiesDesignPoliciesandGuidelines/ - For all experiments, use the right ear as the experimental ear. The left ear serves as an intra-animal control and is not surgically altered.
- Inspect the model animal pre-operatively for signs of middle or outer ear infection. Potential signs may include drainage of fluid or pus from the ear, inflamed pinna tissue, and/or lethargy of the animal. This is unusual, but if noted, avoid further surgery and treat the animal appropriately.
2. Preoperative Procedures
- Anesthetize the animal 30 min prior to surgery and any perioperative procedures via intra-peritoneal (IP) injection of ketamine (100 mg/kg IP) and xylazine (20 mg/kg IP). Supplement anesthesia as necessary, as judged by a positive toe-pinch reflex, with a lower dosage of ketamine (25 mg/kg IP) and xylazine (5 mg/kg IP). Determine dosing in compliance with institutionally allowed protocols for mice with age appropriate adjustments in dose.
- Check for full sedation of the model. Check for a stage 3 plane of anesthesia for the entirety of the described protocol marked by a regular breathing rate, a lack of righting reflex (in mice), and lack of pedal and palpebral (toe-pinch) reflexes. Maintain the animal at this level of anesthesia. This is paramount for the minimization of pain and intraoperative movement, bleeding, and leakage of interstitial fluids during surgery.
- Maintain the animal’s body temperature at 37.5 °C with a closed-loop heating pad.
- Administer analgesia via subcutaneous injection of buprenorphine. Deliver buprenorphine (0.1 mg/kg SQ once 30 min before surgery) as analgesia to minimize any surgical discomfort. Base dosing and alternatives suitable to the selected model on institutionally approved protocols. Antibiotics use is not necessary if good aseptic technique has been practiced. The animals receive post-operative analgesia if there are signs of pain and distress.
- Perform physiologic tests preoperatively. Performing auditory brainstem response (ABR) testing and/or distortion product optoacoustic emissions testing (DPOAE) both pre-operatively and just prior to sacrifice of the animal serves as an objective measurement for the effect of the chosen ototoxic agent on the mouse’s hearing.
3. Surgical Preparation and Positioning
- Sterilize all instruments pre-operatively per institutional standards. Prepare surgical instruments and field in a consistent, sterile, and organized manner to avoid unneeded effort and movement during the procedure. Typical instruments required includes sharp dissecting scissors, several pairs of metallic forceps with jeweler’s tips, an otologic pick, an otologic curette, and a bipolar electrocautery unit (Figure 1).
- Prepare and sterilize paper wicks made from labwipes in advance by cutting a small triangular piece of the wipe (~ 0.7 in x 1.25 in x 1.75 in) and twisting it tightly between the thumb and forefinger of one hand (~ 1.25 in). Creation of a tightly twisted, extremely thin wick is paramount to success of the procedure. Prepare a total of 15-20 wicks prior to surgery (Figure 2).
- Use a dental drill to quickly perforate the bone of the tympanic bulla in a controlled fashion. Use of a belt-driven dental hand drill with a 1 or 2 mm tapered tip is preferable. An operative microscope is necessary to complete the protocol. (see Step 4.7)
- Pre-draw 0.2 ml of an aqueous solution containing the selected ototoxic agent into a 1 ml tuberculin syringe with a 28 G, 1/2' needle. Typically 1 drop (~10 µl) of the agent is enough to completely fill the mouse RWN. A metallic, blunt tip syringe needle eases the delivery of the agent while preventing damage to underlying structures by a sharp bevel tip. Expel any air within the syringe as bubbles can inadvertently fill the RWN and/or prevent proper application of the agent to the round window itself.
- Remove fur from the post-auricular skin using electrical grooming clippers. Remove fur in a zone extending from the auriculo-cephalic crease rostrally to the shoulder girdle caudally. Extend hair removal from the dorsal, sagittal midline to the mandibular angle laterally. Proper fur removal is paramount to maintaining a clean and clear surgical field. Gently brush clippings from the intended surgical site.
- Sterilize skin of prepared area per institutional protocols. Apply betadine (povidone/ iodine) alternated with ethanol topically in a circular manner for 2 min. Other agents can be substituted per institutional guidelines.
- Place the animal on a flat surface to maintain constant body positioning during the procedure. Use a small heating pad placed under the body onto the platform to control body temperature during the procedure to maintain the animal’s body temperature at 36-38 °C. Do not overheat the animal as this may lead to mild to severe skin damage and/or early euthanasia.
- Secure the head of the animal via a bite block/head holder apparatus. Utilize a 0.5 cm by 2 cm bite block machined from brass with 2-4 mm diameter holes drilled through it at 5 mm intervals along the long axis. Open the animal’s mouth around this fixture and fit the upper central incisors into one of the holes depending on the animal’s size. Gently tighten a small clamp over the dorsum of the animal’s snout to hold it in place (Figure 3).
- Confirm that the bite block/head holder is rigidly connected to the center of a U-shaped articulating arm (Figure 3). Secure a 1cm wide rod to the left arm of the “U” and use rod as a left-side head rest (the right side is always the operative side).
- Once firmly secured in the head holder, rotate the mouse to a left lateral decubitus position. Position the body carefully on the flat operating surface to ensure it will be stable throughout the procedure and avoid undue torsional stress on the cervical vertebrae.
- Position an operating microscope capable of 4x, 10x, and 20x magnification over the surgical field. Confirm that the microscope can maintain its position in a hands-free manner as this is ideal for the two-handed surgical protocol discussed below.
- Place a bipolar-enabled cautery unit with fine tipped jeweler’s hand piece in a position that is immediately available for the assistance in cauterization of small vessels and dissection of tissue. This may also be necessary should heavier bleeding be encountered.
4. Surgical Approach
- Under microscopic magnification, use sharp scissors or a scalpel blade to create a 1-1.5 cm postauricular incision, approximately 6-8 mm caudal to the auriculocephalic crease. In the adult mouse, an incision from the dorsal midline laterally to a point near the angle of mandible is adequate. Carefully avoid cutting deeply to preserve underlying vascular structures.
- Conduct careful blunt dissection through the subcutaneous fat layer which can be of variable thickness. Fat may be safely removed if needed to improved exposure. Take caution when dissecting in a ventral-medial direction as the external jugular vein traverses this area and damage to this structure may cause large amounts of blood loss and flooding of the surgical field. Control any excessive bleeding with absorbable gelatin sponges and/or cotton pellets. Use bipolar cautery for heavier bleeding.
- Once the fat layer is properly divided, expose the cervical musculature. Note important structures including the large muscle body of the cleidomastoideus centrally within the exposed surgical field, the external jugular vein ventrally, and parotid tissue rostrally overlying the angle of mandible. An important landmark is a small nerve branch (of cranial nerve XI) that wraps around the posterior/dorsal edge of the cleidomastoideus to extend rostrally toward the pinna (Figure 4).
- Gently retract the cleidomastoideus muscle body in a posterior/dorsal direction (Figures 4, 5). Gently divide the transparent fascia enveloping the muscle body. In a similar manner, gently retract the parotid and external jugular vein in the opposite (anterior/ventral) direction (Figure 5).
- With good retraction of the cleidomastoideus muscle body, the shiny dome of the tympanic bulla periosteum will come into view (Figure 6). At the caudal aspect of the bulla, the insertion of a deeper cervical muscle, the sternomastoideus, will come into view (Figure 6). Preserve the facial nerve, which becomes visible at the dorsal and rostral aspect of the bulla dome. Place a self-retaining retractor (Sterile titanium shaft-- embedded in disposable silicone paste) prior to drilling.
- With two-handed technique, gently divide the bulla periosteum with bipolar diathermy to expose the underlying bone. Using forceps or an otologic curette, gently elevate and push the periosteum in a peripheral direction to widely expose the bulla dome.
Note: Step 4.6 is critical to maximize surgical view of the middle ear space. Utilize meticulous and gentle soft tissue handling to avoid bleeding and/or leakage of interstitial fluid into the bulla cavity after drilling. - Upon a properly exposed bulla dome, drill a 2 mm pilot hole through the bulla bone with a dental surgical drill between the caudal margin of the dome and the visibly opaque line (representing the tympanic membrane) extending across the rostral aspect of the bulla (Figure 7). Take care to drill only through bone to preserve underlying structures, such as the stapedial artery. Drill a second pilot hole nearby to facilitate un-roofing of the bulla bone (Figure 7).
- Using a pair of jeweler’s tip forceps, uncap the bulla bone in a dorsal and caudal direction (Figure 8). Remove the bone in a piecemeal fashion under high magnification. Do not puncture the stapedial artery, which lies directly beneath the bulla cap, as bleeding from this artery may compromise the procedure. Minimize the amount of bone removed to prevent excessive fluid entry to the middle ear while still allowing excellent visualization and access to the round window niche (Figure 8).
5. Round Window Application of Ototoxic Agent
- Make subtle rotational adjustments to the head holder to bring the RWN squarely into view. The RWN is typically located at the dorsal and caudal aspect of the middle ear space and appears as a cup-like indention of the otic capsule bone. In most cases, the stapedial artery runs 1-2 mm ventral/rostral to this. The RWN can sometimes be tucked peripherally under an acute angulation of the bulla dome. In such cases, careful positioning of the animal’s head is paramount.
- Using the paper wicks prepared preoperatively, remove all visible fluid in the middle ear and RWN until dry bone is visualized.
Note: This is the most critical step of the entire protocol, as the ~10 µl (1 drop) of ototoxic agent applied to the RWN can easily be diluted by this fluid.
- Using the paper wicks prepared preoperatively, remove all visible fluid in the middle ear and RWN until dry bone is visualized.
- Under maximum magnification, use a fine caliber needle on a 1 ml tuberculin syringe to apply one drop (~10 µl) of ototoxic agent directly to the RWN, filling it completely. Take care to not disrupt the stapedial artery and observe closely for the replacement of a small light reflection at the base of a dry niche with a dull and hazy fluid meniscus as an indicator that the niche is filling properly.
- Allow the agent to rest within the RWN for approximately 10 min exposure time. After this, completely wick out the agent and replace it with a new application of the same agent. Determine repetitions of application according to agent specifications. Total exposure time in this procedure typically ranges between 30 to 60 min.
- At the end of the procedure, completely wick away the agent one final time and apply fresh agent to the RWN. Leave the bulla uncapped and use forceps to close the soft tissue over the surgical site.
- Seal surgical site at the level of the skin with a 4-0, non-absorbable monofilament suture. Place the animal in a recovery cage/station. Monitor the animal’s clinical condition regularly following the operation. Maintain the animal in appropriate environment conditions, including housing with soft bedding and supplementation with soft food, to minimize stress. Determine future procedures and post-operative conditions according to the institutional IACUC protocols.
- Use institutional IACUC protocols to sterilize instruments before use on the next animal. Allow for proper cooling time between instrument use.
6. Postoperative Procedures and Cochlear Tissue Harvesting
- As described in step 2.5, perform physiologic testing of hearing postoperatively at desired points and prior to sacrifice. Perform Postoperative procedures according to experimental aims. Sacrifice the animal on any desired postoperative day.
- Upon full anesthesia via IP injection, as required per institutional IACUC protocols, sacrifice the animal. Using sharp scissors, decapitate animal just caudal to the occiput. Sharply open the cranial vault with scissors along the dorsal and ventral midline and spread widely. Gently scoop out brain tissue to expose the temporal bones.
Note: A number of procedures for investigation of post exposure changes in the cochlea can branch from this point and will be mentioned in the discussion section. Determine the investigative method most relevant to the experimental aims. If electron microscopy is planned after the cochlea are sectioned, use cardiac catheterization to pre-fix the tissue. This is beyond the scope of this discussion and has been covered in depth elsewhere.13 - Cut the temporal bones out of the skull base with the scissors and immediately placed in fixative solution. Immerse bones directly in 4% paraformaldehyde for 1.5 hr at RT. Monitor fixation time, as longer duration can limit the outcome of histological analysis at later steps. Decalcify dissected bones for a variable period of time via submersion in 1 mM Ethylenediaminetetraacetic acid (EDTA).
Results
In a recent study by Stevens et al utilizing the above protocol, adult CBA/CaJ mice of both genders were exposed via round window diffusion to heptanol.15 Heptanol is a gap junction un-coupler known to produce targeted, recoverable injury to cells of the cochlear lateral wall. The purpose of the study was to produce a reliable model for targeted cochlear damage, allowing for investigation of post-surgical regeneration of any damaged elements. Pre-surgical and post-surgical hearing thresholds served as a functional endpoint. Microscopy and immunohistochemical staining techniques were used to study morphologic changes. Significant increases in ABR thresholds were observed in heptanol-treated mice (Figure 9). Control animals receiving sham surgery, with delivery of saline instead of heptanol, did not demonstrate significant threshold shifts at any tested frequency.
Immunostaining against an inwardly rectifying potassium channel (Kir) 4.1 served as an indirect method for visualizing damage/recovery of cochlear structures. This demonstrated highly reproducible differences between treatment and control ears. Overall staining intensity was markedly decreased within the stria vascularis (StV) and amongst fibrocytes of the spiral ligament (SLF) 1-3 days after heptanol exposure, denoting large amounts of targeted damage to these areas. There was a particular decrease in Kir 4.1 staining intensity in the areas of type II and type IV SLFs (Figure 10) and StV (Figure 11). Evidence of disrupted nuclear integrity and chromosomal condensation/blebs typical of cellular apoptosis was also seen on nuclear counterstains in these cochlear areas (Figure 10). Vacuolated zones of Kir 4.1 staining resolved markedly at 7 days and were absent entirely at 14 days. When Kir 4.1 staining intensity was quantified in the areas of StV, treated ears demonstrated an initial trough followed by a significant shift (p < 0.05) back toward control intensity 7 days after heptanol exposure (Figure 12).

Figure 1. Instrument set up. Depiction of pre-surgical set-up of instrumentation. All equipment should be easily accessible within the sterile surgical field. Typical instrumentation includes 2 sharp dissection scissors, 2-3 straight and/or curved tip Jeweler’s forceps with ear curettes, curved shaft otologic picks (later substituted with Rosen picks – not shown), and an electro-cautery unit with fine curved tip Jeweler’s forceps headpiece. Please click here to view a larger version of this figure.
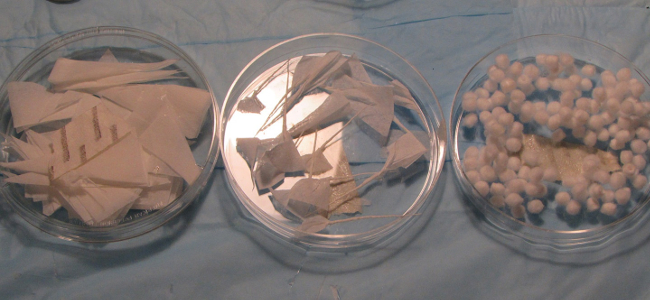
Figure 2. Surgical supplies. Additional supplies for maintaining the RWN environment. Sterilized labwipe cutouts for paper wick formation (left), tightly-formed paper wicks made from sterilized lab wipes (center), and 4 mm cotton pellets (right) are used to wipe excess fluid and blood flooding in the round window niche. Please click here to view a larger version of this figure.
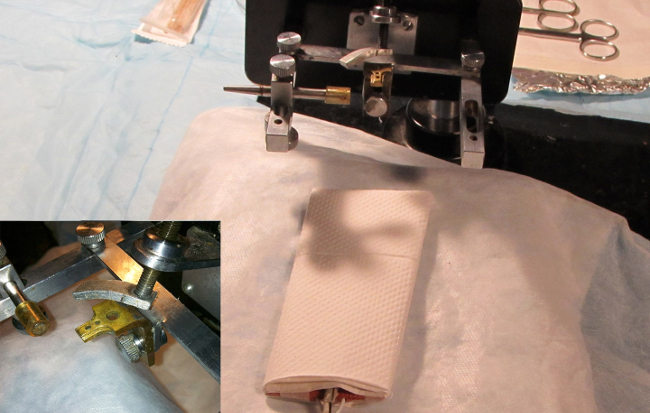
Figure 3. Animal head holder. Image depicting the head holder and bite block. The holes in the block fit and secure the upper central incisors. A clamp is gently tightened over the dorsal snout to secure the animal in place. Use of a head holder is critical for successful surgical outcome. Ideally, this should be able to rotate about the rostral-caudal axis of the animal to optimize surgical views of the bulla during the procedure. Please click here to view a larger version of this figure.

Figure 4. Cleidomastoideus m.. Schematic graph depicting the basic anatomy of the rodent cervical musculature and its association with the external jugular vein. The cleidomastoideus muscle is the most readily identified muscle during the surgical approach. Release of the enveloping fascia followed by posterior/dorsal retraction of the muscle body will direct surgical dissection toward the tympanic bulla (black circle). Please click here to view a larger version of this figure.
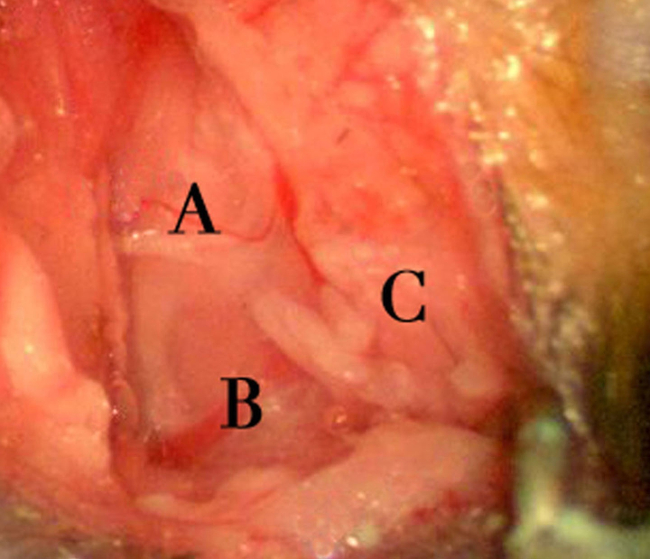
Figure 5. Surgical exposure area. Depicts the exposure after dissection through the cutaneous and subcutaneous fat layers. Structural landmarks of note include a branch of cranial nerve XI overlying the cleidomastoideus muscle (A), the external jugular vein (B), and exposed parotid tissue (C). The cranial nerve XI branch is often associated with a small vessel and must be divided prior to proceeding. Right to left on the image corresponds to the animal’s rostral-caudal axis. Please click here to view a larger version of this figure.
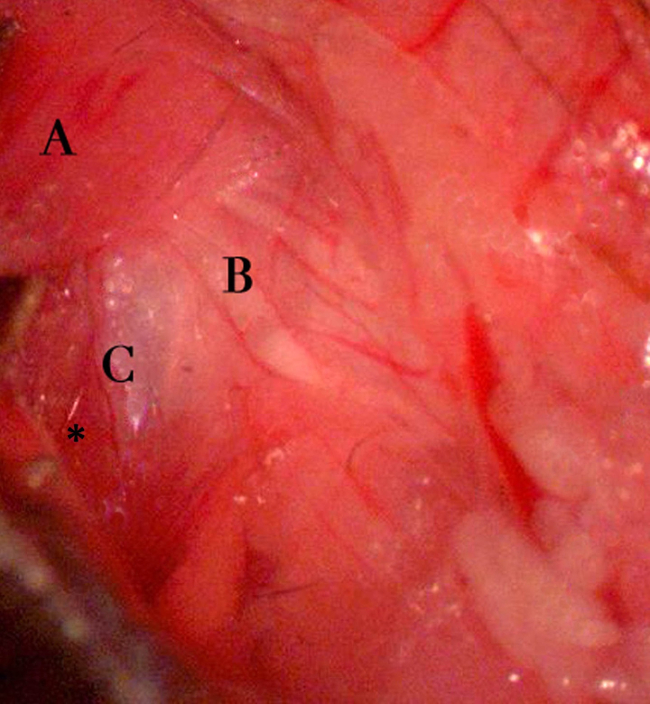
Figure 6. Exposing the bulla. Exposure of the tympanic bulla after retraction of the cleidomastoideus and surrounding structures. Notable landmarks include the cleidomastoideus muscle body (A) reflected posteriorly/dorsally, the facial nerve (B), and the shiny dome of the tympanic bulla periosteum (C). Also, note the insertion of the sternomastoideus muscle at the left caudal aspect of the tympanic bulla (asterisk). The presence of the facial nerve at the dorsal and rostral aspect of the bulla is a critical landmark for true identification of the bulla. Right to left on the image corresponds to the animal’s rostral-caudal axis. Please click here to view a larger version of this figure.
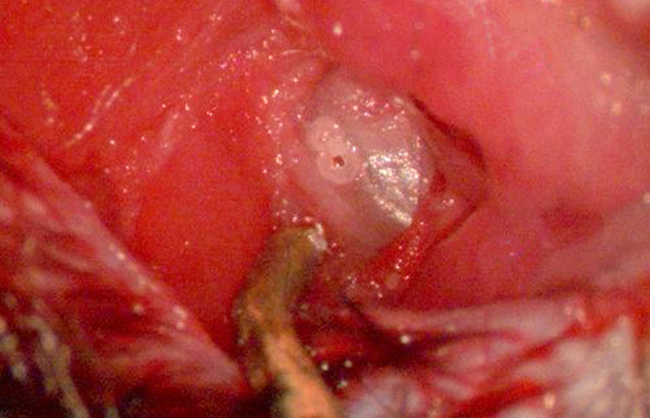
Figure 7. Exposing round window niche I. Image depicting the tympanic bulla fully exposed after dissection of the overlying periosteum. The pilot hole is best placed at the halfway point between the caudal edge of the bulla dome and a subtle opaque line visualized within the rostral aspect the bulla (representing the tympanic membrane). A second, adjacent pilot hole may facilitate easier un-roofing of the bulla bone. Avoidance of deep drilling should be taken so as not to injure the underlying stapedial artery. The dark, metallic object at the bottom of the image is the titanium soft tissue retractor. Please click here to view a larger version of this figure.
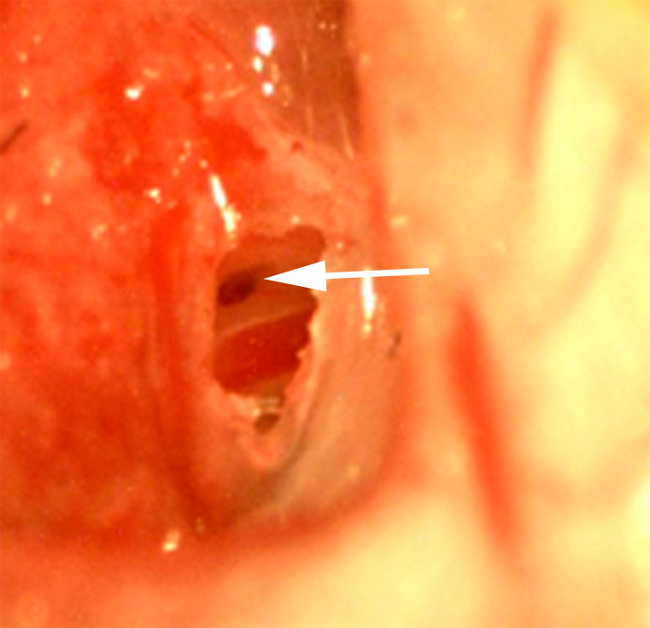
Figure 8. Exposing round window niche II. Uncapped tympanic bulla with exposure of the round window niche (arrow) and stapedial artery (red structure 1-2 mm lateral to the niche) as viewed under 20x magnification. The niche often lays in a position tucked under the acute angle formed by the bulla dome with the otic capsule at the caudal aspect of the dome. It is imperative that full visualization of the niche be achieved prior to application of the ototoxic agent or wicking. Excessive bone removal during uncapping should also be avoided as interstitial fluid/blood tended to flood the cavity when large holes were created. Please click here to view a larger version of this figure.
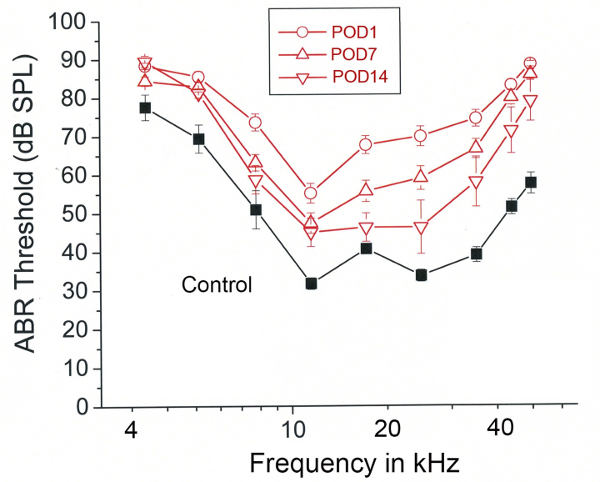
Figure 9. Representative results – Heptanol induced hearing loss and recovery. Mean auditory brainstem response (ABR) thresholds (dB SPL) plotted as a function of tone pip frequency. Measurements are grouped according to pre-exposure (Black-Control) and post-operative day (POD) 1, 7, and 14 (Red). Error bars represent SEM. Figure was re-plotted from Stevens et al. 2014.15 Please click here to view a larger version of this figure.
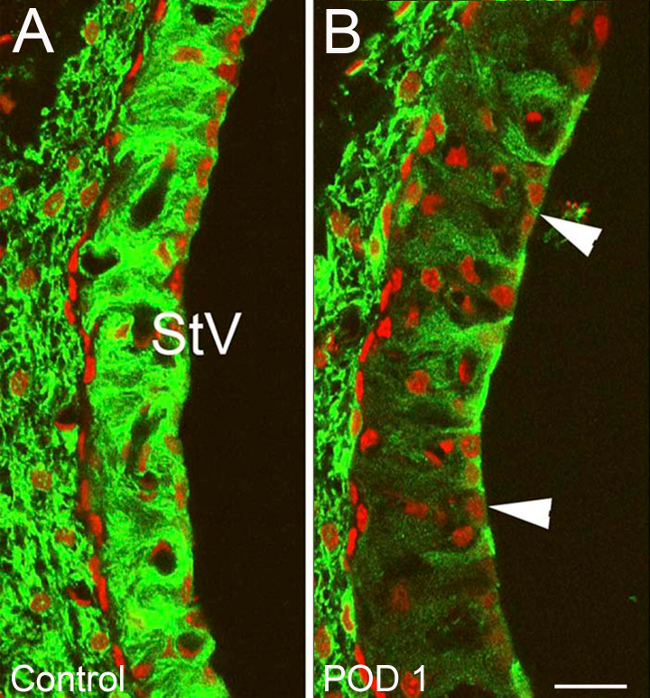
Figure 10. Representative Results – Targeted cochlear damage after heptanol exposure part I. Changes in Potassium Inner Rectifier (Kir) Channel 4.1 staining within the stria vascularis (StV) of ears treated with heptanol and control ears. (A) Normal Kir 4.1 staining typical of control ears with strong strial cell affinity for Kir 4.1 (green). (B) Treatment ear on POD1. Large vacuolized zones of decreased Kir 4.1 affinity are seen within the StV (Arrowheads) along with an overall decrease in StV Kir 4.1 staining intensity. Nuclei are counterstained with propidium iodine (red) (B). Scale bar =15 µm. Figure was re-plotted from Stevens et al, 2014.15 Please click here to view a larger version of this figure.
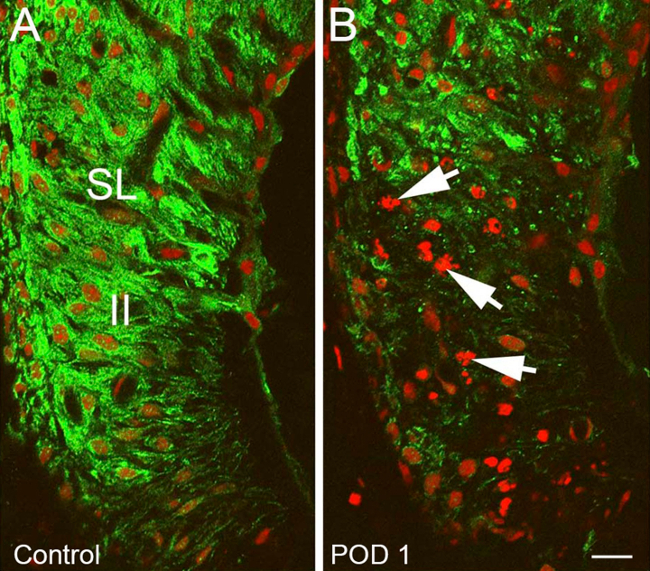
Figure 11. Representative Results – Targeted cochlear damage after heptanol exposure part II. Changes in the spiral ligament (SL) of heptanol treated ear compared to control ear. (A) Normal Kir 4.1 staining (green) within the SL typical of control ear with normal appearing type II spiral ligament fibrocytes (II). (B) Heptanol treated ear with marked decrease in Kir 4.1 staining intensity in the area of type II spiral ligament fibrocytes, nuclear disruption and chromosomal condensation/blebs consistent with apoptosis (Arrows). Nuclei are counterstained with propidium iodine (red). Scale bar = 15 µm. Figure was re-plotted from Stevens et al, 2014.15 Please click here to view a larger version of this figure.
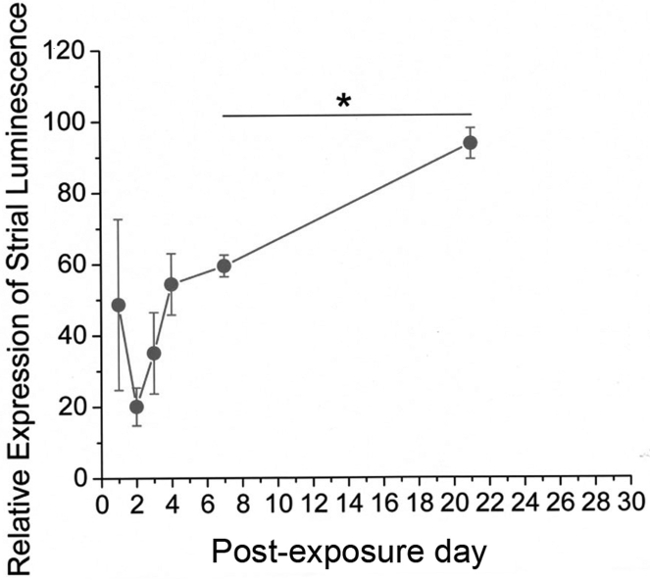
Figure 12. Representative Results – Recovery of cochlear staining intensity following heptanol exposure. Mean relative luminance of Kir 4.1 staining plotted as a function of post-exposure day. Relative luminance is calculated as Kir 4.1 reflective intensity under confocal microscopy in heptanol treated ears taken as a percentage of the same in control ears. Note POD14-28 data are pooled as a single point on the curve. Solid circles represent mean values while error bars represent standard error of the mean. A significant recovery of relative luminance was demonstrated between POD 7 and later dates (Student’s t test p < 0.05, asterisk). Figure was re-plotted from Stevens et al., 2014.15 Please click here to view a larger version of this figure.
Discussion
The protocol and representative results described above were obtained in a CBA/CaJ mouse model including both genders. This inbred strain is well established as a “good hearing” standard and “normal aging” model in hearing research.16-23 Description of use of this protocol in other mammalian models is beyond the scope of this text. The reader should note, however, that the RWN application technique offers several advantages to studying the mammalian inner ear. Of these, the most notable is that it avoids direct disruption of the delicate anatomical structure and biochemical gradients that exist within the walls of the otic capsule. Procedures such as cochleostomy and implantation of infusion pumps have the propensity to directly violate inner ear structures leading to permanent threshold shifts; a fact that must be taken into consideration when analyzing outcomes. Disruption of cochlear lateral wall structures by invasive methods may also limit the use of ototoxic agents such as furosemide or heptanol, whose specific zone of effect is restricted to that location.15,24 Alternative non-invasive approaches such as trans-tympanic injection and parenteral injection have been plagued by unreliable outcomes and/or systemic toxicity to the animal model. This application method has proven to avoid both of these shortcomings, achieving a level of consistency approaching that of the more invasive methods discussed above.
Other advantages of this technique include is its wide applicability to a number of animal models and feasibility to incorporate into an existing laboratory infrastructure. Regarding the latter, no specialized reagents or chemicals are required aside from the chosen ototoxic agents, anesthetics, and analgesics. Ototoxic agents are typically utilized at a fixed concentration and mixed in a large enough volume of solution (5 ml) to last long periods of time considering each application uses about 10 µl (in mice). Thus, after the initial procurement of supplies and instruments, investigators are relatively free from time consuming solution preparation or frequent replacement of materials. This technique also offers reductions in operative time, which may be significant when compared to procedures involving implantation of perilymphatic infusion pumps or cochleostomies. Upon reaching a level of technical proficiency, our average completion time from initial incision to closure was typically 20 min to 1.5 hr depending on the length of exposure desired for the ototoxic agent. Three or four surgeries may easily be completed in a single day, allowing for increased efficiency and increased potential for obtaining successful results. As described above, this technique can also be easily applied to a variety of rodent models including mice, rats, guinea pigs and gerbils.
Limitations of this method are centered on the moderately steep learning curve needed to master it and decreased expected results until technical proficiency is reached. As will be discussed in greater detail below, small errors during the surgical approach or insufficient visualization of the surgical field will almost invariably lead to a poor outcome. Subtle findings that a novice may fail to recognize, such as a sub-millimeter thick air bubble blocking access of the agent to the round window membrane or interstitial fluid diluting the agent, take time to appreciate and develop the psychomotor skills required to correct them. However, with repeated performance of the procedure these obstacles are easily overcome and constitute a less daunting technical challenge to investigators than some of the aforementioned invasive methods. Finally, this technique is associated with the relative limitation that cochlear injury can only be induced at a single point in time during the surgical exposure. This can be overcome to a certain degree, by filling the RWN with absorbable gelatin sponge soaked in the agent as was described by Heydt et al.10 The absorbable gelatin sponge will resorb over time, but may allow for a longer exposure period than is achievable through application of an aqueous solution alone.
In order for an investigator to realize the full advantages of this technique and avoid any pitfalls, it is critical to recognize the two critical elements of this technique: 1) the consistently maintain visualization of the middle ear space and RWN; and 2) ability to keep surgical field free of interstitial fluid and/or blood. In achieving the former of these, the importance of a proper head-holder cannot be over-emphasized. Secure fixation of the animal’s head ensures a stable view under the microscope; the importance of which becomes readily obvious when subtle instrumentation drastically changes the positioning of structures under magnification. A good head holder that can rotate about the animal’s rostral-caudal axis also facilitates important dynamic changes in the investigator’s line of site. Often, a few millimeters of rotation about this axis can mean the difference between visualization of the RWN and visualization of only the otic capsule bone. The ability to constantly change view is also paramount to ensuring interstitial fluid is properly removed from the depths of the niche and also that the ototoxic agent is fully removed between applications as discussed in Part 5. In our experience, blood, condensation, or interstitial fluid that enters the middle ear space has the ability to interfere with entire experiment. This is not surprising, as the tiny amount of ototoxic agent applied to the round window (~10 µl) can easily be diluted by coming into contact with even small volumes of extraneous fluid. For this reason, meticulous surgical dissection, piecemeal uncapping of the tympanic bulla and careful preservation of the stapedial artery are tantamount to a successful experimental results.
If the above critical steps are observed and expected outcomes are still not achieved, troubleshooting should commence. In our experience, it is often helpful to perform trial variations of two procedural elements. The first is to modify the frequency with which the ototoxic agent is replenished in the round window. Depending on the agent being used, total exposure time is between 30 min and 1 hr, with complete wicking and subsequent replacement of the agent every 10 min. If exposing for shorter durations, increasing overall exposure may allow the agent more time to diffuse across the round window membrane. Additional exposure and replenishing may also help to avoid unwanted dilution of the ototoxic agent by blood, condensation, or interstitial as discussed above. Caution should be maintained when using this approach, however, as it tends to increase the risk of inadvertently injuring the stapedial artery and/or introducing interstitial fluid to the RWN.
This technique is significant in what it offers to investigations of cochlear physiology and pathophysiology. This minimally invasive technique allows detailed study of delicate biochemical processes and has been tantamount in furthering our research aimed at assessing cochlear regenerative potential.12,24 This surgical approach and exposure is also reproduced across a variety of other offshoot techniques, and successful results using this method have been reported in studies of cochlear stem cell implantation.14 A great deal remains unknown about the cochlea, however, this technique, along with the wider armamentarium available to investigators, will aid in narrowing this knowledge gap.
Disclosures
No competing financial interests. The authors have nothing to disclose.
Acknowledgements
This work was supported by National Institutes of Health (NIH) Grant number: NIH P50DC00422 (H.L.); NIH R01DC12058 (H.L.). This work also benefitted from the South Carolina Clinical and Translational Research Institution (SCTR) Clinical and Translational Science Award (NIH/NCRR UL1RR029882). The funders had no role in study design, data collection, and/or analysis. The authors would like to thank Lonnie E. Brown Jr. for his artistic and graphic contributions.
Materials
| Name | Company | Catalog Number | Comments |
|---|---|---|---|
| 1-Heptanol 98% | Sigma-Aldrich | H2805 | PubChem Substance ID 24895536 |
| Ketaset Injectable | Patterson Veterinary | 07-803-6637 | Concentrate 100mg/ml |
| (Ketamine HCl) | 10 ml | Schedule CIII controlled substance | |
| Anased Injectable | Lloyd Laboratories | NADA# 139-236 | Concentrate 20mg/ml |
| Buprenex Injectable | Patterson Veterinary | 07-850-2280 | Concentrate 0.3 mg/ml |
| (Buprenorphine HCl) | 5 ampules per box | Schedule CIII controlled substance | |
| Betadine Skin Prep Solution | Medline | MDS093941 | 1 Quart screw top bottle |
| 0.9% Sterile Saline | Variable | For mixing solutions and injections | |
| Operating Microscope | Carl Zeiss | 32192 | |
| Controlled Acoustics Environment Sound Booth | Industrial Acoustics Company | ||
| Surgical Head Holder | Custom Made – | Please see Figure 3 | |
| Medical University of South Carolina | |||
| Neck Soft-Tissue Retractor (Wire Speculum, Titanium) 1.75 inch | World Precision Instruments | 555801L | Maximum spread 20 mm |
| Embedded in disposable putty to affix dynamically to head holder | |||
| 90N Dental Belt Driven Hand Drill | Emesco | Vintage Item | |
| Scalpel Handle Size 6 | Bard-Parker | MEDC-011990 | |
| #15c Stainless Steel Surgical Scalpel Blade | Bard-Parker | SKU: 097-7215 | 50 Blades/Box |
| Via ACE Surgical Supply Code | |||
| Straight Tip Jewelers Forceps | Bernell | MIL17304 | |
| Iris Scissors Curved | Medline | DYND04026 | |
| Iris Scissors Straight | Medline | DYND04025 | |
| Stevens Tenotomy Scissors Straight | Medline | MDG3222111 | |
| Rosen Ear Needle Straight Shaft, Lightly Curved Tip | MytaMed | Item# 6.56.00 | Figure 1 demonstrates angled shaft picks. This was later substituted for the Rosen picks |
| Rosen Ear Needle Straight Shaft, Strongly Curved Tip | MytaMed | Item# 6.56.01 | |
| Kimwipes Delicate Task Wipers | Kimtech Science | CODE 34155 | White, Size 4.4x8.4 Inch. Cut to triangles and rolled into fine tip wicks. |
| House Ear Curette, 6” shaft, light angle | Medline | MDG0396486 | |
| Gelfoam (absorbable gelatin sponge) Size 100 | Medline | IIS34201 | Substitutions may be made |
| Cotton pellets #3 4 mm | Richmond | Manufacturer Code 100108 | |
| ElectroSurgical Unit 100 E M/M | Elmed | List No. 52-5770 | Bipolar and Monopolar Capable |
| 1cc U-100 Insulin Syringe 28G, 0.5” length needle | BD | Product Number: 329410 | Optional for delivery of Ototoxic agent |
| 23G, blunt tip, 1” length needle | Kendall | Product Code 8881202397 | For controlled delivery of Ototoxic agent with less risk of damaging stapedial artery |
| Surgical Mask | U-line | S-10478 | |
| Exam Grade Nitrile Surgical Gloves | U-line | S-12549 | |
| Precision Hair Clippers | Wahl | Multiple models may be substituted | |
| 5-0 Nylon black monofilament suture on PC-1 13 mm 3/8 circle needle | Ethilon | 1855G | Substitutions may be made. |
| Instant Sealing Sterilization Pouch | Fisher | 01-812054 | |
| Dry Sterilizer | ROBOZ | Germinator TM 500 |
References
- Kimura, R. S., Iverson, N. A., Southard, R. E. Selective lesions of the vestibular labyrinth. The Annals of otology, rhinology, and laryngology. 97, 577-584 (1988).
- Dodson, H. C. Loss and survival of spiral ganglion neurons in the guinea pig after intracochlear perfusion with aminoglycosides. Journal of neurocytology. 26, 541-556 (1997).
- Wanamaker, H. H., Gruenwald, L., Damm, K. J., Ogata, Y., Slepecky, N. Dose-related vestibular and cochlear effects of transtympanic gentamicin. The American journal of otology. 19, 170-179 (1998).
- Lee, K. S., Kimura, R. S. Effect of ototoxic drug administration to the endolymphatic sac. The Annals of otology, rhinology, and laryngology. 100, 355-360 (1991).
- Schmiedt, R. A., Okamura, H. O., Lang, H., Schulte, B. A. Ouabain application to the round window of the gerbil cochlea: a model of auditory neuropathy and apoptosis. Journal of the Association for Research in Otolaryngology : JARO. 3, 223-233 (2002).
- Schmiedt, R. A., Lang, H., Okamura, H. O., Schulte, B. A. Effects of furosemide applied chronically to the round window: a model of metabolic presbyacusis. The Journal of neuroscience : the official journal of the Society for Neuroscience. 22, 9643-9650 (2002).
- Suzuki, M., Kikuchi, T., Ikeda, K. Endocochlear potential and endolymphatic K+ changes induced by gap junction blockers. Acta oto-laryngologica. 124, 902-906 (2004).
- Chen, Z., Mikulec, A. A., McKenna, M. J., Sewell, W. F., Kujawa, S. G. A method for intracochlear drug delivery in the mouse. Journal of neuroscience methods. 150, 67-73 (2006).
- Husmann, K. R., Morgan, A. S., Girod, D. A., Durham, D. Round window administration of gentamicin: a new method for the study of ototoxicity of cochlear hair cells. Hearing research. 125, 109-119 (1998).
- Heydt, J. L., Cunningham, L. L., Rubel, E. W., Coltrera, M. D. Round window gentamicin application: an inner ear hair cell damage protocol for the mouse. Hearing research. 162, 65-74 (2004).
- Palmgren, B., Jin, Z., Ma, H., Jiao, Y., Olivius, P. beta-Bungarotoxin application to the round window: an in vivo deafferentation model of the inner ear. Hearing research. 265, 70-76 (2010).
- Lang, H., Schulte, B. A., Schmiedt, R. A. Effects of chronic furosemide treatment and age on cell division in the adult gerbil inner ear. Journal of the Association for Research in Otolaryngology : JARO. 4, 164-175 (2003).
- Lang, H., Schulte, B. A., Schmiedt, R. A. Ouabain induces apoptotic cell death in type I spiral ganglion neurons, but not type II neurons. Journal of the Association for Research in Otolaryngology : JARO. 6, 63-74 (2005).
- Lang, H., et al. Transplantation of mouse embryonic stem cells into the cochlea of an auditory-neuropathy animal model: effects of timing after injury. Journal of the Association for Research in Otolaryngology : JARO. 9, 225-240 (2008).
- Stevens, S. M., et al. Heptanol application to the mouse round window: a model for studying cochlear lateral wall regeneration. Otolaryngology--head and neck surgery : official journal of American Academy of Otolaryngology-Head and Neck Surgery. 150, 659-665 (2014).
- Zheng, Q. Y., Johnson, K. R., Erway, L. C. Assessment of hearing in 80 inbred strains of mice by ABR threshold analyses. Hearing research. 130, 94-107 (1999).
- Hequembourg, S., Liberman, M. C. Spiral ligament pathology: a major aspect of age-related cochlear degeneration in C57BL/6 mice. Journal of the Association for Research in Otolaryngology : JARO. 2, 118-129 (2001).
- Ohlemiller, K. K., Gagnon, P. M. Apical-to-basal gradients in age-related cochlear degeneration and their relationship to 'primary' loss of cochlear neurons. The Journal of comparative neurology. 479, 103-116 (2004).
- Tadros, S. F., D'Souza, M., Zhu, X., Frisina, R. D. Apoptosis-related genes change their expression with age and hearing loss in the mouse cochlea. Apoptosis : an international journal on programmed cell death. 13, 1303-1321 (2008).
- Souza, M., Zhu, X., Frisina, R. D. Novel approach to select genes from RMA normalized microarray data using functional hearing tests in aging mice. Journal of neuroscience. 171, 279-287 (2008).
- Tang, X., et al. Age-related hearing loss: GABA, nicotinic acetylcholine and NMDA receptor expression changes in spiral ganglion neurons of the mouse. Neuroscience. 259, 184-193 (2014).
- Borkholder, D. A., Zhu, X., Frisina, R. D. Round window membrane intracochlear drug delivery enhanced by induced advection. Journal of controlled release : official journal of the Controlled Release Society. 174, 171-176 (2014).
- Tadros, S. F., D'Souza, M., Zhu, X., Frisina, R. D. Gene expression changes for antioxidants pathways in the mouse cochlea: relations to age-related hearing deficits. PloS one. 9, e90279(2014).
- Lang, H., et al. Sox2 up-regulation and glial cell proliferation following degeneration of spiral ganglion neurons in the adult mouse inner ear. Journal of the Association for Research in Otolaryngology : JARO. 12, 151-171 (2011).
Reprints and Permissions
