The present protocol aims at assessing cognitive-emotional functions in the basal ganglia by simultaneous neurophysiological recording of local field potentials and non-invasive brain cortical activity (EEG). The procedure is exemplified by the use of paradigms involving speech stimuli with emotional connotation or the Flanker task involving cognitive control.
A subscription to JoVE is required to view this content. Sign in or start your free trial.
Method Article
Combined Invasive Subcortical and Non-invasive Surface Neurophysiological Recordings for the Assessment of Cognitive and Emotional Functions in Humans
In This Article
Summary
Abstract
In spite of the success in applying non-invasive electroencephalography (EEG), magneto-encephalography (MEG) and functional magnetic resonance imaging (fMRI) for extracting crucial information about the mechanism of the human brain, such methods remain insufficient to provide information about physiological processes reflecting cognitive and emotional functions at the subcortical level. In this respect, modern invasive clinical approaches in humans, such as deep brain stimulation (DBS), offer a tremendous possibility to record subcortical brain activity, namely local field potentials (LFPs) representing coherent activity of neural assemblies from localized basal ganglia or thalamic regions. Notwithstanding the fact that invasive approaches in humans are applied only after medical indication and thus recorded data correspond to altered brain circuits, valuable insight can be gained regarding the presence of intact brain functions in relation to brain oscillatory activity and the pathophysiology of disorders in response to experimental cognitive paradigms. In this direction, a growing number of DBS studies in patients with Parkinson's disease (PD) target not only motor functions but also higher level processes such as emotions, decision-making, attention, memory and sensory perception. Recent clinical trials also emphasize the role of DBS as an alternative treatment in neuropsychiatric disorders ranging from obsessive compulsive disorder (OCD) to chronic disorders of consciousness (DOC). Consequently, we focus on the use of combined invasive (LFP) and non-invasive (EEG) human brain recordings in assessing the role of cortical-subcortical structures in cognitive and emotional processing trough experimental paradigms (e.g. speech stimuli with emotional connotation or paradigms of cognitive control such as the Flanker task), for patients undergoing DBS treatment.
Introduction
Invasive neurophysiological recordings in humans date back to seminal studies targeting electrocorticographic recordings from cortical areas and the cerebellum during epilepsy surgery and tumor research1. A critical milestone into further development of such recording procedure has been the introduction of the stereotactic technique that provides safe and efficient access to deep structures of the human brain2. Apart from clinical treatment, brain invasive approaches in humans provide a rather unique opportunity to study brain function in relation to recorded activity patterns modulated by external stimuli, notably the case of intra- and post-operative invasive recordings in patients undergoing deep brain stimulation (DBS) procedures. The applicability and usefulness of DBS has been addressed in various neurological and neuropsychiatric diseases from Parkinson's disease (PD) to obsessive compulsive disorder (OCD) or conditions like chronic disorders of consciousness (DOC).
In particular, DBS has been applied in the treatment of Parkinson's disease3,4,5, essential tremor6, primary/generalized segmental dystonia7,8,9, Huntington's disease10,11, treatment-resistant-depression12,13, nicotine and alcohol addiction14, Alzheimer's disease15,16, Tourette's syndrome17 and chronic disorder of consciousness (DOC)18,19,20.
Within the scope of neuropsychiatry, DBS is an approved/CE-marked treatment for obsessive compulsive disorder (OCD) targeting the anterior limb of the internal capsule (ALIC) and is in use targeting the ventral capsule/ventral striatum/ventral caudate (VC/VS),nucleus accumbens (Nac) and the subthalamic nucleus (STN)21. Regarding DBS in OCD22, recent studies emphasize the role of STN into the mechanism of compulsive checking by utilizing memory based-paradigms23,24,25.
Noteworthy, modulation of brain activity under the influence of paradigms with cognitive and emotional connotation has been emphasized in DOC26,27,28,29. Thus, DBS is highlighted not only as a prospective treatment for chronic DOC, but also as a clinical procedure that opens up the possibility of studying the modulation of subcortical activity by recording local field potentials (LFP) from central thalamic regions intra- and post- operatively.
In DBS, neurosurgical implantation of electrodes is based on the stereotactic technique that safely accounts for brain anatomical constraints, while patient's stimulation is customized through intra-operative impulse-stimulation tests. Post-operative LFP recording is possible after initial implantation of DBS electrodes and before internalization of the impulse generator. In particular, the present protocol is centered on post-operative recordings.
In combination with LFPs, simultaneous recording of cortical brain activity can be achieved for instance by non-invasive electroencephalography (EEG) or magnetoencephalography (MEG)30,31. These two non-invasive methods are supported due to its excellent time resolution. While MEG is less affected than EEG by skull effects32, EEG appears advantageous because it is less affected by artifacts caused by metallic implants and head movements and it can be used at the patient's bed-side33. By simultaneous recording of cortical-subcortical brain activity (LFP and EEG/MEG) in response to applied emotional-cognitive paradigms, different relationships between brain oscillations and behavior could be established on the basis of time-frequency coupling analyses34. In turn, such patterns could lead to prospective biomarkers of a patient's individualized cognitive and emotional states and optimization of treatment parameters considering individualized settings.
The following protocol targets invasive and non-invasive neurophysiological recording in humans for the assessment of cognitive and emotional function, specifically at the cortical and subcortical level (EEG and LFPs).
First, the neurophysiological recording steps illustrated in the video, that accompanies the present protocol, correspond to a recording with an example patient with movement disorder that performs the so called Flanker task (Example 1).
Second, steps in the protocol are discussed by focusing on the methodology of analysis and sample results taken from a published DBS example in chronic DOC26 (Example 2).
These two examples highlight the applicability of the proposed protocol to DBS-treated patients with different disorders and various experimental paradigms.
Access restricted. Please log in or start a trial to view this content.
Protocol
The DBS procedure and invasive recordings were approved by the Ethics Commission of the University Clinic Düsseldorf, Germany.
1. Experimental Paradigm Design and Patient's Consent
NOTE: Design an experimental paradigm or select an existing experimental paradigm to target a cognitive/emotional aspect of interest.
- Select patients that will undergo DBS-treatment. Ask if the DBS-Patient meets the study's inclusion criteria. If yes, obtain signed informed consent from patient and/or ethical commission (if applicable) to carry out a post-operative recording and application of the respective cognitive paradigm.
Note: Post-operative recording takes place the following day after an initial DBS surgery is carried out for DBS electrode implantation (together with their corresponding externalization from the head by means of special cables) and before a second surgery takes place regarding permanent implantation of DBS electrodes and stimulator.- In the Flanker task (Example 1), obtain signed informed consent from a patient with movement disorder (e.g. Huntington's or Parkinson's disease) in order to carry out a post-operative recording. The goal of the Flanker experiment is to test the patient's ability for adaptation to error behavior and to determine how such adaptation is reflected on brain oscillatory activity at the cortical and subcortical level.
NOTE: The choice of a patient is dictated by the cognitive mechanism to be addressed and the patient's disorder. In the DBS-DOC case-example (Example 2), a female DOC patient who suffered from a head injury at the age of 38 was selected. Because of the patient' condition limiting informed consent, DBS treatment and experimental participation was approved solely by the local ethics commission. The main goal of the DOC postoperative recording was to determine whether brain function in relation to cognitive-emotional processing was still intact in a patient with such severe disorder of consciousness.
- In the Flanker task (Example 1), obtain signed informed consent from a patient with movement disorder (e.g. Huntington's or Parkinson's disease) in order to carry out a post-operative recording. The goal of the Flanker experiment is to test the patient's ability for adaptation to error behavior and to determine how such adaptation is reflected on brain oscillatory activity at the cortical and subcortical level.
- Choose between the type of stimulus to be presented (auditory, visual). Identify the order of stimulus presentation (block or mixed design). Select the duration of stimulus, inter stimulus interval (ISI) and the number of trials.
- As one practical example perform the Flanker task (Example 1, Figure 1A), to examine the ability to adapt behavior in response to the commitment of response errors. This task consists of visual stimuli (flanked arrowheads vertically arranged).
- Flank the target stimulus (arrowhead in the center) by two adjacent arrows (above and below target) either pointing in the same (compatible) or opposite (incompatible) direction, additionally consider stop trials (circle in the center).
- Present the target to the left or right, and ask the participant to press a response button with their left or right thumb. In the stop trials, instruct the participants not to respond. Present flankers 200 msec before target. Display the target for 300 msec and set the response stimulus-interval to 2,000 msec (elapsed time is indicated by a cue tone). Present a total of four blocks of 120 stimuli each in this task. Present compatible (60%), incompatible (20%) and stop-trial (20%) stimuli randomly.
NOTE: This value for the stimulus-interval was chosen to avoid a large number of missed trials when considering motor disabled patients. Flankers and target were switched off simultaneously. Patients were instructed to respond as quickly as possible.
NOTE: In the DBS-DOC case-example (Example 2, Figure 1B), the experimental paradigm consisted of neutral non-addressing and familiar-addressing speech stimuli26 in a block design. The stimulus duration was set-up to 4 sec (with a randomized 4 5 sec inter-stimulus-interval). A total of 80 trials per condition were considered in this paradigm (Figure 1B).
- Envision the patient's physical constraints and needs in a post-operative setting recording. Specifically, determine if the patient is able to make use of the computer keyboard by considering the presence of excessive chorea movements (Huntington's disease) or tremor (Parkinson's disease).
- Make sure the patient is able to see the monitor (as the local anesthetic or the stereotactic head frame applied during DBS surgery may have caused swelling in the face and around the eyes) and sit comfortably during the duration of the whole experiment. Do not perform the experiment, if the patient fails to meet these conditions.
2. Set-up for Postoperative Subcortical (LFPs) and Surface (EEG) Recordings
- Set up the EEG equipment (see Materials in the supplementary files) in the room where the experiment will be conducted. Connect the recording computer to the EEG system. Start the EEG recording software (see "materials" in the supplementary files).
- Click "File" and then "New workspace" to define the workspace in the EEG recording software by specifying: a sampling frequency of 5 kHz, a low cut-off (DC) and high cut-off frequency (1,000 Hz), EEG channels according to the international 10/20 system (at least: fronto-central (Fz), centro-central (Cz), fronto-polar reference (Fpz) and ground (mastoid) and depending on the paradigm furthermore parieto-central (Pz), occipito-central (Oz), temporal (T3/T4), fronto-medial (F3/F4), fronto-lateral (F7/F8) ) (Figure 2D) and LFP channels (LFPL 0, LFPL1, LFPL2, LFPL3 (left hemisphere, Figure 2C); LFPR0, LFPR1, LFPR2 and LFPR3 (right hemisphere)). Click "Monitor" to verify that the specified channels are now set up for recording.
NOTE: The preparation beforehand of the workspace is recommended in order to minimize the experiment time and to oversee unexpected changes in the recording's configuration. It is recommended to ensure the highest temporal resolution, correct filter settings, adequate sampling rate and proper selection of channels of interest. - Set up the stimulus computer by connecting the parallel port to the EEG system. Start the stimulus software. Click "run" to check the paradigm's functionality on the computer's monitor (visual stimuli) and/or speakers (auditory stimuli, sound cues). Make sure markers (triggers) from the stimulus computer are read into the recording system during presentation of stimuli and subject's response by checking their appearance on the EEG recording software.
NOTE: Triggers from stimulus devices must have duration of at least 200 µsec to be detected by the EEG system (with the 5 kHz sampling rate). Since triggers are markers of event-related-events or evoked related activity that occur at a specified period of time their function is crucial for posterior data analysis. In the DBS-DOC case-example (Example 2), the experimental paradigm (Figure 1B) consisted of auditory stimuli (familiar an unfamiliar voices) so triggers were set up at the beginning and end of each stimuli presented. In the case of the Flanker task (Figure 1A) triggers were set up at the instant when 1) the flankers and target stimuli appeared, 2) the patient responded and 3) a cue tone was heard to inform the patient that the response-time had elapsed. - Mark the vertex of the patient's head as the midpoint between the nasion and inion by using a skin marker pen and by following the advice of an experienced neurologist or EEG specialist. Additionally, mark chosen EEG electrode positions using the 10-20 system. Attach EEG surface electrodes to the scalp by first cleaning each selected location with an isopropyl alcohol pad and after the use of abrasive paste.
NOTE: Such actions are constrained by the placement of bandages on the head of the DBS patient. However, an experienced neurologist should be able to define an appropriate (approximate) location for each electrode/channel. To ensure proper contact move hair out of the way (if applicable). The use of self-adhesive electrodes secured by surgical tape might be used due to easiness of placement. - Connect externalized DBS electrodes to a percutaneous extension. Connect percutaneous extension to external cable connector. Connect each electrode provided by the external cable connector to the EEG control box according to the EEG recording set-up. Connect EEG scalp electrodes to the EEG control box by first plugging ground and reference.
- Attach EMG electrodes (reference and active electrodes) at specified muscles by first cleaning the area with an isopropyl alcohol pad. Connect EMG electrodes to EEG control box.
NOTE: This step is optional and mainly conducted when motor tasks are considered into the paradigm or when it is required to monitor the activity of muscles as in the case of patients with motor disorder. - Click "Monitor" to visualize data. Make sure EEG and EMG signals displayed on the monitor are artifact-free by detecting the presence of jittering and superimposed high frequency components. Check guidelines about types of artifacts and other factors related to recording electroencephalographic signals35 and/or request technical advice from an experienced neurologist or neuroscientist until you become familiar with the type of disturbances present in such physiological recordings.
NOTE: This step is important to ensure high quality signals for off-line data analysis.
3. Recording of Post-operative Subcortical (LFPs) and Surface (EEG) Brain Activity
- Provide instructions to the patient. Make sure the patient is comfortable and instruct him/her to stop the experiment at any time of discomfort.
- Click "run" on the stimulus software so that the patient is able to see the paradigm on the monitor and/or listen to the cue tones and sounds. Perform a training session with the patient until he/she is comfortable with the task. Start simultaneous recording of subcortical (LFP) and cortical (EEG) brain activity while the patient performs the experimental task.
NOTE: In the case of the DBS-DOC case example (Example 2) the paradigm consisted of auditory stimuli in a block design as described in (Figure 1B). In the case of the Flanker task (Figure 1A), visual stimuli corresponding to three conditions (compatible (60%), incompatible (20%) and stop-trial (20%)) were presented randomly within each block (mixed design), each block consisted of 120 stimuli and the paradigm consisted of a total of four blocks. After the task has been finalized, data is stored on the hard disk of the recording computer for later off-line screening and quantitative analysis.
4. Data Analysis
NOTE: Steps by using EEG analysis software:
- Open the EEG analysis software (see "materials" in the supplementary files) and click "New" to visualize the recorded data by specifying the folder paths (raw, history and export) and data's name. Click "Edit channels" to select channels of interest. Rename channels if necessary.
- Click "Channel Preprocessing" and then "New Reference" to re-reference adjacent DBS contacts and thus create virtual bipolar contacts for left and right hemispheres. Repeat this process to create a virtual montage for EEG channels.
NOTE: A bipolar re-reference montage is important to minimize volume conduction effects and to improve spatial reliability of the recorded signals. In the case of the DBS-DOC case example (Example 2), the following bipolar channels were set-up DBS: LFPL01, LFPL12, LFPL23, LFPR01, LFPR12, LFPR23 and EEG: Cz/Fz, Pz/Cz, Oz/Pz, T3/Cz and T4/Cz. It is worthy to emphasize that while MEG recorded signals are reference-free, EEG signals need to be referenced to set true non-arbitrary zero value signals in a common framework. Existing EEG reference systems include: Cz or FPz reference, average between electrodes on the two ears, average reference (considering all of the channels), two- or single-mastoid reference and noise reference. For the purpose of data analysis, different re-reference arrangements can be utilized, for instance bipolar contacts are appropriate when targeting time-frequency coupling analysis between DBS and EEG signals. - Click "raw data inspection" to screen data for physiological and equipment related artifacts with emphasis on motor jittering and equipment disturbances. Mark segments in which artifacts are present.
NOTE: When recording scalp activity and simultaneously subcortical activity through DBS externalized leads, EEG appears more robust to noise artifacts than techniques such as MEG for which current efforts are being directed towards improving signal to noise ratio. Due that patients with motor disorders suffer from involuntary movements such as chorea and tremor the appearance of motor jittering artifacts in the recorded signals needs to be accounted for. Other disturbances are due to eye blinks and equipment related artifacts. Focusing on the DBS-DOC case example (Example 2), artifact inspection was performed by visual examination and artifacts were manually marked. The sole application of an automatic artifact inspection mode is discouraged as some artifacts may not be recognized by a specified criterion. - Click "Data Filtering" and then "IIR Filters" to specify a notch filter: 50Hz (dealing with power line artifacts) and Butterworth Zero Phase Filters by specifying Low and High Cutoff parameters. Click "Change Sampling Rate" to downsample the recorded signals to a specified frequency and also specify the interpolation type.
- In the DBS-DOC example; set Low Cutoff: 1.0000 Hz, Time constant: 0.1592s, slope: 48 dB/oct; High Cutoff: 80.0000 Hz, Time constant: 0.1592 sec and 48 dB/oct and downsampling frequency to 512 Hz by using spline interpolation.
NOTE: Optionally, perform filtering by customized scripts based on well-known open source suites: Fieltrip (http://www.fieldtriptoolbox.org/), EEGLab (http://sccn.ucsd.edu/eeglab/) and SPM8 (http://www.fil.ion.ucl.ac.uk/spm/software/spm8/). In the case of the first, sample scripts are provided in (http://www.fieldtriptoolbox.org/tutorial/preprocessing). Other suites also provide detailed documentation to carry out this step.
NOTE: Down-sampling at any point will limit the frequency space that is available for further analysis according to the Nyquist theorem. Considering the DBS-DOC case-example, the selected sampling frequency of 512 Hz is appropriate when considering a frequency band up to 80 Hz.
NOTE: Alternatively, perform down-sampling by customized scripts based on well-known open source suites: Fieldtrip (http://www.fieldtripbox.org), EEGLab (http://sccn.ucsd.edu/eeglab) and SPM8 (http://www.fil.ion.ucl.ac.uk/spm/software/spm8/). In the case of the first, script examples are provided (http://www.fieldtriptoolbox.org/tutorial/preprocessing). Other suites also provide documentation to carry out this step.
- In the DBS-DOC example; set Low Cutoff: 1.0000 Hz, Time constant: 0.1592s, slope: 48 dB/oct; High Cutoff: 80.0000 Hz, Time constant: 0.1592 sec and 48 dB/oct and downsampling frequency to 512 Hz by using spline interpolation.
- Export bipolar channels of interest by clicking "Export" and then "Generic Data". Export data markers (triggers) by clicking "Export" and then "Markers". Name the files to be exported by selecting a "txt" format.
NOTE: In order to use the Fieldtrip toolbox in the next steps it is suggested to export channels in (.txt) multiplexed format and also recommended to include a "vmrk" file that includes info about exported channels. It is also suggested to use a (.txt) format for the exported markers while the option of skipping markers corresponding to bad intervals selected in step 4) is offered.
NOTE: Steps by using Fieldtrip:
- Start-up MATLAB and click on "set path" to add the Fieldtrip folder's path in case it is not done by default.
- Put the data previously pre-processed and markers into a cell-array-structure that is compatible with the functions within Fieldtrip by running (Script 1-Supplementary File) without missing to specify: The directory that contains the EEG and LFP files from step 7, channel names, sampling frequency, sample time, trials. (Optionally) Perform artifact rejection by "uncomment" the indicated code. This script saves the data into a specified file that will be used in the next steps.
- Calculate LFP's spectral power for channels of interest by running (Script 2-Supplementary File) without missing to specify: the directory that contains the file generated by (Script 1), the method (wavelet or mtmconvol), the width of the window, the frequency of interest (foi), time's period of interest (toi), and frequency baseline correction (optional). Define the type of statistical analysis and desired p-value.
Note: In the DBS-DOC case-example (Example 2), power analysis was performed by considering a stimulus-locked wavelet time frequency analysis (Morlet wavelet (width = 5)) with Hanning taper, a frequency range of 4-80 Hz and a time period between -1 to 4 sec. Due that wavelets have variable resolution in time and frequency. When selecting a wavelet, we decide a trade-off between temporal and spectral resolution. In particular, Morlet wavelets possess a sinusoidal shape weighted by a Gaussian kernel that enables capturing local oscillatory components in a time series. Making the width parameter smaller will increase the temporal resolution at the expense of frequency resolution and vice versa. The spectral bandwidth at a given frequency F is equal to F/width x 2 (for F = 40 Hz and width = 5 the spectral bandwidth is 16 Hz) while the wavelet duration is equal to width/F/pi (for F=40 Hz and width=5 the wavelet duration is 39.8 msec). A cluster based (time and frequency variables) randomization approach was used for statistical analysis between conditions (p-level of .05 in a two-sided test) 39. As an example of the output obtained by performing this step please look at Figure 4A and Figure 4D. Time-frequency response analysis was performed by customized scripts based on the open source software Fieldtrip (http://www.fieldtriptoolbox.org/). Specific details about how to customize a script to accomplish this step can be found in http://www.fieldtriptoolbox.org/reference/ft_freqanalysis. - Calculate coherence between subcortical and cortical signals by running (Script 3-Supplementary File) without forgetting to specify: segments length, overlap percentage, frequency of interest. As for the statistical analysis specify the type of analysis and desired p-value.
Note: Coherence analysis measures the linear relationship between two time series with a constant ratio of amplitudes40. In the DBS-DOC case-example (Example 2), segments of 1 sec with 50% overlap were used for the calculation of coherence by focusing on the frequency interval between 1 and 25 Hz. A cluster-based (time and frequency variables) randomization approach was used for within-subject analysis of coherence (p-level of .05 in a two-sided test)41. Furthermore, the imaginary part of coherence was computed42.
The basic steps to customize a script for coherence analysis are described in (http://www.fieldtriptoolbox.org/tutorial/coherence). As an example of the output obtained by performing this step please look at Figure 4B. - Calculate cross frequency phase amplitude coupling (PAC) by running the software implementation available as supplementary file in reference43.
Note: In the DBS-DOC case example (Example 2), cross-frequency analysis PAC was calculated by using the entire free-artifact recording for different combinations of bipolar channels. In particular, normalized direct PAC (ndPAC)43 was preferred because it enabled determination of significant coupling at different statistical levels while setting-up to zero the non-significant couplings (p-level: 0.1). As a result, frequency ranges for phase and amplitude coupling could be selected on the basis of their significance. In the DBS-DOC case example, the phase frequency range considered was 3-22 Hz while the amplitude frequency range was set up to 35-80 Hz. The LFP-EEG channels selected for PAC analysis were LFPR23 and EEGFzPz on the basis of the coherence analysis performed in step 5.5. As an example of the output obtained by performing this step please look at Figure 4C.
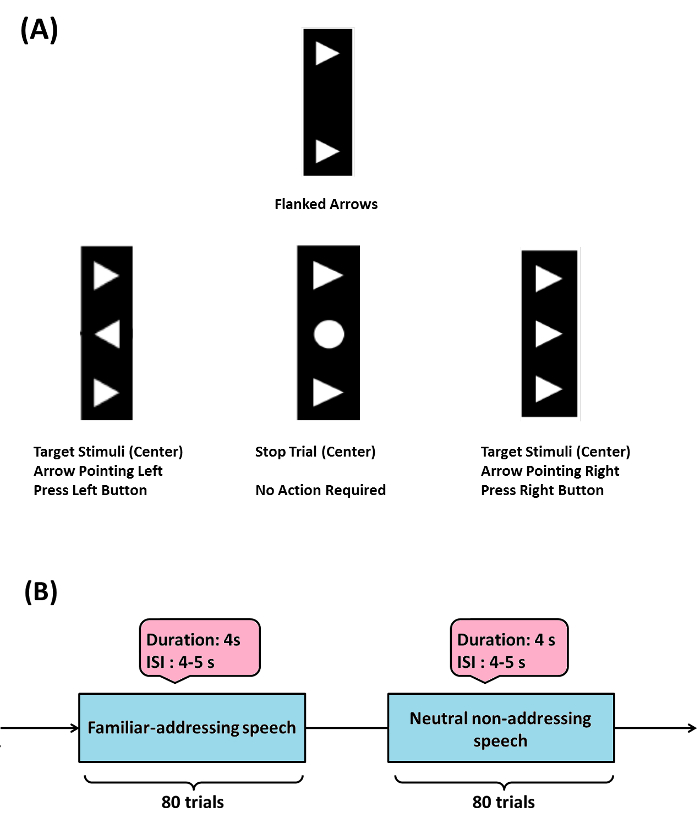
Figure 1: Sample Experimental Paradigms. (A) (Example 1) Flanker task: target stimulus (arrowhead in the center) is flanked by two adjacent arrows (above and below target) either pointing in the same (compatible) or opposite (incompatible) direction, stop trials (circle in the center) were also considered. When target is pointed to the left or right, a participant has to press a response button with their left or right thumb respectively, in the stop trials participants are instructed not to respond. The Flanker task used here was modified from the initially programmed version by Prof. C. Beste and his group (please see acknowledgements). (B) (Example 2) emotional-cognitive speech paradigm used in the DBS-DOC case-example. Please click here to view a larger version of this figure.
Access restricted. Please log in or start a trial to view this content.
Results
For the DBS-DOC case (Example 2), we now provide data on target localization for DBS implantation, schematic diagrams of LFP electrode and EEG set up, exemplary recordings of EEG and LFP activity (raw data) and representative analysis results:
Figure 2A shows planned trajectory (black line) projected on an anatomic atlas36, section 30, coronary, 10.7 mm behind the anterior commissure (AC) (red line: A...
Access restricted. Please log in or start a trial to view this content.
Discussion
In contrast to non-invasive brain recording techniques like scalp-EEG and MEG, the proposed combined invasive and non-invasive neurophysiological recording framework provides a remarkable opportunity to extract information from cortical and subcortical areas in relation to cognitive-emotional tasks. Such information is reflected by brain oscillatory activity at multiple frequency bands and different levels of organization in relation to brain functioning44. Brain oscillatory patterns that are relevant in our r...
Access restricted. Please log in or start a trial to view this content.
Disclosures
The authors declare that they have no competing financial interests.
Acknowledgements
This work was supported by ERA-NET NEURON/BMBF Germany (TYMON). Publication fees are covered by a grant from the University Hospital Düsseldorf. The Flanker task used here was modified from the initially programmed version by Prof. C. Beste and his group47.
Access restricted. Please log in or start a trial to view this content.
Materials
| Name | Company | Catalog Number | Comments |
|---|---|---|---|
| BrainAmp Amplifier | Brain Products GmbH, Gilching Germany | Quantity: 2 | |
| BrainVision Recorder Software | Brain Products GmbH, Gilching Germany | 1 License | |
| BrainVision Analyzer Software | Brain Products GmbH, Gilching Germany | 1 License | |
| Fiber Optic cables and USB connectors | Brain Products GmbH, Gilching Germany | These come with the above listed equipment | |
| Electrode Input box (64 channels) | Brain Products GmbH, Gilching Germany | Quantity: 1 | |
| EEG gel | Natus Inc | Quantity: 1 | |
| Isopropyl alcohol | Schülke & Mayr GmbH, Germany | Quantity: 1 | |
| Skin preparation gel | Weaver and Co, USA | Quantity: 1 | |
| MATLAB | Math-Works, Natick, Massachusetts, USA | 1 License | |
| FieldTrip toolbox | http://www.fieldtriptoolbox.org/ | Open Source | |
| Macroelectrodes (model 3387 quadripolar DBS lead) | Medtronic Inc., Minneapolis, MN, USA | Quantity: 2 | |
| Sterile percutaneous extension wires (model 3550-05) | Medtronic Inc., Minneapolis, MN, USA | Quantity: 2 | |
| Twist lock cable (model 3550-03) | Medtronic Inc., Minneapolis, MN, USA | Quantity: 2 | |
| custom made connectors to DIN 428092 touch proof connectors | Quantity: 2 | ||
| Vercise Lead kit DB -2201 | Boston Scientific | Quantity: 2 | |
| Contact extension kit NM-3138 | Boston Scientific | Quantity: 2 | |
| O.R. cabel & extension SC-4100 A | Boston Scientific | Quantity: 2 | |
| connector to touch proof | Twente Medical Systems International B.V. | Quantity: 2 | |
| CT scanner Modell PQ2000 (Postoperative CT scans) | Philips Healthcare GmbH Hamburg | Quantity: 1 | |
| Presentation Software (Flanker Task) | Neurobehavioral systems Inc. | 1 License | |
| MEG System | Elekta Neuromag Inc | Alternatively | |
| High-density EEG sensor net (128 or 256 channels) | Electrical Geodesics Inc (EGI), USA | Alternatively |
References
- Foerster, O., Altenburger, H. Elektrobiologische Vorgänge an der menschlichen Hirnrinde. Dtsch. Zschr. Nervenheilk. 135, 277-288 (1934).
- Spiegel, E. A., Wycis, H. T., Marks, M., Lee, A. J. Stereotaxic apparatus for operations on the human brain. Science. 106, 349-350 (1947).
- Okun, M. S. Deep-Brain Stimulation for Parkinson's disease. N. Engl. J. Med. 367, 1529-1538 (2012).
- Groiss, S. J., Wojtecki, L., Südmeyer, M., Schnitzler, A. Deep Brain Stimulation in Parkinson's disease. Ther. Adv. Neurol. Disord. 2 (6), 20-28 (2009).
- Kalia, S. K., Sankar, T., Lozano, A. M. Deep brain stimulation for Parkinson's disease and other movement disorders. Curr. Opin. Neurol. 26 (4), 374-380 (2013).
- Della Flora, E., Perera, C. L., Cameron, A. L., Maddern, G. J. Deep brain stimulation for essential tremor: a systematic review. Mov. Disord. 25 (11), 1550-1559 (2010).
- Volkmann, J., Benecke, R. Deep brain stimulation for dystonia: patient selection and evaluation [Review]. Mov. Disord. 17 (3), 112-115 (2002).
- Hu, W., Stead, M. Deep brain stimulation for dystonia. Transl. Neurodegener. 21 (3(1)), (2014).
- Mentzel, C. L., Tenback, D. E., Tijssen, M. A., Visser-Vandewalle, V. E., van Harten, P. N. Efficacy and safety of deep brain stimulation in patients with medication-induced tardive dyskinesia and/or dystonia: a systematic review. J. Clin. Psychiatry. 73 (11), 1434-1438 (2012).
- Huys, D., et al. Management and outcome of pallidal deep brain stimulation in severe Huntington's disease. Fortschr. Neurol. Psychiatry. 81, 202-205 (2013).
- Hartmann, C. J., Groiss, S. J., Vesper, J., Schnitzler, A., Wojtecki, L. Brain Stimulation in Huntington’s disease. Neurodegener. Dis. Manag. , (2016).
- Morishita, T., Fayad, S. M., Higuchi, M. A., Nestor, K. A., Foote, K. D. Deep brain stimulation for treatment-resistant depression: systematic review of clinical outcomes. Neurotherapeutics. 11 (3), 475-484 (2014).
- Lakhan, S. E., Callaway, E. Deep brain stimulation for obsessive-compulsive disorder and treatment-resistant depression: systematic review. BMC Res. Notes. 4 (3), 60(2010).
- Luigjes, J., et al. Deep brain stimulation in addiction: a review of potential brain targets. Mol. Psychiatry. 17, 572-583 (2012).
- Hardenacke, K., et al. Deep brain stimulation as a tool for improving cognitive functioning in Alzheimer's dementia: a systematic review. Front. Psychiatry. 4 (159), (2013).
- Laxton, A. W., Stone, S., Lozano, A. M. The Neurosurgical Treatment of Alzheimer's Disease: A Review. Stereotact. Funct. Neurosurg. 92, 269-281 (2014).
- Schrock, L. E., et al. Tourette syndrome deep brain stimulation: A review and updated recommendations. Mov. Disord. 30 (4), 448-471 (2015).
- Schiff, N. D., et al. Behavioral improvements with thalamic stimulation after severe traumatic brain injury. Nature. 448, 600-603 (2007).
- Yamamoto, T., Katayama, Y. Deep brain stimulation therapy for the vegetative state. Neuropsychol. Rehabil. 15, 406-413 (2005).
- Yamamoto, T., Kobayashi, K., Kasai, M., Oshima, H., Fukaya, C., Katayama, Y. DBS therapy for the vegetative state and minimally conscious state. Acta Neurochir. Suppl. 93, 101-104 (2005).
- Lipsman, N., Giacobbe, P., Lozano, A. M. Deep brain stimulation in obsessive-compulsive disorder: neurocircuitry and clinical. Handb. Clin. Neurol. 116, 245-250 (2013).
- Mallet, L., et al. Stimulation of subterritories of the subthalamic nucleus reveals its role in the integration of the emotional and motor aspects of behavior. Proc. Natl. Acad. Sci. USA. 104 (25), 10661-10666 (2007).
- Rotge, J. Y., et al. A challenging task for assessment of checking behaviors in obsessive-compulsive disorder. Acta Psychiatr. Scand. 117 (6), 465-473 (2008).
- Clair, A. H., et al. Excessive checking for non-anxiogenic stimuli in obsessive-compulsive disorder. Eur. Psychiatry. 28 (8), 507-513 (2013).
- Burbaud, P., et al. Neuronal activity correlated with checking behaviour in the subthalamic nucleus of patients with obsessive-compulsive disorder. Brain. 136, 304-317 (2013).
- Wojtecki, L., et al. Modulation of central thalamic oscillations during emotional-cognitive processing in chronic disorder of consciousness. Cortex. 60, 94-102 (2014).
- Menon, D. K., et al. Cortical processing in persistent vegetative state, Wolfson Brain Imaging Centre Team. Lancet. 352 (200), (1998).
- Monti, M. M., et al. Willful modulation of brain activity in disorders of consciousness. New. Engl. J. Med. 362, 579e589(2010).
- Owen, A. M., Coleman, M. R., Boly, M., Davis, M. H., Laureys, S., Pickard, J. D. Detecting awareness in the vegetative state. Science. 313, 1402(2006).
- Hirschmann, J., et al. A direct relationship between oscillatory subthalamic nucleus-cortex coupling and rest tremor in Parkinson's disease. Brain. 136, 3659-3670 (2013).
- Hirschmann, J., et al. Differential modulation of STN-cortical and cortico-muscular coherence by movement and levodopa in Parkinson's disease. Neuroimage. 68, 203-213 (2013).
- Okada, Y., Lähteenmäki, A., Xu, C. Experimental analysis of distortion of magnetoencephalography signals by the skull. Clin. Neurophysiol. 110, 230-238 (1999).
- Vaughan, T. M., McFarland, D. J., Schalk, G. The Wadsworth BCI Research and Development Program: at home with BCI. IEEE Trans. Neural Syst. Rehabil. Eng. 14, 229-233 (2006).
- Gross, J. Analytical methods and experimental approaches for electrophysiological studies of brain oscillations. J. Neurosci. Methods. 228, 57-66 (2014).
- Pivik, R. T., Broughton, R. J., Coppola, R., Davidson, R. J., Fox, N., Nuwer, M. R. Guidelines for the recording and quantitative analysis of electroencephalographic activity in research contexts. Psychophysiology. 30, 547-558 (1993).
- Mai, K. M., Assheuer, J. K., Paxinos, G. Atlas of the human brain (2nd edition). , Elsevier: Academic Press. (2004).
- Yelnik, J., et al. A three-dimensional, histological and deformable atlas of the human basal ganglia. I. Atlas construction based on immunohistochemical and MRI data. NeuroImage. 34, 618-638 (2007).
- Bardinet, E., et al. A three-dimensional histological atlas of the human basal ganglia. II. Atlas deformation strategy and evaluation in deep brain stimulation for Parkinson disease. J. Neurosurg. 110, 208-219 (2009).
- Maris, E., Oostenveld, R. Non-parametric statistical testing of EEG- and MEG-data. J. Neurosci. Methods. 164, 177-190 (2007).
- Halliday, D. M., Rosenberg, J. R., Amjad, A. M., Breeze, P., Conway, B. A., Farmer, S. F. A framework for the analysis of mixed time series/point process data-theory and application to the study of physiological tremor, single motor unit discharges and electromyograms. Prog. Biophys. Mol. Biol. 64, 237-278 (1995).
- Maris, E., Schoffelen, J. M., Fries, P. Nonparametric statistical testing of coherence differences. J. Neurosci. Methods. 163, 161-175 (2007).
- Nolte, G., Bai, O., Wheaton, L., Mari, Z., Vorbach, S., Hallet, M. Indentifying true brain interaction from EEG data using imaginary part of coherency. Clin. Neurophysiol. 115, 2292-2307 (2004).
- Ozkurt, T. E., Schnitzler, A. A critical note on the definition of phase-amplitude cross-frequency coupling. J. Neurosci. Methods. 201, 438-443 (2011).
- Schutter, D. J., Knyazev, G. G. Cross-frequency coupling of brain oscillations in studying motivation and emotion. Motiv. Emot. 36 (1), 46-54 (2012).
- Palva, J. M., Palva, S., Kaila, K. Phase synchrony among neuronal oscillations in the human cortex. J. Neurosci. 25 (15), 3962-3972 (2005).
- Oostenveld, R., Fries, P., Maris, E., Schoffelen, J. M. FieldTrip: open source software for advanced analysis of MEG, EEG, and invasive electrophysiological data. Comput. Intell. Neurosci. 156869, (2011).
- Beste, C., Mückschel, M., Elben, S., Hartmann, C. J., McIntyre, C. C., Saft, C., Vesper, J., Schnitzler, A., Wojtecki, L. Behavioral and neurophysiological evidence the enhancement of cognitive control under dorsal pallidal deep brain stimulation in Huntington’s disease. Brain. Struct. Funct. 220, 24441-24448 (2015).
Access restricted. Please log in or start a trial to view this content.
Reprints and Permissions
